

Abstract
Chromatin conformation is dynamic and heterogeneous with respect to nucleosome positions, which can be changed by chromatin remodeling complexes in the cell. These molecular machines hydrolyze ATP to translocate or evict nucleosomes, and establish loci with regularly and more irregularly spaced nucleosomes as well as nucleosome-depleted regions. The impact of nucleosome repositioning on the three-dimensional chromatin structure is only poorly understood. Here, we address this issue by using a coarse-grained computer model of arrays of 101 nucleosomes considering several chromatin fiber models with and without linker histones, respectively. We investigated the folding of the chain in dependence of the position of the central nucleosome by changing the length of the adjacent linker DNA in basepair steps. We found in our simulations that these translocations had a strong effect on the shape and properties of chromatin fibers: i), Fiber curvature and flexibility at the center were largely increased and long-range contacts between distant nucleosomes on the chain were promoted. ii), The highest destabilization of the fiber conformation occurred for a nucleosome shifted by two basepairs from regular spacing, whereas effects of linker DNA changes of ∼10 bp in phase with the helical twist of DNA were minimal. iii), A fiber conformation can stabilize a regular spacing of nucleosomes inasmuch as favorable stacking interactions between nucleosomes are facilitated. This can oppose nucleosome translocations and increase the energetic costs for chromatin remodeling. Our computational modeling framework makes it possible to describe the conformational heterogeneity of chromatin in terms of nucleosome positions, and thus advances theoretical models toward a better understanding of how genome compaction and access are regulated within the cell.
Introduction
The eukaryotic genome is hierarchically organized into chromatin. Its conformation is an important factor for regulating DNA accessibility for gene expression, replication, and repair (1,2). The basic repeating unit of chromatin is the nucleosome, which consists of an octameric protein core composed of two copies each of histone proteins H2A, H2B, H3, and H4, and 146 bp of DNA wrapped around the histone core in ∼1.65 turns (3,4). A fifth histone protein, the linker histone H1 or its avian counterpart H5, can associate with the nucleosome core and promote further compaction (5). The nucleosomes are connected by the intervening linker DNA, which measures 20–80 bp, depending on the organism, tissue, or cell type. Furthermore, variations of linker DNA length are found within the genome of a single cell (6).
In low salt, nucleosomes connected by linker DNA adopt an open beads-on-a-string-like structure (2). Under physiological salt conditions this structure condenses in vitro into a fiber-like arrangement of nucleosomes with a diameter of ∼30 nm, referred to as 30 nm chromatin fiber (7). The detailed structure of the 30 nm chromatin fiber in vitro and within the cell is still under investigation. Various studies have proposed different conformational models (8–18). The presence of 30 nm fibers in transcriptionally inactive cells like starfish sperm (19) and avian erythrocyte (20) was shown by electron microscopy. The analysis of other cellular systems led to the conclusion that the dominant chromatin structure are irregular 10-nm chains in a polymer melt three-dimensional (3D) organization (21–25). This type of chromatin folding is promoted by high nucleosome concentrations and an irregular spacing of nucleosomes as discussed previously (26). Interestingly, regularly spaced arrays up to several hundred nucleosomes were identified in human lymphoblastoid cell lines by high-resolution nucleosome positioning mapping (27). In the latter study, it was estimated that regularly spaced tracts of nucleosomes may be present in almost half of the genome. Although no data on the 3D-folding of the above regularly spaced regions within the cell exist, in vitro studies showed that these types of arrays adopt regular 30-nm-type chromatin fibers (8,13,18). To date, the latter studies provide the highest resolution of folded nucleosome chains, which serve here as well-defined in vitro reference systems for dissecting the properties of nucleosome chains by computer simulations.
The 30 nm chromatin fiber models proposed in the literature describe the spatial arrangement of the nucleosomes with respect to each other and the path of the connecting linker DNA. Most models can be assigned to one of two main categories: solenoid and zigzag models. In solenoid models nucleosomes form stacks with their direct neighbors in the nucleosome chain, with the linker DNA bending toward the fiber center. In contrast, in zigzag or crossed-linker models nucleosomes are stacked only with nonneighbors in the nucleosome chain, with the linker DNA passing straight through the fiber center in a zigzag manner (28,29). In recent years, approaches to model chromatin structure and dynamics by means of computer simulation considering the effects of energy and thermal fluctuations have made significant progress as reviewed recently (26). In particular, the size of systems and level of molecular detail amenable to numerical simulations has been largely improved (30–32). Current models of the 30 nm chromatin fiber frequently assume regularly spaced nucleosomes with uniform linker DNA length. However, for chromatin in vivo variations in nucleosome spacing are observed throughout the genome and between cell types (6,27,33–36). At some genomic regions and around binding sites of the transcription factor CTCF, nucleosomes are highly ordered (6,27,37). However, in general, the heterogeneity of nucleosome spacing within a given genomic locus is considerable as discussed in our previous work (36,38).
To incorporate a nonconstant repeat length Woodcock et al. (39) introduced Gauss-distributed linker variations into their chromatin model; these led to changes in fiber direction and apparent discontinuities. A study using computer simulations of nucleosome chains with varying angles between adjacent nucleosomes showed an increase in fiber flexibility with increasing variability (40). Both models investigated the effect of an overall distribution of varying linker length, not the effect of individual repositioned nucleosomes.
The positions of nucleosomes in vivo are not fixed but actively regulated by specific proteins, so-called chromatin remodeling complexes, which can change the packaging state of chromatin to control critical cellular processes such as gene regulation. These ATP-driven proteins have the capability to disrupt nucleosome-DNA contacts, move nucleosomes along DNA, and remove or exchange nucleosomes (41–43). The remodeling complexes translocate nucleosomes in small well-defined steps (44,45). Thus, nucleosome positions are dynamically controlled on the level of individual nucleosomes by the cell.
Here, we have investigated the impact of repositioning a single nucleosome in the context of various chromatin fiber conformations using a computer model, which aims at the understanding of the folding of larger structures neglecting detailed electrostatics (17,40,46). We analyzed the effects of repositioning on the global chromatin fiber shape and determined the energetic barriers imposed on nucleosome repositioning by structural properties, Furthermore, we considered changes in nucleosomal contact probabilities. These analyses provide indications for key mechanisms of the interaction between higher-order chromatin structure and nucleosome repositioning. To clearly identify the effects of repositioning and to prevent the interference of multiple irregularities, only a single nucleosome was manipulated in an otherwise regularly spaced nucleosome chain. We find that the single nucleosome translocations can have large effects on the shape and properties of chromatin fibers with respect to the global geometry as well as short- and long-range interactions between nucleosomes.
Materials and Methods
A computer simulation approach was used to study the impact of repositioning a single nucleosome on fiber structure and energetics. For every repositioning step, an accordingly modified structure was simulated using a coarse-grained Monte Carlo simulation model in combination with a feedback-optimized replica exchange approach (17,46,47). The resulting fiber trajectories were analyzed to investigate the energetic and conformational changes over the range from 0 to 10 bp of repositioning in basepair resolution.
Coarse-grained chromatin model
We used a coarse-grained model of chromatin, which has been described previously (26,46,48), and especially in great detail in the supplemental material of (17). The linker DNA between nucleosomes is modeled as chains of cylindrical segments with a diameter of 1.2 nm. Nucleosomes are represented by cylinders with dimensions of 11 nm diameter and 5.5 nm height. Harmonic potentials for stretching, bending, and torsion represent the elastic properties of the linker DNA. In contrast to some of our previous work modeling chromatin stretching, here unwrapping of DNA from the nucleosome core was not included, because in the absence of external forces unwrapping is typically limited to fluctuations of about a basepair around an average value. This has only little effect on the relative orientations of two nucleosomes with respect to each other for the equilibrium conformation (49–52). Electrostatic interactions between linker DNA segments are modeled by charged spheres placed within the segments (see the Supporting Material, Materials and Methods). Interactions between nucleosomes are described by a potential based on S-functions approximating oblate spherocylinders (46,53). For more details see the Supporting Material, Materials and Methods. The simulation parameters used in this work are listed in Table S3.
Modeling of nucleosome repositioning
We used three models of different chromatin systems in the simulations (17). The first was a two-start cross-linker model (CL) with a nucleosome repeat length (NRL) of 169 bp, derived from the tetranucleosome crystal structure (9,48). The second was a crossed-linker model describing a conformation found in chicken erythrocyte chromatin with a H5 linker histone-dependent nucleosome stem structure of the linker DNA (CLS) and a NRL of 212 bp (40,46). The third model was a fiber model with interdigitated nucleosomes in the presence of linker histone H1 (ID), derived from electron microscopy studies of reconstituted chromatin fibers (8,15,48). This model’s NRL was 197 bp. An overview of the model structures and associated parameters is given in Fig. 1 and Table 1. To explore the effects of repositioned nucleosomes in a well-defined reference system, we chose strictly regular fiber conformations for our simulations in which only the central nucleosome was repositioned. Each fiber conformation contained 101 nucleosomes with the structural parameters listed in Table S2.
Figure 1.
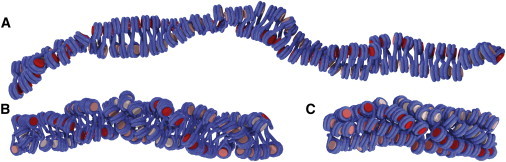
Three-dimensional visualization of the chromatin fiber models used in this work: (A) CL, (B) CLS, (C) ID; DNA is colored in blue, histones in shades of red where the shade denotes the fiber repeats. To see this figure in color, go online.
Table 1.
Overview of the main properties of the 30 nm chromatin fiber models used
| Fiber model type | NRL (bp) | Linker length (bp) | Nucleosome density (nucleosomes/11 nm) | No. of stacks |
|---|---|---|---|---|
| CLS | 212 | 65 | 4.6 | 3 |
| CL | 169 | 22 | 2.9 | 2 |
| ID | 197 | 50 | 8.1 | 6 |
No. of stacks indicates the number of nucleosome stacks formed by the respective fiber structural motif.
Starting from these basic fiber conformations, we generated modified conformations with one nucleosome repositioned in consecutive 1 bp steps (see next paragraph). Following this process, for every fiber model we obtained 11 conformations with successive nucleosome displacements, which were simulated. This approach enables the modeling of defined chromatin fiber states that map to possible intermediates of a repositioning event. As the single fiber conformations differ only in small, well-defined details, it is possible to relate the structural modifications to resulting changes in the 3D fiber structure and hence to the energetic landscape of the system.
Inducing nucleosome repositioning in chromatin fibers
To investigate the structural behavior of the investigated fiber types over the range of repositioning steps from 0 to 10 bp, we first prepared an initial configuration for each fiber type, which represents the unmodified state without any repositioning. Each of these configurations contains 101 nucleosomes. The resulting configurations are strictly regular with respect to the length of linker DNA connecting the nucleosomes and rotational positioning of the nucleosomes. For every repositioning step from 1 to 10 bp, the initial configuration was modified by displacing the nucleosome at the fiber center, which is implemented in the following way (Fig. S4):
denotes the repositioning distance, and stand for the default lengths of the linkers preceding and succeeding the repositioned nucleosome in the unmodified state. represents the torsional angle relating to adjacent nucleosomes in the unmodified state. The linker lengths , and torsional angle resulting from nucleosome displacement are computed based on the repositioning distance d. All other angles of the local nucleosome geometry remain unchanged. These calculations yielded 11 configurations per fiber model, each one representing a particular stage of the remodeling process.
Monte Carlo simulation
Representative equilibrium fiber conformations were generated by Monte Carlo simulations. The classical Metropolis Monte Carlo algorithm was used to create a statistically relevant set of configurations satisfying the Boltzmann distribution (40,54). For each Monte Carlo step, modified configurations were generated by applying rotation and pivot moves on the linker DNA and nucleosome segments (40). To ensure uniform sampling of the phase space and to minimize the bias that might be induced by energetic bottlenecks, we used a replica exchange algorithm; this was preceded by a simulated annealing and a feedback-driven iterative optimization to adapt the replica exchange temperature sets to the respective fiber models (46,47,55). For details see the Supporting Material, Materials and Methods.
All configurations were at first simulated for 107 Monte Carlo steps to reach thermal equilibrium. After preparation, for every configuration a set of 16 replicas was created, alongside with an initial temperature set. Temperature set optimization was then applied for 5–7 iterations on every replica set, until the temperature set showed sufficient convergence (47). The number of iterations varied between the respective fiber models as a result of their different convergence properties. Finally, replica exchange Monte Carlo simulations were conducted on all configuration replica sets for 6 × 10⁷ Monte Carlo steps and samples were drawn focusing a target temperature of 293 K. To minimize autocorrelation bias, the sampling frequency was chosen so that sufficiently uncorrelated samples were drawn. To confirm that the simulations have reached equilibrium, the development of the total energy was analyzed (Fig. S2).
The complete simulation of a single configuration required 8,000–10,000 CPU h on the North-German Supercomputing Alliance (HLRN) supercomputer HLRN-II (Intel Xeon Quad-Core Gainestown (Nehalem EP, X5570), 2.93 GHz). A total of 280,000 CPU h was required in the course of this work. We used eight cores for a simulation run of one replica, resulting in 128 cores for 16 replicas.
Calculation of mean fiber bending angles
The mean bending angle was measured between the two fiber parts separated by the repositioned nucleosome (Fig. S5 A). To minimize boundary effects at the fiber ends, only the fiber segments representing the middle third of each fiber part were considered in further analysis. To make the single snapshots of a simulation run comparable, they were structurally aligned. To this end consensus coordinates of the first fiber part were calculated from all configurations. Each configuration was then rotated and translated so as to align to these consensus coordinates, using the Kabsch algorithm (56,57) for the calculation of the rotation matrices. Using 3D smoothing splines (58,59) (Fig. S5 B) to the segment positions for each fiber part a least squares straight line fit was applied to generate the centroid vectors of both fiber parts. The centroid vectors of the aligned fiber parts showed high correlation as a result of the preceding consensus coordinate alignment step. Next, we calculated the vector mean of the centroid vectors of the second part of the fiber (Fig. S5 C). The angle between the centroid vector of the consensus coordinates and the vector representing the mean bending vector was then calculated by simply applying the vector dot product.
Nucleosomal contact maps
Nucleosomal contact maps visualize possible nucleosomal interactions in chromatin as matrices (60), based on the assumption that nucleosomes which reside in close spatial proximity have a high probability of interacting. Contact maps for simulated fiber models were created by tracing the distances between all n2 possible pair combinations of the n nucleosomes over the whole simulation run. Nucleosome pairs with distances smaller than 1.5 times the nucleosome radius were regarded as being in contact. Hence, the contact probability P of a particular nucleosome pair with index i and j is given by Eq. 1:
with being the number of samples in which the nucleosome pair ij in contact and being the total number of simulation samples.
Results
Including irregular nucleosome positioning into chain models for Monte Carlo simulations
In our previous work, we calculated electrostatic interactions of DNA with a model in which it was described by homogeneously charged cylindrical segments (40). This approach restricted the simulations to a constant length of linker DNA segments. To simulate chains with variable DNA linkers, we developed a description with an arbitrary number of charged spheres as described in the Supporting Material. With this implementation, we examined the energetic variations of chromatin fibers caused by repositioning of a nucleosome in Monte Carlo simulations with a coarse-grained model that includes fiber geometry and energies according to the computational framework described previously (17,40,46,48). We generated statistically valid ensembles of fiber conformations in thermal equilibrium to assess the contribution of nucleosome repositioning within a regular chromatin fiber for different fiber types. Furthermore, we investigated the variations of the mean fiber bending angles and their mean deviations and conducted a detailed evaluation of the internucleosomal contacts on the scale of nucleosome pairs.
Fiber geometries show significant changes upon nucleosome repositioning
Visual inspection of the simulated fiber configurations revealed an apparent effect of repositioning of a single nucleosome on the overall fiber geometry (see Fig. S6 for a visualization of example fiber conformations of all three fiber types at various nucleosome displacements). We measured changes up to 140° for the fiber mean bending angle δ at the repositioned nucleosome (Fig. 2 A). In particular, the CL and CLS fibers showed a significant bending, with local maxima at d = 3 and d = 7–8 bp and local bending minima at d = 5 and 10 bp. The CL fiber showed strong bending at these maxima with δ = 140°, and the CLS showed a medium increase of δ by 45°. The bending occurs at the repositioned nucleosome and can bring distant parts of the fiber into spatial proximity (see Fig. S7 for snapshots). The periodic shape of the curves correlated with the change of spatial orientation of the repositioned nucleosomes with respect to its stack neighbors. This suggests that the repositioned nucleosome occupied more space between its neighbor nucleosomes, and hence pushes them further apart, when it is forced into a transversal spatial orientation by repositioning. In contrast, the ID fiber showed only a small increase of bending by ∼10°. The differences between the three fiber types suggest that the extent of fiber bending may be associated with the number of stacks formed by the respective structural motifs as the nucleosome rotation induced by repositioning only leads to a limited loss of stacking interactions with the adjacent nucleosomes. Thus, the ID fiber conformation with a higher number of nucleosome stacks is more resistant to global changes of its structure.
Figure 2.
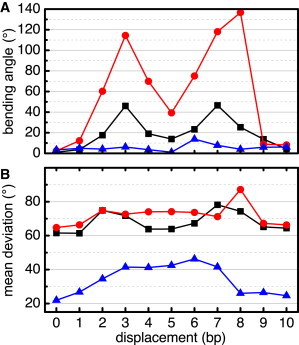
Mean fiber bending angle (A) and standard deviation (B) of the CL (red circles), CLS (black squares), and ID fiber models (blue triangles) as a function of nucleosome displacement d. To see this figure in color, go online.
Repositioning renders fibers more flexible
Our simulations showed that repositioning of a nucleosome changes the flexibility of a fiber. In this context, the standard deviation of the fiber’s mean bending angle can serve as an indicator for flexibility (Fig. 2 B). The unmodified CL and the CLS fiber showed comparable standard deviation values of ∼65°. However, the standard deviation of the unmodified ID fiber was significantly lower than these, with ∼20°, indicating a significantly higher rigidity. Upon repositioning, the standard deviation of the bending increased for all three fiber types by ∼20° and then returned to values similar to those of the unmodified states. For both, CL and CLS fiber, the flexibility changed similarly upon repositioning. After a marginal increase of standard deviation at d = 1 bp, both fibers showed a rise at d = 2 bp. The flexibility then stayed nearly the same until d = 8 bp for the CL fiber, whereas a transient decline of standard deviation was observed for the CLS fiber around d = 5 bp. Both fibers then showed a maximum around d = 7–8 bp before dropping back to a level similar to that of the unmodified state. In contrast, the ID fiber showed a very different variability behavior upon repositioning. After a small increase at d = 1 bp its standard deviation grew linearly until reaching a maximum around d = 3 bp. The standard deviation then remained at that level until it decreased again to a value close to the initial level at d = 8 bp.
The 3D fiber conformation can impose an energy barrier toward repositioning of a nucleosome
For the evaluation of the energy barriers, the mean total energy Ed at each basepair step of displacement was calculated for all modeled fibers. The unmodified state, i.e., 0 bp displacement, serves as reference to compute the energy differences ΔE = Ed – E0 to states containing a repositioned nucleosome. The energy offsets were then plotted against displacement (Fig. 3) to visualize the energetic barriers a remodeling process would have to surpass in the presence of chromatin structure constraints. All three fiber conformations imposed energetic barriers toward nucleosome repositioning. The CL and CLS fibers had similar maximum ΔE values of ∼30 kJ/mol, whereas the ID fiber had a significantly higher maximum ΔE of 108 kJ/mol. This remarkable difference in maximum ΔE may reflect the higher number of stabilizing nucleosome stacks in the ID fiber. The CL and CLS fibers had some characteristics in common despite their differing structural parameters, such as NRL and nucleosome density. They had not only similar maximum ΔE levels, but also similar slope characteristics at low d.
Figure 3.
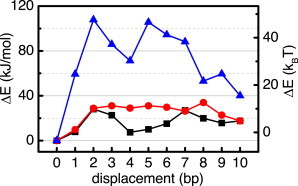
Mean total fiber energy differences ΔE of the CL (red circles), CLS (black squares), and ID fiber models (blue triangles) as a function of nucleosome displacement d. To see this figure in color, go online.
All fiber types showed a similar behavior of ΔE at the beginning and at the end of the displacement range, rising from d = 0 to d = 2 bp and declining toward d = 10 bp. However, the fiber energy at d = 10 bp was higher than at d = 0 bp for all fibers. Between d = 2 and d = 8 bp the fibers had different properties. The CLS and ID fibers showed a local minimum at d = ∼4–5 bp, whereas the CL fiber showed an approximate plateau over the whole range of d = 2–8 bp, with a small increase at d = 8 bp. Although the shapes of these curves do not resemble the high level of symmetry observed for bending angles and flexibility, the preference for 10 bp phasing can still be seen from the minima at d = 0 and d = 10 bp.
Of interest, the highest barrier and steepest rise of ΔE was reached at a nucleosome displacement of only 2 bp for all fiber types. This can be explained by the energy necessary to break the internucleosomal interactions present between the stacked nucleosomes and to overcome the spatial constraints introduced by the neighbor nucleosomes at the start of repositioning. For a remodeling process the early barrier maximum suggests that after surpassing this main barrier peak it is energetically more favorable to carry on with the repositioning process than it is to step back to the initial position. Thus, an apparent cooperativity of the translocation process could arise from the structural features of the nucleosome chain. The associated energy terms are significant in reference to the free energy costs of disassembling a histone core from DNA of 42 kBT (61,62). The high energetic barrier imposed by the ID fiber structure against remodeling activity is of similar magnitude, and corresponds to that for the hydrolysis of 2–3 ATP. The maximum energetic barriers of the CL and the CLS fiber are somewhat lower and range from 15–18 kBT, which is in the range of the hydrolysis of 1 ATP. In the absence of ATP-driven processes (62), the energy barriers in the fiber models that we have investigated would greatly slow down the repositioning of nucleosomes resulting from mere thermal fluctuations. We would like to point out, that the absolute values of the height of the energy barrier should be used with considerable caution because the calculations are based on a coarse-grained model, which by its nature does not include all details of the real system.
Effects on local and remote nucleosomal contacts
Geometric changes in chromatin fibers upon repositioning can be studied by analyzing interactions between individual nucleosomes of a fiber using contact maps (60). Here, the computed probabilities for a minimum distance between two nucleosomes are visualized for all pairs (Fig. 4). These contact maps changed with repositioning in the line of the preceding results. Compared with the unmodified fiber (d = 0) at d = 1 bp the contact probabilities did not change significantly (data not shown). In the range from 2 to 8 bp, significant alterations in contact probability were visible. Around 5 bp changes decreased for the CL and the CLS fiber, whereas the map for the ID fiber stayed similar. At repositioning distances around 10 bp, the changes diminished for all fiber types.
Figure 4.
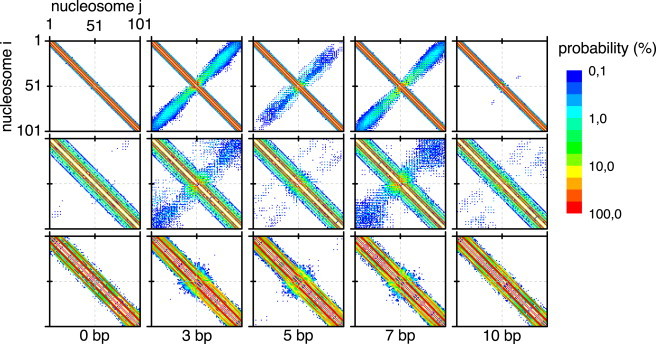
Nucleosomal contact maps of the CL, CLS, and ID fiber (top, center, and bottom row, respectively) for a subset of nucleosomal displacements (bottom). Each map shows the contact probabilities of distinct pairs of nucleosomes i and j. The repositioned nucleosome is located at index 51. The probability is expressed as a percentage. Note the logarithmic probability scale, with white meaning a probability <0.1. The region of the diagonal from top left to bottom right shows the interactions between each nucleosome and its direct neighbors, and the region around the antidiagonal shows interactions between nucleosomes that reside in distant sites of the fiber. To see this figure in color, go online.
The contact maps in Fig.4 reveal two different effects of repositioning on fiber conformation: First, the direct effect of the repositioned nucleosome on the contact behavior of its neighboring nucleosomes is reflected by changes in the region of the matrix diagonal. Second, the indirect effect on nucleosomes residing in distant sites of the fiber, whose contact probabilities changes as a result of the global fiber geometry deformations upon repositioning, is visible in the region of the antidiagonal.
The contact maps revealed strong changes of local nucleosomal contacts in the direct vicinity of the repositioned nucleosome for all three fiber types. At d = 0 bp, the regular stacking of the nucleosomes is clearly recognizable. This ordering was disturbed upon repositioning, as apparent from the contact probabilities changes. New stacking interactions appeared that resulted in a blurred contact probability area center, which was particularly pronounced for d = 3 and d = 7 bp in Fig. 4. Both the CL and the CLS fiber showed disturbances around the repositioned nucleosome, whereas the basic structural ordering was mostly preserved in the ID fiber. This local effect was confined to the closest 2–3 nucleosome stack layers adjacent to the repositioned nucleosome in all fiber types. The second observed effect also involves nucleosomes that are more distant from the repositioned nucleosome. For displacements around 3 and 7 bp, the contact probabilities increased substantially for the CL and CLS fibers in the antidiagonal regions that reflected long-range interactions between nucleosomes located in the two fiber halves (Fig. 4). The effect was largely reduced for the ID fiber. These observations can be rationalized by an increased kinking of the CL and CLS fibers that is also reflected by the relatively large mean bending angles (Fig. 2). Thus, the repositioned nucleosome can disrupt the local structural organization of the fiber and, via inducing a central kink and higher bendability, promote long-range interactions between nucleosomes.
Changes of the contact probabilities of fiber parts can be further illustrated by changes in the distribution of end-to-end-distances of the fiber. Fig. S8 shows this distribution for unmodified systems as well as for systems, in which the central nucleosome is repositioned by 3 bp. The probability of small end-to-end distances for CL and the CLS fibers increases considerably upon nucleosome repositioning. For example, the probability for a distance below 40 nm is increased by a factor of 38 for a CL fiber and by a factor of 7 for a CLS fiber, respectively.
These changes can be understood by analyzing the nucleosome-to-nucleosome distances as functions of chain length (Fig. S9). Although these functions do not change for the ID fibers with repositioning, for CL and ID fibers mean distances decrease reflecting the bending of the fiber causing the higher contact frequencies. For all three fibers the standard deviation of these distances increases with repositioning reflecting the higher flexibility.
Discussion
Chromatin fiber conformation changes upon single nucleosome repositioning
Internucleosomal interactions are maximized when nucleosomes can stack on each other (17). Given that the orientation of adjacent nucleosomes changes with the length of the linker DNA by 36° per bp, a full rotation of a nucleosome is performed for a 10 bp translocation, which yields the original orientation in terms of nucleosome stacking. A repositioning distance of 5 bp produces a rotation of 180°, which could also preserve stacking except that the linker DNA entry and exit are mirrored. Due to the resulting DNA bending and torsion, this renders such reorganization energetically less favorable. The energetically most unfavorable orientations occur at repositioning distances of 2–3 bp and 7–8 bp. At those distances, the translocated nucleosome is positioned perpendicularly to its neighbors and its internucleosomal interactions are mostly lost. In addition, this state is energetically unfavorable because the surrounding parts of the chain have to relocate to avoid clashes with neighboring nucleosomes and DNA.
We show that changes in nucleosome positions have a strong effect on the overall fiber shape and properties. In our simulations, even small differences in the position of a single nucleosome induced a kink into the chromatin fiber and increased flexibility at this position (Fig. 2). The magnitude of this effect depends on the fiber structure. As a consequence, the fiber is also more prone to self-association (Fig. 4). Some simulated fiber configurations therefore fold back completely (Fig. S7), assuming a hairpin-like shape similar to those encountered in (60). This behavior may facilitate contacts between separated genomic loci at a much shorter length scale than predicted by prevalent regular chromatin models. These findings are similar to those reported recently from the Olson group (63). Thus, the local activity of a chromatin remodeling complex that translocates a nucleosome within a regular nucleosome array could promote long-range interactions between distant nucleosomes.
Our simulations of nucleosome translocations were conducted in the context of a regular 101 nucleosome array. Interestingly, relatively large regions of up to 400 nucleosomes with regular spacing have been identified in the cell (27) that might represent regions, in which single nucleosome perturbations have pronounced effects on the folding of the chain. Furthermore, conformational changes of chromatin organization similar to those observed here for longer chains are expected to occur locally also for regions with a smaller number of regularly spaced nucleosomes. The resulting effects on long-range interactions, e.g., the induction of a kink due to a translocated nucleosome, will largely depend on the size of the flanking ordered region that typically is in the order of ∼10 nucleosomes, as for example at promoters and around CTCF binding sites (6,27,37).
Chromatin structure imposes additional constraints on remodeling complexes
How nucleosomes are repositioned by chromatin remodeling complexes in the context of a nucleosome chain is currently unclear because most mechanistic studies investigated the translocation of a single nucleosome in vitro (42–44,64–67). Our data show that the higher-order structure of chromatin may have an important influence on the process of nucleosome repositioning. In a highly condensed chromatin fiber, the nucleosome translocation process has to overcome not only the energy barrier imposed by the DNA-histone interface, but also the spatial constraints arising from internucleosomal interactions. All fibers in our simulations displayed such an energy barrier with conformation-dependent profiles (Fig. 3). Thus, the amount of ATP hydrolyzed (34,68) as well as the step size of the translocation reaction might be highly variable in the cell and depend on the structural environment in which the remodeling reaction occurs. Likewise, nucleosome sliding induced solely by thermal effects (62,66) is expected to be reduced by the presence of nucleosome-nucleosome interactions. The same considerations apply to the formation of subnucleosomal particles due to the dynamic exchange of H2A-H2B dimers (69). Spontaneous unwrapping that typically covers only a few basepairs (49,50,52) is also reduced in stacked nucleosome conformations (51) but the small changes in linker length and entry-exit angle alpha (Fig. S1) would not lead to large disturbance of the relative equilibrium orientation in the chain. In contrast, the unwrapping of a full DNA turn would rotate the histone octamer core by 180° and thus be accompanied by an additional energy barrier with respect to reorganizing nucleosome stacking interactions (52,66). Thus, the linkage between nucleosome positions and nucleosome stacking interactions affects access to DNA in a number of ways in addition to changing the linker DNA that is directly associated with the translocated histone octamer core.
The shape of the energetic barriers with respect to the repositioning distance seems to be governed by the individual fiber structure properties: i), A high nucleosome density in the fiber combined with the formation of multiple nucleosome stacks, as found in the ID fiber, results in a high resistance of the fiber to repositioning. ii), The energetic barrier does not depend primarily on the NRL. The CL and the CLS fiber showed a barrier comparable in shape and strength, even though they have very different NRLs (169 and 212 bp, respectively). iii), The higher-order structure energy barriers showed nonuniform behavior, with local maxima and minima. All investigated fibers had a maximum barrier slope within the first 2 bp of repositioning. After surpassing this slope, only small amounts of energy are necessary to maintain further repositioning. To experimentally prove the energetic predictions of the model, the energy for translocation of a single nucleosome could be measured by biophysical or biochemical approaches in specifically designed reconstituted systems.
Nucleosome stacking may contribute to the 10 bp nucleosomal phasing
A 10 bp rotational phasing preference of nucleosomes has been repeatedly reported in the literature (6,34,70–72). One proposed explanation for this preference is that some properties inherent to the sequence lead to a preferential mapping between histone core contact sites and nucleosomal DNA (73,74). Another model (74–76) uses a mechanism of statistical positioning, in which quasiperiodic arrangements of nucleosomes may arise solely from statistical correlations induced by their interaction. This model is extended by a recent study (77) suggesting that nucleosome stacking in condensed chromatin fibers is important in the statistical positioning of nucleosomes. The latter view is strongly supported by our results: the energetic landscapes of all investigated fibers show minima at a position difference of 10 bp (Fig. 3). As explained earlier, the repositioned nucleosome has then performed one complete turn and again takes a stacking-facilitating orientation with respect to the nucleosomes in its direct spatial neighborhood. This provides strong internucleosomal interactions and minimal steric collisions, making a 10 bp nucleosome position difference energetically favorable. These findings indicate a contribution of higher-order chromatin structure to nucleosomal phasing, at least in dense regularly ordered genomic loci, as for example are found at transcription start sites in yeast.
Multiple repositioned nucleosomes in one fiber
Although our results focus on a reference model for the effects of single-nucleosome repositioning in a regular chromatin context, in vivo chromatin in general has a more irregular nucleosome spacing. As discussed previously, this disturbs the stacking of the neighboring nucleosomes (Fig. 4). Introducing multiple isolated repositioned nucleosomes into the model of a regular fiber will result in multiple less flexible compartments connected by hinges formed by the repositioned nucleosomes. This would lead to a largely reduced chain persistence length as observed for chromatin in vivo (78) in the presence of a significant fraction of regions with regularly ordered nucleosomes (27). This view is supported by the findings in (79). where a computational model has been used to investigate the effects of nucleosome and linker histone depletion effects. The authors observed an increase in fiber flexibility at a higher depletion of nucleosomes. Furthermore, the fibers split into individual compartments at rising depletion rates.
At higher frequencies of nucleosome repositioning, the effects of single repositioned nucleosomes will inevitably begin to overlap and produce a complex effect on chain folding. In (39), intrafiber linker length variations between selected maxima and minima of ±1 bp up to ±3 bp were modeled. Although at linker length variations of ±1 bp, there were only moderate structural effects, ±2 bp resulted in a mixture of regular and irregular regions, comparable to the former compartmentalization effect, and at ±3 bp, the fiber appeared almost completely irregular, with only some short regular regions. Thus, the extent to which local nucleosome repositioning has long-range effects will depend on the degree of ordering and nucleosome stacking in the flanking regions. For regions with irregular spaced nucleosomes only the direct interacting nucleosomes might be affected. Nevertheless, also in this case long-range interactions might be induced by a subsequent change of nucleosome stacking interactions and/or the redistribution of chromosomal proteins that could bind to a stacked dinucleosome as proposed for heterochomatin protein 1 (HP1) (80).
Conclusions
In this work, we demonstrate that nucleosome positions and the 3D structure of chromatin are tightly linked. Relatively subtle changes in nucleosome positioning can have large effects on chromatin structure and fiber properties even for the less compacted fiber conformation. The translocated nucleosome induces bending of the fiber and increases its flexibility. As a result, contact probabilities between more distant parts of the fiber increase. We speculate that this might be an important mechanism for regulation of the chromatin structure in the nucleus. On the other hand, the 3D structure of chromatin stabilizes nucleosome positions and imposes a considerable barrier for the activities of remodelers as well as random fluctuation of the nucleosome positions. We recently developed algorithms for the analysis of experimental nucleosome occupancy maps (38) to derive the one-dimensional arrangement of nucleosomes, which can be used as input for the simulation framework presented here. Thus, it will be interesting to study changes of the 3D structure of chromatin that result from changes in the experimental nucleosome position maps, for example in response to an external stimulus or during cell differentiation.
Acknowledgments
We thank Ralf Seidel for helpful discussions regarding the electrostatic potential and Michael Grahl and Michael Mörl for developing a simulation pipeline based on XML. We thank Anna Sharman for critical reading of the manuscript.
This work was supported within project EpiGenSys by the German Federal Ministry of Education and Research (BMBF) as a partner of the ERASysBio+ initiative in the EU FP7 ERA-NET Plus program [grant number 0315712C to G.W. and 0315712A to K.R.]. Computational resources and data storage were funded by the German Research Foundation (DFG) [grant number INST 295/27-1 to G.W.]. Most computations were conducted within project mvb00007 of the North German Supercomputing Alliance (HLRN).
Supporting Material
Supporting Citations
References (81–87) appear in the Supporting Material.
References
- 1.Felsenfeld G., Groudine M. Controlling the double helix. Nature. 2003;421:448–453. doi: 10.1038/nature01411. [DOI] [PubMed] [Google Scholar]
- 2.Van Holde K.E. Springer; Heidelberg: 1989. Chromatin. [Google Scholar]
- 3.Davey C.A., Sargent D.F., Richmond T.J. Solvent mediated interactions in the structure of the nucleosome core particle at 1.9 a resolution. J. Mol. Biol. 2002;319:1097–1113. doi: 10.1016/S0022-2836(02)00386-8. [DOI] [PubMed] [Google Scholar]
- 4.Luger K., Mäder A.W., Richmond T.J. Crystal structure of the nucleosome core particle at 2.8 A resolution. Nature. 1997;389:251–260. doi: 10.1038/38444. [DOI] [PubMed] [Google Scholar]
- 5.Harshman S.W., Young N.L., Freitas M.A. H1 histones: current perspectives and challenges. Nucleic Acids Res. 2013;41:9593–9609. doi: 10.1093/nar/gkt700. [DOI] [PMC free article] [PubMed] [Google Scholar]
- 6.Valouev A., Ichikawa J., Johnson S.M. A high-resolution, nucleosome position map of C. elegans reveals a lack of universal sequence-dictated positioning. Genome Res. 2008;18:1051–1063. doi: 10.1101/gr.076463.108. [DOI] [PMC free article] [PubMed] [Google Scholar]
- 7.Horowitz-Scherer R.A., Woodcock C.L. Organization of interphase chromatin. Chromosoma. 2006;115:1–14. doi: 10.1007/s00412-005-0035-3. [DOI] [PubMed] [Google Scholar]
- 8.Robinson P.J.J., Fairall L., Rhodes D. EM measurements define the dimensions of the “30-nm” chromatin fiber: evidence for a compact, interdigitated structure. Proc. Natl. Acad. Sci. USA. 2006;103:6506–6511. doi: 10.1073/pnas.0601212103. [DOI] [PMC free article] [PubMed] [Google Scholar]
- 9.Schalch T., Duda S., Richmond T.J. X-ray structure of a tetranucleosome and its implications for the chromatin fibre. Nature. 2005;436:138–141. doi: 10.1038/nature03686. [DOI] [PubMed] [Google Scholar]
- 10.Woodcock C.L. Chromatin fibers observed in situ in frozen hydrated sections. Native fiber diameter is not correlated with nucleosome repeat length. J. Cell Biol. 1994;125:11–19. doi: 10.1083/jcb.125.1.11. [DOI] [PMC free article] [PubMed] [Google Scholar]
- 11.Grigoryev S.A. Keeping fingers crossed: heterochromatin spreading through interdigitation of nucleosome arrays. FEBS Lett. 2004;564:4–8. doi: 10.1016/S0014-5793(04)00258-3. [DOI] [PubMed] [Google Scholar]
- 12.Widom J., Klug A. Structure of the 300A chromatin filament: x-ray diffraction from oriented samples. Cell. 1985;43:207–213. doi: 10.1016/0092-8674(85)90025-x. [DOI] [PubMed] [Google Scholar]
- 13.Dorigo B., Schalch T., Richmond T.J. Nucleosome arrays reveal the two-start organization of the chromatin fiber. Science. 2004;306:1571–1573. doi: 10.1126/science.1103124. [DOI] [PubMed] [Google Scholar]
- 14.Bednar J., Horowitz R.A., Woodcock C.L. Nucleosomes, linker DNA, and linker histone form a unique structural motif that directs the higher-order folding and compaction of chromatin. Proc. Natl. Acad. Sci. USA. 1998;95:14173–14178. doi: 10.1073/pnas.95.24.14173. [DOI] [PMC free article] [PubMed] [Google Scholar]
- 15.Daban J.R., Bermúdez A. Interdigitated solenoid model for compact chromatin fibers. Biochemistry. 1998;37:4299–4304. doi: 10.1021/bi973117h. [DOI] [PubMed] [Google Scholar]
- 16.Horowitz R.A., Agard D.A., Woodcock C.L. The three-dimensional architecture of chromatin in situ: electron tomography reveals fibers composed of a continuously variable zig-zag nucleosomal ribbon. J. Cell Biol. 1994;125:1–10. doi: 10.1083/jcb.125.1.1. [DOI] [PMC free article] [PubMed] [Google Scholar]
- 17.Stehr R., Schöpflin R., Wedemann G. Exploring the conformational space of chromatin fibers and their stability by numerical dynamic phase diagrams. Biophys. J. 2010;98:1028–1037. doi: 10.1016/j.bpj.2009.11.040. [DOI] [PMC free article] [PubMed] [Google Scholar]
- 18.Song F., Chen P., Li G. Cryo-EM study of the chromatin fiber reveals a double helix twisted by tetranucleosomal units. Science. 2014;344:376–380. doi: 10.1126/science.1251413. [DOI] [PubMed] [Google Scholar]
- 19.Scheffer M.P., Eltsov M., Frangakis A.S. Nucleosomes stacked with aligned dyad axes are found in native compact chromatin in vitro. J. Struct. Biol. 2012;178:207–214. doi: 10.1016/j.jsb.2011.11.020. [DOI] [PubMed] [Google Scholar]
- 20.Scheffer M.P., Eltsov M., Frangakis A.S. Evidence for short-range helical order in the 30-nm chromatin fibers of erythrocyte nuclei. Proc. Natl. Acad. Sci. USA. 2011;108:16992–16997. doi: 10.1073/pnas.1108268108. [DOI] [PMC free article] [PubMed] [Google Scholar]
- 21.Maeshima K., Hihara S., Eltsov M. Chromatin structure: does the 30-nm fibre exist in vivo? Curr. Opin. Cell Biol. 2010;22:291–297. doi: 10.1016/j.ceb.2010.03.001. [DOI] [PubMed] [Google Scholar]
- 22.Eltsov M., Maclellan K.M., Dubochet J. Analysis of cryo-electron microscopy images does not support the existence of 30-nm chromatin fibers in mitotic chromosomes in situ. Proc. Natl. Acad. Sci. USA. 2008;105:19732–19737. doi: 10.1073/pnas.0810057105. [DOI] [PMC free article] [PubMed] [Google Scholar]
- 23.Dubochet J., Adrian M., Schultz P. Cryo-electron microscopy of vitrified specimens. Q. Rev. Biophys. 1988;21:129–228. doi: 10.1017/s0033583500004297. [DOI] [PubMed] [Google Scholar]
- 24.Nishino Y., Eltsov M., Maeshima K. Human mitotic chromosomes consist predominantly of irregularly folded nucleosome fibres without a 30-nm chromatin structure. EMBO J. 2012;31:1644–1653. doi: 10.1038/emboj.2012.35. [DOI] [PMC free article] [PubMed] [Google Scholar]
- 25.Fussner E., Ching R.W., Bazett-Jones D.P. Living without 30 nm chromatin fibers. Trends Biochem. Sci. 2011;36:1–6. doi: 10.1016/j.tibs.2010.09.002. [DOI] [PubMed] [Google Scholar]
- 26.Rippe K., Stehr R., Wedemann G. Monte Carlo simulations of nucleosome chains to identify factors that control DNA compaction and access. In: Schlick T., editor. Innovations in Biomolecular Modeling and Simulations. Royal Society of Chemistry; Cambridge: 2012. pp. 198–235. [Google Scholar]
- 27.Gaffney D.J., McVicker G., Pritchard J.K. Controls of nucleosome positioning in the human genome. PLoS Genet. 2012;8:e1003036. doi: 10.1371/journal.pgen.1003036. [DOI] [PMC free article] [PubMed] [Google Scholar]
- 28.Depken M., Schiessel H. Nucleosome shape dictates chromatin fiber structure. Biophys. J. 2009;96:777–784. doi: 10.1016/j.bpj.2008.09.055. [DOI] [PMC free article] [PubMed] [Google Scholar]
- 29.Tremethick D.J. Higher-order structures of chromatin: the elusive 30 nm fiber. Cell. 2007;128:651–654. doi: 10.1016/j.cell.2007.02.008. [DOI] [PubMed] [Google Scholar]
- 30.Collepardo-Guevara R., Schlick T. Insights into chromatin fibre structure by in vitro and in silico single-molecule stretching experiments. Biochem. Soc. Trans. 2013;41:494–500. doi: 10.1042/BST20120349. [DOI] [PMC free article] [PubMed] [Google Scholar]
- 31.Korolev N., Fan Y., Nordenskiöld L. Modelling chromatin structure and dynamics: status and prospects. Curr. Opin. Struct. Biol. 2012;22:151–159. doi: 10.1016/j.sbi.2012.01.006. [DOI] [PubMed] [Google Scholar]
- 32.Schlick T., Hayes J., Grigoryev S. Toward convergence of experimental studies and theoretical modeling of the chromatin fiber. J. Biol. Chem. 2012;287:5183–5191. doi: 10.1074/jbc.R111.305763. [DOI] [PMC free article] [PubMed] [Google Scholar]
- 33.Yuan G.-C., Liu Y.-J., Rando O.J. Genome-scale identification of nucleosome positions in S. cerevisiae. Science. 2005;309:626–630. doi: 10.1126/science.1112178. [DOI] [PubMed] [Google Scholar]
- 34.Zhang Y., Moqtaderi Z., Struhl K. Intrinsic histone-DNA interactions are not the major determinant of nucleosome positions in vivo. Nat. Struct. Mol. Biol. 2009;16:847–852. doi: 10.1038/nsmb.1636. [DOI] [PMC free article] [PubMed] [Google Scholar]
- 35.Schones D.E., Cui K., Zhao K. Dynamic regulation of nucleosome positioning in the human genome. Cell. 2008;132:887–898. doi: 10.1016/j.cell.2008.02.022. [DOI] [PMC free article] [PubMed] [Google Scholar]
- 36.Teif V.B., Vainshtein Y., Rippe K. Genome-wide nucleosome positioning during embryonic stem cell development. Nat. Struct. Mol. Biol. 2012;19:1185–1192. doi: 10.1038/nsmb.2419. [DOI] [PubMed] [Google Scholar]
- 37.Zhang Z., Wippo C.J., Pugh B.F. A packing mechanism for nucleosome organization reconstituted across a eukaryotic genome. Science. 2011;332:977–980. doi: 10.1126/science.1200508. [DOI] [PMC free article] [PubMed] [Google Scholar]
- 38.Schöpflin R., Teif V.B., Wedemann G. Modeling nucleosome position distributions from experimental nucleosome positioning maps. Bioinformatics. 2013;29:2380–2386. doi: 10.1093/bioinformatics/btt404. [DOI] [PubMed] [Google Scholar]
- 39.Woodcock C.L., Grigoryev S.A., Whitaker N. A chromatin folding model that incorporates linker variability generates fibers resembling the native structures. Proc. Natl. Acad. Sci. USA. 1993;90:9021–9025. doi: 10.1073/pnas.90.19.9021. [DOI] [PMC free article] [PubMed] [Google Scholar]
- 40.Wedemann G., Langowski J. Computer simulation of the 30-nanometer chromatin fiber. Biophys. J. 2002;82:2847–2859. doi: 10.1016/S0006-3495(02)75627-0. [DOI] [PMC free article] [PubMed] [Google Scholar]
- 41.Clapier C.R., Cairns B.R. The biology of chromatin remodeling complexes. Annu. Rev. Biochem. 2009;78:273–304. doi: 10.1146/annurev.biochem.77.062706.153223. [DOI] [PubMed] [Google Scholar]
- 42.Hargreaves D.C., Crabtree G.R. ATP-dependent chromatin remodeling: genetics, genomics and mechanisms. Cell Res. 2011;21:396–420. doi: 10.1038/cr.2011.32. [DOI] [PMC free article] [PubMed] [Google Scholar]
- 43.Erdel F., Rippe K. Chromatin remodelling in mammalian cells by ISWI-type complexes—where, when and why? FEBS J. 2011;278:3608–3618. doi: 10.1111/j.1742-4658.2011.08282.x. [DOI] [PubMed] [Google Scholar]
- 44.Flaus A., Owen-Hughes T. Mechanisms for ATP-dependent chromatin remodelling: the means to the end. FEBS J. 2011;278:3579–3595. doi: 10.1111/j.1742-4658.2011.08281.x. [DOI] [PMC free article] [PubMed] [Google Scholar]
- 45.Deindl S., Hwang W.L., Zhuang X. ISWI remodelers slide nucleosomes with coordinated multi-base-pair entry steps and single-base-pair exit steps. Cell. 2013;152:442–452. doi: 10.1016/j.cell.2012.12.040. [DOI] [PMC free article] [PubMed] [Google Scholar]
- 46.Stehr R., Kepper N., Wedemann G. The effect of internucleosomal interaction on folding of the chromatin fiber. Biophys. J. 2008;95:3677–3691. doi: 10.1529/biophysj.107.120543. [DOI] [PMC free article] [PubMed] [Google Scholar]
- 47.Katzgraber H., Trebst S., Troyer M. Feedback-optimized parallel tempering Monte Carlo. J. Stat. Mech. 2006;2006:03018. [Google Scholar]
- 48.Kepper N., Foethke D., Rippe K. Nucleosome geometry and internucleosomal interactions control the chromatin fiber conformation. Biophys. J. 2008;95:3692–3705. doi: 10.1529/biophysj.107.121079. [DOI] [PMC free article] [PubMed] [Google Scholar]
- 49.Li G., Levitus M., Widom J. Rapid spontaneous accessibility of nucleosomal DNA. Nat. Struct. Mol. Biol. 2005;12:46–53. doi: 10.1038/nsmb869. [DOI] [PubMed] [Google Scholar]
- 50.Kruithof M., van Noort J. Hidden Markov analysis of nucleosome unwrapping under force. Biophys. J. 2009;96:3708–3715. doi: 10.1016/j.bpj.2009.01.048. [DOI] [PMC free article] [PubMed] [Google Scholar]
- 51.Kepper N., Ettig R., Rippe K. Force spectroscopy of chromatin fibers: extracting energetics and structural information from Monte Carlo simulations. Biopolymers. 2011;95:435–447. doi: 10.1002/bip.21598. [DOI] [PubMed] [Google Scholar]
- 52.Ettig R., Kepper N., Rippe K. Dissecting DNA-histone interactions in the nucleosome by molecular dynamics simulations of DNA unwrapping. Biophys. J. 2011;101:1999–2008. doi: 10.1016/j.bpj.2011.07.057. [DOI] [PMC free article] [PubMed] [Google Scholar]
- 53.Zewdie H. Computer simulation studies of liquid crystals: a new Corner potential for cylindrically symmetric particles. J. Chem. Phys. 1998;108:2117–2133. [Google Scholar]
- 54.Metropolis N., Rosenbluth A.W., Teller E. Equation of state calculations by fast computing machines. J. Chem. Phys. 1953;21:1087–1092. [Google Scholar]
- 55.Swendsen R.H., Wang J.-S. Replica Monte Carlo simulation of spin glasses. Phys. Rev. Lett. 1986;57:2607–2609. doi: 10.1103/PhysRevLett.57.2607. [DOI] [PubMed] [Google Scholar]
- 56.Kabsch W. A solution for the best rotation to relate two sets of vectors. Acta Crystallogr. A. 1976;32:922–923. [Google Scholar]
- 57.Kabsch W. A discussion of the solution for the best rotation to relate two sets of vectors. Acta Crystallogr. A. 1978;34:827–828. [Google Scholar]
- 58.Reinsch C.H. Smoothing by spline functions. Numer. Math. 1967;10:177–183. [Google Scholar]
- 59.De Boor C. Springer; New York: 2001. A Practical Guide to Splines. [Google Scholar]
- 60.Mergell B., Everaers R., Schiessel H. Nucleosome interactions in chromatin: fiber stiffening and hairpin formation. Phys. Rev. E Stat. Nonlin. Soft Matter Phys. 2004;70:011915. doi: 10.1103/PhysRevE.70.011915. [DOI] [PubMed] [Google Scholar]
- 61.Ranjith P., Yan J., Marko J.F. Nucleosome hopping and sliding kinetics determined from dynamics of single chromatin fibers in Xenopus egg extracts. Proc. Natl. Acad. Sci. USA. 2007;104:13649–13654. doi: 10.1073/pnas.0701459104. [DOI] [PMC free article] [PubMed] [Google Scholar]
- 62.Schiessel H., Widom J., Gelbart W.M. Polymer reptation and nucleosome repositioning. Phys. Rev. Lett. 2001;86:4414–4417. doi: 10.1103/PhysRevLett.86.4414. [DOI] [PubMed] [Google Scholar]
- 63.Kulaeva O.I., Zheng G., Olson W.K. Internucleosomal interactions mediated by histone tails allow distant communication in chromatin. J. Biol. Chem. 2012;287:20248–20257. doi: 10.1074/jbc.M111.333104. [DOI] [PMC free article] [PubMed] [Google Scholar]
- 64.Sirinakis G., Clapier C.R., Zhang Y. The RSC chromatin remodelling ATPase translocates DNA with high force and small step size. EMBO J. 2011;30:2364–2372. doi: 10.1038/emboj.2011.141. [DOI] [PMC free article] [PubMed] [Google Scholar]
- 65.Blosser T.R., Yang J.G., Zhuang X. Dynamics of nucleosome remodelling by individual ACF complexes. Nature. 2009;462:1022–1027. doi: 10.1038/nature08627. [DOI] [PMC free article] [PubMed] [Google Scholar]
- 66.Blossey R., Schiessel H. The dynamics of the nucleosome: thermal effects, external forces and ATP. FEBS J. 2011;278:3619–3632. doi: 10.1111/j.1742-4658.2011.08283.x. [DOI] [PubMed] [Google Scholar]
- 67.Bowman G.D. Mechanisms of ATP-dependent nucleosome sliding. Curr. Opin. Struct. Biol. 2010;20:73–81. doi: 10.1016/j.sbi.2009.12.002. [DOI] [PMC free article] [PubMed] [Google Scholar]
- 68.Parmar J.J., Marko J.F., Padinhateeri R. Nucleosome positioning and kinetics near transcription-start-site barriers are controlled by interplay between active remodeling and DNA sequence. Nucleic Acids Res. 2014;42:128–136. doi: 10.1093/nar/gkt854. [DOI] [PMC free article] [PubMed] [Google Scholar]
- 69.Kepert J.F., Mazurkiewicz J., Rippe K. NAP1 modulates binding of linker histone H1 to chromatin and induces an extended chromatin fiber conformation. J. Biol. Chem. 2005;280:34063–34072. doi: 10.1074/jbc.M507322200. [DOI] [PubMed] [Google Scholar]
- 70.Jiang C., Pugh B.F. Nucleosome positioning and gene regulation: advances through genomics. Nat. Rev. Genet. 2009;10:161–172. doi: 10.1038/nrg2522. [DOI] [PMC free article] [PubMed] [Google Scholar]
- 71.Valouev A., Johnson S.M., Sidow A. Determinants of nucleosome organization in primary human cells. Nature. 2011;474:516–520. doi: 10.1038/nature10002. [DOI] [PMC free article] [PubMed] [Google Scholar]
- 72.Brogaard K., Xi L., Widom J. A map of nucleosome positions in yeast at base-pair resolution. Nature. 2012;486:496–501. doi: 10.1038/nature11142. [DOI] [PMC free article] [PubMed] [Google Scholar]
- 73.Albert I., Mavrich T.N., Pugh B.F. Translational and rotational settings of H2A.Z nucleosomes across the Saccharomyces cerevisiae genome. Nature. 2007;446:572–576. doi: 10.1038/nature05632. [DOI] [PubMed] [Google Scholar]
- 74.Mavrich T.N., Ioshikhes I.P., Pugh B.F. A barrier nucleosome model for statistical positioning of nucleosomes throughout the yeast genome. Genome Res. 2008;18:1073–1083. doi: 10.1101/gr.078261.108. [DOI] [PMC free article] [PubMed] [Google Scholar]
- 75.Kornberg R.D., Stryer L. Statistical distributions of nucleosomes: nonrandom locations by a stochastic mechanism. Nucleic Acids Res. 1988;16:6677–6690. doi: 10.1093/nar/16.14.6677. [DOI] [PMC free article] [PubMed] [Google Scholar]
- 76.Möbius W., Gerland U. Quantitative test of the barrier nucleosome model for statistical positioning of nucleosomes up- and downstream of transcription start sites. PLOS Comput. Biol. 2010;6:e1000891. doi: 10.1371/journal.pcbi.1000891. [DOI] [PMC free article] [PubMed] [Google Scholar]
- 77.Riposo J., Mozziconacci J. Nucleosome positioning and nucleosome stacking: two faces of the same coin. Mol. Biosyst. 2012;8:1172–1178. doi: 10.1039/c2mb05407h. [DOI] [PubMed] [Google Scholar]
- 78.Hajjoul H., Mathon J., Bancaud A. High-throughput chromatin motion tracking in living yeast reveals the flexibility of the fiber throughout the genome. Genome Res. 2013;23:1829–1838. doi: 10.1101/gr.157008.113. [DOI] [PMC free article] [PubMed] [Google Scholar]
- 79.Diesinger P.M., Kunkel S., Heermann D.W. Histone depletion facilitates chromatin loops on the kilobasepair scale. Biophys. J. 2010;99:2995–3001. doi: 10.1016/j.bpj.2010.08.039. [DOI] [PMC free article] [PubMed] [Google Scholar]
- 80.Teif V.B., Kepper N., Rippe K. Affinity, stoichiometry and cooperativity of heterochromatin protein 1 (HP1) binding to nucleosomal arrays. J. Phys. Condens. Matter Inst. Phys. J. 2014 doi: 10.1088/0953-8984/27/6/064110. In press. [DOI] [PubMed] [Google Scholar]
- 81.Hess B., Kutzner C., Lindahl E. GROMACS 4: algorithms for highly efficient, load-balanced, and scalable molecular simulation. J. Chem. Theory Comput. 2008;4:435–447. doi: 10.1021/ct700301q. [DOI] [PubMed] [Google Scholar]
- 82.Levin Y. Electrostatic correlations: from plasma to biology. Rep. Prog. Phys. 2002;65:1577. [Google Scholar]
- 83.Walker D.A., Kowalczyk B., Grzybowski B.A. Electrostatics at the nanoscale. Nanoscale. 2011;3:1316–1344. doi: 10.1039/c0nr00698j. [DOI] [PubMed] [Google Scholar]
- 84.Maffeo C., Schöpflin R., Seidel R. DNA-DNA interactions in tight supercoils are described by a small effective charge density. Phys. Rev. Lett. 2010;105:158101. doi: 10.1103/PhysRevLett.105.158101. [DOI] [PMC free article] [PubMed] [Google Scholar]
- 85.Sader J.E., Carnie S.L., Chan D.Y.C. Accurate analytic formulas for the double-layer interaction between spheres. J. Colloid Interface Sci. 1995;171:46–54. [Google Scholar]
- 86.Nguyen A.V., Tran L.T.T., Miller J.D. Particle–particle interaction. In: Lee S., Henthorn K.H.H., editors. Particle Technology and Applications. CRC Press; Boca Raton, FL: 2012. pp. 31–50. [Google Scholar]
- 87.Klenin K., Merlitz H., Langowski J. A Brownian dynamics program for the simulation of linear and circular DNA and other wormlike chain polyelectrolytes. Biophys. J. 1998;74:780–788. doi: 10.1016/S0006-3495(98)74003-2. [DOI] [PMC free article] [PubMed] [Google Scholar]
Associated Data
This section collects any data citations, data availability statements, or supplementary materials included in this article.