

Abstract
We investigated the physical properties of bacterial cytoplasmic membranes by applying the method of micropipette aspiration to Escherichia coli spheroplasts. We found that the properties of spheroplast membranes are significantly different from that of laboratory-prepared lipid vesicles or that of previously investigated animal cells. The spheroplasts can adjust their internal osmolality by increasing their volumes more than three times upon osmotic downshift. Until the spheroplasts are swollen to their volume limit, their membranes are tensionless. At constant external osmolality, aspiration increases the surface area of the membrane and creates tension. What distinguishes spheroplast membranes from lipid bilayers is that the area change of a spheroplast membrane by tension is a relaxation process. No such time dependence is observed in lipid bilayers. The equilibrium tension-area relation is reversible. The apparent area stretching moduli are several times smaller than that of stretching a lipid bilayer. We conclude that spheroplasts maintain a minimum surface area without tension by a membrane reservoir that removes the excessive membranes from the minimum surface area. Volume expansion eventually exhausts the membrane reservoir; then the membrane behaves like a lipid bilayer with a comparable stretching modulus. Interestingly, the membranes cease to refold when spheroplasts lost viability, implying that the membrane reservoir is metabolically maintained.
Introduction
Direct probing of the physical properties of cell membranes has been performed on various animal cells with the methods of micropipette aspiration (1–5) and tether pulling (6–10). These physical studies have provided invaluable insight into the mechanical properties of eukaryotic cell membranes and thus a better understanding of the membrane’s functions in cell biology (1,8,9,11). In comparison, the cytoplasmic membranes of bacteria are much less accessible to experimental study because they are normally shielded by outer membranes. Experimentalists have made use of spheroplasts, the cells from which the outer membranes have been removed, for patch-clamp, fusion, and other experiments (12–14) and also for antibiotic studies (15). However the physical properties of spheroplast membranes have not been studied. In this study we apply the method of micropipette aspiration to probe the stretching elasticity of Escherichia coli (E. coli) spheroplast membranes. The measurements reveal the basic properties of bacterial cytoplasmic membranes, which are significantly different from that of red cell membranes, or of laboratory-prepared lipid vesicles. It is generally believed that the tension in the cytoplasmic membrane determines the actions of mechanosensitive channels and osmoregulators (16–18), and perhaps other integral proteins as well (19,20). The cytoplasmic membranes are also the target of naturally produced membrane-acting antibiotics, as has been demonstrated recently with LL37 (21,22), cecropin (23), and daptomycin (24). To understand the in situ activities of membrane-acting antibiotics, we need to know the physical properties of the target membranes (25).
As inhabitants of natural environments, bacteria have abilities to survive very large changes of external osmolality (17). In E. coli, the cytoplasm responses to the changes of external osmolality by adjusting its solute content and the amount of water (17,26–30). As a result, the cytoplasmic osmotic pressure could exceed that of the surrounding medium by 0.5 to 3 atm, as the external osmolality decreases from 0.5 to 0.03 osmole/kg (Osm) (30). The cytoplasmic membrane cannot sustain such a large pressure drop. Cayley et al. (30) have showed that the periplasmic solutes and volume also changed with external osmolality, and concluded that the periplasm and cytoplasm are iso-osmotic (31,32). Hence the turgor pressure is supported by the peptidoglycan-cell wall complex, rather than by the cytoplasmic membrane (21,30). However, the physical properties of cytoplasmic membranes are otherwise unknown.
Accordingly, we investigated E. coli speheroplasts over a range of external osmolality. We found that, except at very low external osmolalities, the spheroplast membranes are tensionless. However, increasing the area of a spheroplast membrane by micropipette aspiration creates tension. As the tension changes by aspiration, the area of the spheroplast membrane changes to a new equilibrium value by a relaxation process. And the relaxation is loading-rate dependent. The equilibrium tension-area relation is reversible. These results indicate that the cell maintains a minimum surface area without a tension, and the surface area is controlled by a membrane reservoir equivalent to membrane folds. At constant external osmolality, unfolding and refolding of the membranes are reversible, thus providing an apparent elasticity of stretching. However, when the cell lost its viability, the area increase loses its reversibility, implying that the reversible membrane reservoir is metabolically maintained. Our results can be understood by assuming that the membrane reservoirs are mediated by reversible noncovalent chemical bonds.
Materials and Methods
Bacterial strains and culture
E. coli K-12 strain MG1655 (ATCC 700926) was purchased from ATCC (Manassas, VA). Luria-Bertani (LB) medium (5 g/L yeast extract, 10 g/L peptone from casein, and 10 g/L sodium chloride) containing 15g/L agar from EMD Millipore (Billerica, MA) was used for the growth of colonies of E. coli. The medium was autoclaved before used for sterility.
Chemicals and media
Sucrose, Tris, hydrochloric acid, lysozyme, DNase, EDTA, magnesium chloride, sodium hydroxide, cephalexin, carboxyfluorescein, and carbonyl cyanide m-chlorophenylhydrazone (CCCP) were purchased from Sigma Aldrich (St. Louis, MO). FM 4-64 and Sytox green were purchased from Life Technologies (Grand Island, NY). E. coli total lipid extract was purchased from Avanti Polar Lipids (Alabaster, AL).
Preparation of E. coli spheroplasts
We prepared giant spheroplasts of E. coli by following the detailed procedure described by Renner et al. (14). Briefly, cells were grown in LB medium by shaking at 37°C overnight to the stationary phase. A small aliquot (1:100 dilution) was added into the LB medium and incubated in 37°C while shaking at 200 rpm until the absorbance at λ = 600 nm reached 0.5 to 0.7. One-half ml of the cell culture was diluted to 5 ml in LB medium. To grow long filamentous cells, cephalexin (60 μg/ml) was added and the culture was grown with shaking (200 rpm) at 42°C for 2 h. After cells reached an average length of ∼ 50 μm, cells were harvested by centrifugation at 3000 × g for 1 min. The pellet was suspended in 500 μL of 800 mM sucrose solution. Spheroplasts from filamentous cells were formed by adding the reagents in the following order: 30 μL 1 M Tris × HCl (pH 8.0), 24 μL 0.5 mg/mL lysozyme, 6 μL 5 mg/mL DNase, and 6 μL 125 mM EDTA-NaOH (pH 8.0). After 5 to 20 min at room temperature, 100 μL of STOP solution (10 mM Tris × HCl at pH 8, 0.7 M sucrose, 20 mM MgCl2) was added to stabilize the spheroplasts. We did not find noticeable differences in the results by different time duration of lysozyme treatments. Spheroplasts were stored in liquid nitrogen for no longer than 2 weeks.
Frozen spheroplasts were thawed slowly on ice before each use. Thirty μL of spheroplasts was injected into an observation chamber containing a certain concentration of STOP solution. The spheroplasts were either directly imaged with phase contrast microscopy or labeled with FM 4-64 (8 μM) for fluorescence imaging. We were able to measure the membrane area changes with either phase contrast or fluorescence images, although it was easier with the latter. We did not notice any difference in the membrane properties of spheroplasts whether they were labeled with FM 4-64 or not. The majority of aspiration measurements were performed with FM 4-64 label.
Method of micropipette aspiration
This method was a modification of the original method of Kwok and Evans (33) as described in Sun et al. (34,35). A micropipette was connected to a water-filled U tube manometer and a negative pressure in the pipette was produced by adjusting the height of the water level reference to the atmosphere pressure (34). Although the technique for measuring spheroplasts and giant unilamellar vesicles (GUVs) is the same, the small size of spheroplasts imposes some restrictions on spheroplast measurements. For GUV experiments, the typical dimensions are 5 μm for the micropipette radius and 15 μm for the GUV radius . The applied membrane tension is in the range of 1 to 7 mN/m, which requires a suction pressure of Pa, equivalent to cm of water [calculated from the Laplace equation ] (see Fig. S1 A). For a spheroplast of radius 2.5 μm, using a micropipette of radius 1.1 μm, the same tension would require three times as much water pressure. Thus the maximum applicable membrane tension is limited to ∼ 2 mN/m by the 20 cm height of the water column.
If an aspirated spheroplast consisted of a spherical part and a cylindrical part (a protrusion into the micropipette) (similar to the GUV shown in Fig. S1 A), the length of the protrusion, the radius of the micropipette, and the radius of the spherical part were carefully measured. Then it was straightforward to show and (33). As long as the osmolality balance was maintained, there should be no change of volume (the effect of the pressure change by suction was so small that its contribution to the chemical potential change was ∼ 10−3 that of osmolality). Under the condition ΔV = 0, ΔA was directly proportional to ΔLp: . The fractional area change was calculated from the change of the protrusion length . If aspiration created a spherical protrusion (Fig. S1 B) (35), the volume was , and the area (Fig. S1 C); the area change was calculated at constant volume and the tension was calculated by the Laplace equation .
The experiment of the GUVs of E. coli total lipid extract followed the previously established method (34).
Results
Giant spheroplasts of E. coli
The methods for growing E. coli spheroplasts are well established (14,36). First, cephalexin was added to the cell culture. In the presence of cephalexin that blocks septation, E. coli grew into long filaments (Fig. 1 A). We have experimented with the growth time and temperature (37,38) to achieve longer filaments (≳ 50 μm). To remove the outer membrane and the peptidoglycan, we added lysozyme and EDTA to the cell suspension, that converted filaments into spheroplasts (Fig. 1 A). Then a STOP solution (14) was added to terminate the digestion. The osmolality of the STOP solution was 0.845 Osm. It has been shown previously that the ratio of DNA/protein in filaments was about the same as in untreated cells (13). Thus ∼ 30 bacterial genomes were present in a long filament and also in a resulting giant spheroplast. We confirmed that the spheroplasts could revert to normal form of E. coli when returned to growth medium (13) (data not shown). We did not know if there were remnants of outer membrane or peptidoglycan attached to the cytoplasmic membranes of spheroplasts (39). If there were, we did not detect the effect of their presence.
Figure 1.
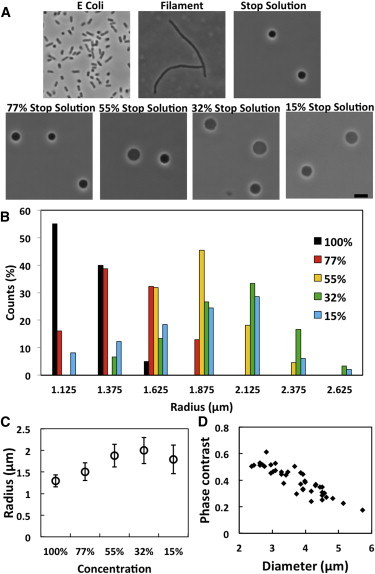
E. coli spheroplasts. (A) E. coli cells, filamentous cells, spheroplasts in 100% STOP solution, and in diluted STOP solutions. Scale bar = 5 μm. (B) Size distribution among a population in different concentrations of STOP solution. As the external concentration decreased below ∼ 50%, more spheroplasts appeared to have lost the interior phase contrast. The spheroplasts without interior phase contrast were not included in the radius survey. (C) The average radius of the population in different concentrations. (D) Correlations of size versus phase contrast where I was the average phase contrast intensity of cytosol, that of the outside solution. Spheroplasts without phase contrast had . To see this figure in color, go online.
To experiment with the cytoplasmic membranes, we diluted the STOP solution by adding pure water. As the STOP solution was diluted, the water influx enlarged the spheroplasts, indicating that there was a membrane reservoir in the original state of spheroplast. The degree of swelling was correlated to the reduction of the interior phase contrast of the spheroplast against the external medium. It is important to note that the swelling and the phase contrast changes were reversible (Fig. S2). The size distribution of the spheroplasts is plotted for different external osmolalities in Fig. 1 B and the average size in Fig. 1 C. The correlation between the size and the interior phase contrast is shown in Fig. 1 D. In general swelling increased with decreasing external osmolality and swelling reduced phase contrast. However, in a given external osmolality, there was a range of degrees of swelling among the spheroplast population.
Micropipette aspiration of spheroplast membranes
The method of aspiration serves two purposes: one is to apply tension to the membrane and another is to measure the membrane area changes. Previous studies have shown that the membrane area changes by tension (40), by peptide binding (41), or by structural events (such as pore formation) (42) can provide a quantitative description for the physical event taking place in the membrane. In this study we used a micropipette to apply a small negative pressure (aspiration) to a spheroplast. When a spheroplast in the 100% STOP solution was aspirated by a micropipette, the whole cell deformed and flowed into the pipette (Fig. S3). This could be because of the size of the micropipette being too close to the size of the spheroplast, or it could be what was described as a liquid drop model in the micropipette-aspiration experiments of human blood cells (4,5,11). We did not analyze the spheroplasts from 100% STOP solution.
When the osmolality of the external medium was reduced, the cell volume visibly enlarged because of water influx. The response of the enlarged spheroplasts to micropipette aspiration was similar to the response of a GUV of lipids. In this case, aspiration reshaped the spheroplast surface to include a protrusion in the micropipette, leaving a larger spherical part outside the pipette (Fig. S1 A or B). The equal osmolality inside and outside should keep the volume of the spheroplast constant. Then any surface area change would result in a change in the length of the protrusion, from which we measured the fractional area change (see Materials and Methods (34,35)). We systematically investigated the spheroplast membranes by the micropipette-aspiration method and found the following general properties for E. coli spheroplast membranes.
Membrane area expansion is a relaxation process
We found that the initial surface tension of a spheroplast was always zero, except for very swollen spheroplasts that will be discussed later. When a tension was applied to the spheroplast surface, its surface area increased in a manner describable as a relaxation process (Fig. 2). Depending on the amount of area change, it could take as long as ∼ 100s for the surface area to reach equilibrium. If the tension was then reduced to the initial near zero value, the apparent surface area recovered the original value also in a relaxation manner. This is very different from stretching a lipid bilayer (33,40), where the area change follows the tension with a speed of sound in the material (43).
Figure 2.
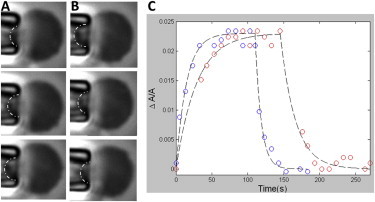
Time dependent area change of spheroplast membrane under a change of tension. (A) At time 0, the tension was increased from 0.25 to 0.83 mN/m. The images from top to bottom were at t = 0, 5, and 70 s. Scale bar = 2.5 μm. (B) After the membrane area reached equilibrium, the tension was decreased to 0.25 mN/m. The images from top to bottom were at t = 0, 5, and 70 s. The dash-dot lines indicate the geometric features used to calculate the area changes. (C) Two area versus time curves were performed at different rates of applying tension: red, the tension (from 0.25 to 0.83 mN/m) was applied by lowing the water column at 2 mm/s; blue, at 10 mm/s (see Materials and Methods). The curve fitting used the formula described in Discussion; the time constants for the blue curve are 14.6 and 8.4 s for area increase and decrease, respectively. 28.8 and 20.9 s for the red curve, respectively. To see this figure in color, go online.
The relaxation process gave rise to a loading-rate dependence (44,45), which is well known in single-protein pulling experiments (46,47). When the tension was loaded in different rates, the surface area expansion followed different relaxation paths (Fig. 2).
Surface area expansion by tension is reversible
Every spheroplast in a constant external osmolality gave a well-defined equilibrium tension τ versus curve. The curve is approximately linear for a small range of τ. (The range of τ was limited by the height of the manometer water column used to generate the aspiration pressure—see Materials and Methods). Importantly we found that the stress-strain relation is reversible and repeatable (Figs. 3 and S4) within errors. From the linear relation, we define the apparent stretching modulus . We measured of the spheroplasts taken from a population equilibrated in external osmolality 0.237 Osm (Fig. 3 B). The largest values of from the population are ∼ 100 mN/m. In comparison, the typical values of for lipid bilayers are ∼ 200 mN/m (40). Only very swollen spheroplasts exhibit values in the same range (see below).
Figure 3.
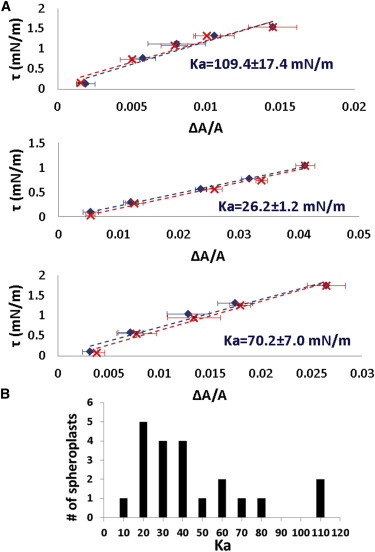
(A) Three examples of reversible tension τ versus fractional area change of spheroplast membranes. In each example blue data are for increasing tension and red for decreasing tension. The data points are equilibrium values. The error bars represent the uncertainties in calculating the area from the microscope images. The uncertainties in tension calculation are smaller than the data symbols. , the apparent stretching modulus, was measured from the slope of each curve. (B) of a spheroplast population in 28% STOP solution. To see this figure in color, go online.
Temperature dependence
Bacterial membranes may have a gel-fluid phase transition below the growth temperature (48). Thus it is important to test the possible temperature dependence of their elastic properties. A number of randomly chosen spheroplasts were measured by τ versus , first in room temperature 25°C then at 37°C, the growth temperature (Fig. 4). In all cases, we detected no significant temperature dependence. Thus we performed the rest of experiments in room temperature.
Figure 4.

Tension τ versus measurement at 25°C and at 37°C. (A) A spheroplast was first measured at 25°C. The image from left to right at tension τ = 0.34, 1.21, and 2.14 mN/m. (B) The same measurement was repeated at 37°C. Scale bar = 2.5 μm. (C) Data from three spheroplasts: solid line (blue diamonds) at 25°C; dotted line (red crosses) at 37°C. No significant temperature dependence was detected. To see this figure in color, go online.
Stretching modulus changes with osmolality
Measurements of the same spheroplast in different osmolalities were difficult because of the small size of the spheroplasts. The requirement of a 100× microscope objective and its short working distance made it very difficult to transfer an aspirated spheroplast from one chamber to another, as we did with GUVs (34). Also, an aspirated spheroplast was easily detached from the micropipette by a flow in the chamber, making it difficult to change the solution in the sample chamber. We could only change the solution osmolality qualitatively. This was done by introducing an open tube containing a 100% STOP solution that included 1 μM carboxyfluorescein (CF) into the chamber. We let the diffusion from the tube slowly increased the osmolality inside the chamber until the fluorescence intensity of CF in the chamber appeared to be uniform. We measured of a spheroplast before and after the introduction of the open tube. We found that invariably decreased if the external osmolality was increased (Fig. 5).
Figure 5.
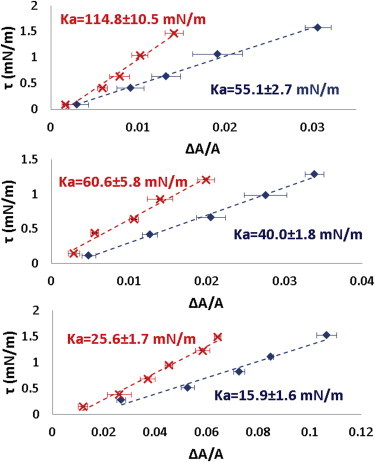
decreased if the external osmolality was increased. was first measured in a 28% STOP solution (red points). Then an open tube containing a 100% STOP solution and carboxyfluorescein (CF) was introduced into the chamber. The diffusion from the tube slowly increased the osmolality inside the chamber until the intensity of CF in the chamber became uniform. Then was measured again (blue points). The value of always decreased. Three measurements are shown. To see this figure in color, go online.
Very swollen spheroplast
In all of the previous examples (Figs. 2 to 5), we detected no initial membrane tension in the aspirated spheroplasts. In contrast, very swollen spheroplasts (as judged by small interior phase contrast) were under a surface tension. For such spheroplasts, a larger suction pressure was required for aspiration and the initial tension was ≳ 1 mN/m (Fig. 6). The values of for very swollen spheroplasts are ∼ 200 mN/m, close to the values of measured from GUVs of E. coli total lipid extract (Fig. 6).
Figure 6.
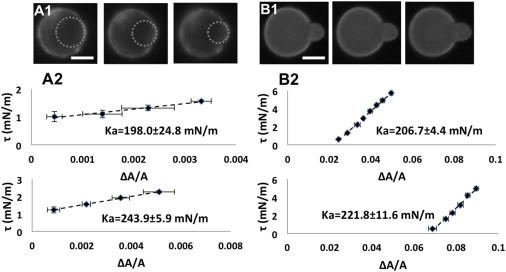
Very swollen E. coli spheroplasts were compared with GUVs of total E. coli lipid extract. (A1) A very swollen spheroplast aspirated by a micropipette in a series of increasing tension: left to right, τ = 1.00, 1.11, and 1.56 mN/m. Scale bar = 2.5 μm. The dotted circles are the fits to the protrusions into the micropipette that are used to calculate the area changes (see Fig. S1). (A2) Two τ versus ΔA/A measurements of very swollen spheroplasts. (B1) Aspiration measurement of a GUV of E. coli total lipid extract at, left to right, τ = 0.3, 1.02, and 1.92 mN/m. Scale bar = 10 μm. (B2) Two τ versus ΔA/A measurements of GUVs of E. coli total lipid extract. To see this figure in color, go online.
Spheroplasts that lost the interior phase contrast
In a normal spheroplast population, there were always some that appeared to have lost the interior phase contrast (but still clearly visible by their boundaries). If the solution contained the nucleic acid-staining, bacterial viability indicator Sytox Green (49), the indicator appeared to first enter such spheroplasts and then leaked out (Fig. 7). This implies that the no-contrast spheroplasts have lost their nucleic acids (49). The response of no-contrast spheroplasts to aspiration was different from normal spheroplasts. If the membranes of no-contrast spheroplasts were stretched, the reversibility of membrane surface area was lost, i.e., when the tension was reduced to smaller values, the membrane did not recover its original smaller area (Fig. 7).
Figure 7.
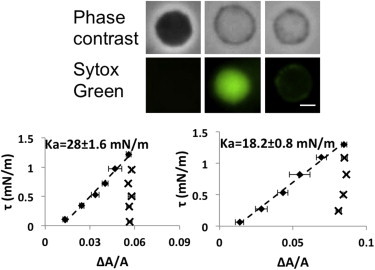
(Top) Paired images of spheroplasts in phase contrast and in the green channel to detect the nucleic acid stain of Sytox Green (at 1 μM): 1st column, the spheroplast with a strong phase contrast showed little penetration by Sytox Green; 2nd column, a spheroplast without interior phase contrast showing very bright Sytox Green in the interior; 3rd column, a spheroplast without interior phase contrast had Sytox Green only around the periphery indicating that the Sytox Green had leaked out. (Bottom) Aspiration experiments on spheroplasts without interior phase contrast (showing two examples). Once the membranes were stretched (diamonds), the membrane area could not recover the low tension value when the tension was reduced (crosses). To see this figure in color, go online.
Spheroplasts in the presence of the metabolic inhibitor CCCP
To test if the stretching reversibility is related to bacterial metabolism, we added 100 μM metabolic inhibitor CCCP (50–52) into a spheroplast suspension in 100% STOP solution. After 1 h, 30 μl of the suspension was injected into an observation chamber containing 28% STOP solution and 100 μM CCCP. The spheroplast population in the observation chamber looked normal initially. But after each additional hour, more and more spheroplasts lost the interior phase contrast. The aspiration experiments were performed soon after the spheroplasts were introduced into the observation chamber. Several spheroplasts with intact phase contrast as well as some without interior phase contract were randomly chosen for measurement. The results (Fig. 8) were the same as shown in Fig. 7. The spheroplasts poisoned by CCCP but still had intact phase contrast behaved exactly the same as those spheroplasts that had lost the interior phase contrast, without or with CCCP. Thus it appeared that the refolding capability of the membrane reservoir was metabolically maintained.
Figure 8.
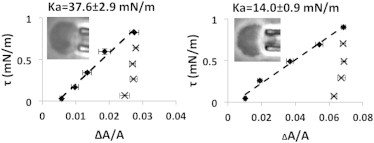
Aspiration experiments on spheroplasts poisoned by CCCP. The spheroplast membrane was stretched by increasing tension (diamonds). Then the tension was reduced to the initial near zero value (crosses). Unlike normal spheroplasts, the membrane area did not recover the initial values. Two examples were shown with the phase contrast images of the poisoned spheroplasts.
Discussion
Comparison with eukryotic cells
In eukaryotic cells, the plasma membrane adheres to the underlying cytoskeleton, mediated by phospholipid-binding proteins (9). Their membrane properties are very different from what were measured here. Micropipette aspiration studies on blood cells essentially characterized the mechanical properties of the whole cells, rather than that of unadhered membranes (1–5). Only in a very swollen condition, the membrane of a red blood cell behaves like a lipid bilayer with a value comparable with a bilayer with comparable cholesterol content (5). In irregularly shaped cells with a rigid cytoskeleton, the plasma membrane superstructures are complicated. Many forms of membrane reservoir were visible in electron micrographs (9). Membrane tension, measurable by the tether technique (10,53), is dominated by membrane-cytoskeleton adhesion and is intimately coupled to cell functions (9).
E. coli. spheroplasts are spherical in shape. Thus the cytoplasmic membrane is most likely not adhered to an underlying cytoskeleton, if any. The requirement to survive over a wide range of external osmolality appears to produce a unique design for the cytoplasmic membrane of E. coli. We found that the spheroplast membrane has its own characteristic properties not found in eukaryotic cells. The cytoplasmic membrane appears to have a total area larger than the spherical surface area of the cell. The excessive area is kept in a membrane reservoir that behaves like membrane folds. As the cell volume expands or contracts by osmolality downshift or upshift, the spheroplast maintains a minimum spherical surface area without tension by adjusting the amount of membrane folds. Membrane tension appeared, only when the volume expansion exhausted the membrane reservoir. Perhaps the mechanosensitive channels and osmoregulators are operative only under such extreme conditions (54).
Physical properties of spheroplast membranes
We have used two different ways of expanding the surface area of a spheroplast. The surface area of a spheroplast could expand 2.4 times in average (the average radius increased from 1.3 to 2 μm) by osmolality downshift (Fig. 1). This expansion or swelling was because of water influx into the cell. It appeared that during the expansion the internal osmolality was adjusted to the external value and there was no pressure difference across the membrane, until the swelling reached its limit. Thus we found the cytoplasmic membrane of E. coli tensionless, unless the bacteria were subject a very low external osmolality.
On the other hand, at a constant external osmolality, the aspiration-induced surface area expansion created tension to counter the force of aspiration. The volume of cytoplasm was constant during this operation. Very importantly we found that, unlike the stretching of a lipid bilayer that follows the rules of elasticity of material deformation (43,55), the area increase of spheroplast membrane by tension was a relaxation process with a time-constant in the order of tens of second (Fig. 2). When the applied tension was reduced to the initial smaller values, the membrane area recovered the original values also by a relaxation process. The equilibrium area-tension relation was strictly reversible, and linear over a small range of tension. Thus phenomenologically the area-tension relation of spheroplast membranes can be described by an apparent area stretching elastic constant . Our water-column manometer was not long enough to measure the entire τ versus curve starting from the least swollen condition to the very swollen condition. Instead we measured by aspiration at different values of external osmolality. The values of were the same at 25°C and at 37°C (Fig. 4). We found that the value of increases with the degree of swelling (Fig. 5), up to about mN/m (Fig. 3). No higher values were found except in very swollen spheroplasts that behave like a GUV made of E. coli total lipid extract. We found that both the very swollen spheroplasts and the GUVs of E. coli lipid extract had values of mN/m (Fig. 6). Interestingly, the reversibility of membrane area stretching was lost when spheroplasts were poisoned by the metabolic inhibitor CCCP, suggesting that the membrane reservoir is maintained metabolically.
It is clear that the elasticity of spheroplast membranes with is not that of stretching a lipid bilayer, because the values of for lipid bilayers are typically ∼ 200 mN/m without cholesterol (40) and higher with cholesterol (5). Rather the spheroplast membrane area is controlled by a membrane reservoir. This membrane reservoir exhibits six characteristic properties: 1), it maintains a minimum surface area for the cell at zero tension over a wide range of external osmolality; 2), it increases or decreases membrane area reversibly in response to an applied tension; 3), it changes the membrane area by a relaxation process; 4), the membrane stretching elastic constant changes with external osmolality; 5), when the reservoir is exhausted by swelling, the spheroplast membrane has the stretching elasticity of a lipid bilayer; and 6), the refolding capability of the reservoir is maintained metabolically.
We do not know the underlying mechanisms that give rise to these properties. However, they are understandable, if we assume that the membrane reservoir is metabolically maintained by reversible chemical bonds (44). In the following we describe the characteristics of a simple generic model for membrane stretching elasticity based on a membrane reservoir maintained by reversible chemical bonds. We assume that each bond is responsible for an area of membrane, so that when N bonds were broken the surface area will increase by .
Membrane area changes as a relaxation process
We assume that, at zero tension, the bound state (B) and the unbound state (U) of a chemical bond are in kinetic equilibrium. This is expressed as a reversible reaction , with an unbonding rate constant and a bonding rate constant . At time zero, a tension is applied to the bonds, that changes the rate constants to and . As a function of time, under the constant tension, the number of unbound states is , where , and are the initial and final values. For area expansion, we set the initial , so as a function of time . After the area expansion reached equilibrium, the tension was reduced to zero. Then the area decrease is described by , where . These are the expressions used to fit the data for area increase and decrease in Fig. 2. and are the time constants of the relaxation processes.
The effect of tension
Assume a binding energy for each bond. Initially, in the absence of tension, there are broken (or unbound) bonds and intact bonds among a total of , where , is the Boltzmann constant and T is the temperature. From the equilibrium condition , one obtains the relation for the rate constants .
If a tension is applied to a chemical bond, its effect can be expressed by a decrease of the binding energy by , where a is a parameter such that is the amount of work done by tension per bond (44). Then the rate constants are modified to . The increase of relative to , by a factor of , increases to , from which one can derive the tension versus area relation.
We can make a rough estimate for the value of the bond energy. Take the example of mN/m in Fig. 3: an applied tension increased the surface area of a spheroplast by 2.5%; the diameter of the spheroplast ∼ 5 μm; thus ; the work done is . Because the membrane thickness is ∼ , we assume the minimum area size per chemical bond . Thus the stretching has broken bonds. Therefore the binding energy per bond is (when mN/m). The value of the apparent area-stretching modulus varies from near zero to ∼ 100 mN/m, as the membrane progressively unfolds. This implies that the strength of the chemical bonds for the membrane reservoir covers a range of value, and the bonds are progressively broken from the weaker to the stronger ones as the membranes are unfolded.
Summary
E. coli is the most studied microorganism, but the physical property of its cytoplasmic membrane has been unknown, because it is normally shielded by an outer membrane. Our main results are the discovery of the tensionless condition of cytoplasmic membranes of E. coli and their unusual stretching properties. A membrane reservoir appears to serve the function of adjusting the cytoplasmic volume so as to maintain equal osmolality on both sides of the membrane. At the least swollen state of spheroplast, less than one-half of membrane forms the surface area. More than one-half of the membrane is in reservoir. When a tension is applied to the spheroplast membrane, its area increases by a relaxation process but the area would decrease reversibly when the tension is removed. Most interestingly this reversibility is lost in the presence of metabolic inhibitor CCCP. The cytoplasmic membrane is under a tension only when the membrane reservoir is completely unfolded by swelling.
These physical properties are important for experiments using spheroplast membranes, particularly for the investigations of how peptides and proteins interact with bacterial cytoplasmic membranes.
Acknowledgments
This work was supported by NIH Grant GM55203 and the Robert A. Welch Foundation Grant C-0991.
Supporting Material
References
- 1.Mohandas N., Evans E. Mechanical properties of the red cell membrane in relation to molecular structure and genetic defects. Annu. Rev. Biophys. Biomol. Struct. 1994;23:787–818. doi: 10.1146/annurev.bb.23.060194.004035. [DOI] [PubMed] [Google Scholar]
- 2.Needham D., Hochmuth R.M. A sensitive measure of surface stress in the resting neutrophil. Biophys. J. 1992;61:1664–1670. doi: 10.1016/S0006-3495(92)81970-7. [DOI] [PMC free article] [PubMed] [Google Scholar]
- 3.Tsai M.A., Frank R.S., Waugh R.E. Passive mechanical behavior of human neutrophils: effect of cytochalasin B. Biophys. J. 1994;66:2166–2172. doi: 10.1016/S0006-3495(94)81012-4. [DOI] [PMC free article] [PubMed] [Google Scholar]
- 4.Evans E., Yeung A. Apparent viscosity and cortical tension of blood granulocytes determined by micropipet aspiration. Biophys. J. 1989;56:151–160. doi: 10.1016/S0006-3495(89)82660-8. [DOI] [PMC free article] [PubMed] [Google Scholar]
- 5.Hochmuth R.M. Micropipette aspiration of living cells. J. Biomech. 2000;33:15–22. doi: 10.1016/s0021-9290(99)00175-x. [DOI] [PubMed] [Google Scholar]
- 6.Sheetz M.P., Dai J. Modulation of membrane dynamics and cell motility by membrane tension. Trends Cell Biol. 1996;6:85–89. doi: 10.1016/0962-8924(96)80993-7. [DOI] [PubMed] [Google Scholar]
- 7.Sheetz M.P., Sable J.E., Döbereiner H.G. Continuous membrane-cytoskeleton adhesion requires continuous accommodation to lipid and cytoskeleton dynamics. Annu. Rev. Biophys. Biomol. Struct. 2006;35:417–434. doi: 10.1146/annurev.biophys.35.040405.102017. [DOI] [PubMed] [Google Scholar]
- 8.Sheetz M.P. Cell control by membrane-cytoskeleton adhesion. Nat. Rev. Mol. Cell Biol. 2001;2:392–396. doi: 10.1038/35073095. [DOI] [PubMed] [Google Scholar]
- 9.Gauthier N.C., Masters T.A., Sheetz M.P. Mechanical feedback between membrane tension and dynamics. Trends Cell Biol. 2012;22:527–535. doi: 10.1016/j.tcb.2012.07.005. [DOI] [PubMed] [Google Scholar]
- 10.Dai J., Sheetz M.P. Membrane tether formation from blebbing cells. Biophys. J. 1999;77:3363–3370. doi: 10.1016/S0006-3495(99)77168-7. [DOI] [PMC free article] [PubMed] [Google Scholar]
- 11.Jones W.R., Ting-Beall H.P., Guilak F. Alterations in the Young’s modulus and volumetric properties of chondrocytes isolated from normal and osteoarthritic human cartilage. J. Biomech. 1999;32:119–127. doi: 10.1016/s0021-9290(98)00166-3. [DOI] [PubMed] [Google Scholar]
- 12.Martinac B., Buechner M., Kung C. Pressure-sensitive ion channel in Escherichia coli. Proc. Natl. Acad. Sci. USA. 1987;84:2297–2301. doi: 10.1073/pnas.84.8.2297. [DOI] [PMC free article] [PubMed] [Google Scholar]
- 13.Ruthe H.J., Adler J. Fusion of bacterial spheroplasts by electric fields. Biochim. Biophys. Acta. 1985;819:105–113. doi: 10.1016/0005-2736(85)90200-7. [DOI] [PubMed] [Google Scholar]
- 14.Renner L.D., Weibel D.B. Cardiolipin microdomains localize to negatively curved regions of Escherichia coli membranes. Proc. Natl. Acad. Sci. USA. 2011;108:6264–6269. doi: 10.1073/pnas.1015757108. [DOI] [PMC free article] [PubMed] [Google Scholar]
- 15.Randall C.P., Mariner K.R., O’Neill A.J. The target of daptomycin is absent from Escherichia coli and other gram-negative pathogens. Antimicrob. Agents Chemother. 2013;57:637–639. doi: 10.1128/AAC.02005-12. [DOI] [PMC free article] [PubMed] [Google Scholar]
- 16.White D., Drummond J., Fuqua C. Oxford University Press; Oxford, UK: 2012. The Physiology and Biochemistry of Prokaryoties. [Google Scholar]
- 17.Wood J.M. Osmosensing by bacteria: signals and membrane-based sensors. Microbiol. Mol. Biol. Rev. 1999;63:230–262. doi: 10.1128/mmbr.63.1.230-262.1999. [DOI] [PMC free article] [PubMed] [Google Scholar]
- 18.Chang G., Spencer R.H., Rees D.C. Structure of the MscL homolog from Mycobacterium tuberculosis: a gated mechanosensitive ion channel. Science. 1998;282:2220–2226. doi: 10.1126/science.282.5397.2220. [DOI] [PubMed] [Google Scholar]
- 19.Jensen M.O., Mouritsen O.G. Lipids do influence protein function—the hydrophobic matching hypothesis revisited. Biochim. Biophys. Acta. 2004;1666:205–226. doi: 10.1016/j.bbamem.2004.06.009. [DOI] [PubMed] [Google Scholar]
- 20.Berchtold D., Piccolis M., Loewith R. Plasma membrane stress induces relocalization of Slm proteins and activation of TORC2 to promote sphingolipid synthesis. Nat. Cell Biol. 2012;14:542–547. doi: 10.1038/ncb2480. [DOI] [PubMed] [Google Scholar]
- 21.Sochacki K.A., Barns K.J., Weisshaar J.C. Real-time attack on single Escherichia coli cells by the human antimicrobial peptide LL-37. Proc. Natl. Acad. Sci. USA. 2011;108:E77–E81. doi: 10.1073/pnas.1101130108. [DOI] [PMC free article] [PubMed] [Google Scholar]
- 22.Barns K.J., Weisshaar J.C. Real-time attack of LL-37 on single Bacillus subtilis cells. Biochim. Biophys. Acta. 2013;1828:1511–1520. doi: 10.1016/j.bbamem.2013.02.011. [DOI] [PMC free article] [PubMed] [Google Scholar]
- 23.Rangarajan N., Bakshi S., Weisshaar J.C. Localized permeabilization of E. coli membranes by the antimicrobial peptide Cecropin A. Biochemistry. 2013;52:6584–6594. doi: 10.1021/bi400785j. [DOI] [PMC free article] [PubMed] [Google Scholar]
- 24.Pogliano J., Pogliano N., Silverman J.A. Daptomycin-mediated reorganization of membrane architecture causes mislocalization of essential cell division proteins. J. Bacteriol. 2012;194:4494–4504. doi: 10.1128/JB.00011-12. [DOI] [PMC free article] [PubMed] [Google Scholar]
- 25.Huang H.W. Free energies of molecular bound states in lipid bilayers: lethal concentrations of antimicrobial peptides. Biophys. J. 2009;96:3263–3272. doi: 10.1016/j.bpj.2009.01.030. [DOI] [PMC free article] [PubMed] [Google Scholar]
- 26.Galinski E.A. Osmoadaptation in bacteria. Adv. Microb. Physiol. 1995;37:272–328. [PubMed] [Google Scholar]
- 27.Lippert K., Galinski E.A. Enzyme stabilization by ectoine-type compatible solutes: protection against heating, freezing and drying. Appl. Microbiol. Biotechnol. 1992;37:61–65. [Google Scholar]
- 28.Kennedy E.P., Rumley M.K. Osmotic regulation of biosynthesis of membrane-derived oligosaccharides in Escherichia coli. J. Bacteriol. 1988;170:2457–2461. doi: 10.1128/jb.170.6.2457-2461.1988. [DOI] [PMC free article] [PubMed] [Google Scholar]
- 29.Record M.T., Jr., Courtenay E.S., Guttman H.J. Responses of E. coli to osmotic stress: large changes in amounts of cytoplasmic solutes and water. Trends Biochem. Sci. 1998;23:143–148. doi: 10.1016/s0968-0004(98)01196-7. [DOI] [PubMed] [Google Scholar]
- 30.Cayley D.S., Guttman H.J., Record M.T., Jr. Biophysical characterization of changes in amounts and activity of Escherichia coli cell and compartment water and turgor pressure in response to osmotic stress. Biophys. J. 2000;78:1748–1764. doi: 10.1016/s0006-3495(00)76726-9. [DOI] [PMC free article] [PubMed] [Google Scholar]
- 31.Stock J.B., Rauch B., Roseman S. Periplasmic space in Salmonella typhimurium and Escherichia coli. J. Biol. Chem. 1977;252:7850–7861. [PubMed] [Google Scholar]
- 32.Sen K., Hellman J., Nikaido H. Porin channels in intact cells of Escherichia coli are not affected by Donnan potentials across the outer membrane. J. Biol. Chem. 1988;263:1182–1187. [PubMed] [Google Scholar]
- 33.Kwok R., Evans E. Thermoelasticity of large lecithin bilayer vesicles. Biophys. J. 1981;35:637–652. doi: 10.1016/S0006-3495(81)84817-5. [DOI] [PMC free article] [PubMed] [Google Scholar]
- 34.Sun Y., Hung W.C., Huang H.W. Interaction of tea catechin (-)-epigallocatechin gallate with lipid bilayers. Biophys. J. 2009;96:1026–1035. doi: 10.1016/j.bpj.2008.11.007. [DOI] [PMC free article] [PubMed] [Google Scholar]
- 35.Sun Y., Lee C.C., Huang H.W. Adhesion and merging of lipid bilayers: a method for measuring the free energy of adhesion and hemifusion. Biophys. J. 2011;100:987–995. doi: 10.1016/j.bpj.2011.01.013. [DOI] [PMC free article] [PubMed] [Google Scholar]
- 36.Onitsuka M.O., Rikihisa Y., Maruyama H.B. Biochemical and topographical studies on Escherichia coli cell surface. IV. Giant spheroplast formation from a filamentous cell. J. Bacteriol. 1979;138:567–574. doi: 10.1128/jb.138.2.567-574.1979. [DOI] [PMC free article] [PubMed] [Google Scholar]
- 37.Ishihara A., Segall J.E., Berg H.C. Coordination of flagella on filamentous cells of Escherichia coli. J. Bacteriol. 1983;155:228–237. doi: 10.1128/jb.155.1.228-237.1983. [DOI] [PMC free article] [PubMed] [Google Scholar]
- 38.Kubalski A. Generation of giant protoplasts of Escherichia coli and an inner-membrane anion selective conductance. Biochim. Biophys. Acta. 1995;1238:177–182. doi: 10.1016/0005-2736(95)00126-n. [DOI] [PubMed] [Google Scholar]
- 39.Buechner M., Delcour A.H., Kung C. Ion channel activities in the Escherichia coli outer membrane. Biochim. Biophys. Acta. 1990;1024:111–121. doi: 10.1016/0005-2736(90)90214-9. [DOI] [PubMed] [Google Scholar]
- 40.Rawicz W., Olbrich K.C., Evans E. Effect of chain length and unsaturation on elasticity of lipid bilayers. Biophys. J. 2000;79:328–339. doi: 10.1016/S0006-3495(00)76295-3. [DOI] [PMC free article] [PubMed] [Google Scholar]
- 41.Lee M.T., Hung W.C., Huang H.W. Mechanism and kinetics of pore formation in membranes by water-soluble amphipathic peptides. Proc. Natl. Acad. Sci. USA. 2008;105:5087–5092. doi: 10.1073/pnas.0710625105. [DOI] [PMC free article] [PubMed] [Google Scholar]
- 42.Lee M.T., Sun T.L., Huang H.W. Process of inducing pores in membranes by melittin. Proc. Natl. Acad. Sci. USA. 2013;110:14243–14248. doi: 10.1073/pnas.1307010110. [DOI] [PMC free article] [PubMed] [Google Scholar]
- 43.Landau L.D., Lifshitz E.M. Pergamon Press; Oxford, UK: 1970. Theory of Elasticity; pp. 101–122. [Google Scholar]
- 44.Bell G.I. Models for the specific adhesion of cells to cells. Science. 1978;200:618–627. doi: 10.1126/science.347575. [DOI] [PubMed] [Google Scholar]
- 45.Kappel C., Dölker N., Grubmüller H. Universal relaxation governs the nonequilibrium elasticity of biomolecules. Phys. Rev. Lett. 2012;109:118304. doi: 10.1103/PhysRevLett.109.118304. [DOI] [PubMed] [Google Scholar]
- 46.Moy V.T., Florin E.L., Gaub H.E. Intermolecular forces and energies between ligands and receptors. Science. 1994;266:257–259. doi: 10.1126/science.7939660. [DOI] [PubMed] [Google Scholar]
- 47.Kellermayer M.S., Smith S.B., Bustamante C. Folding-unfolding transitions in single titin molecules characterized with laser tweezers. Science. 1997;276:1112–1116. doi: 10.1126/science.276.5315.1112. [DOI] [PubMed] [Google Scholar]
- 48.Koga Y. Thermal adaptation of the archaeal and bacterial lipid membranes. Archaea. 2012;2012:789652. doi: 10.1155/2012/789652. [DOI] [PMC free article] [PubMed] [Google Scholar]
- 49.Roth B.L., Poot M., Millard P.J. Bacterial viability and antibiotic susceptibility testing with SYTOX green nucleic acid stain. Appl. Environ. Microbiol. 1997;63:2421–2431. doi: 10.1128/aem.63.6.2421-2431.1997. [DOI] [PMC free article] [PubMed] [Google Scholar]
- 50.Diez-Gonzalez F., Russell J.B. Effects of carbonylcyanide-m-chlorophenylhydrazone (CCCP) and acetate on Escherichia coli O157:H7 and K-12: uncoupling versus anion accumulation. FEMS Microbiol. Lett. 1997;151:71–76. doi: 10.1016/s0378-1097(97)00140-7. [DOI] [PubMed] [Google Scholar]
- 51.Chapple D.S., Mason D.J., Evans R.W. Structure-function relationship of antibacterial synthetic peptides homologous to a helical surface region on human lactoferrin against Escherichia coli serotype O111. Infect. Immun. 1998;66:2434–2440. doi: 10.1128/iai.66.6.2434-2440.1998. [DOI] [PMC free article] [PubMed] [Google Scholar]
- 52.Piddock L.J., Jin Y.F., Asuquo A.E. Quinolone accumulation by Pseudomonas aeruginosa, Staphylococcus aureus and Escherichia coli. J. Antimicrob. Chemother. 1999;43:61–70. doi: 10.1093/jac/43.1.61. [DOI] [PubMed] [Google Scholar]
- 53.Fazal F.M., Block S.M. Optical tweezers study life under tension. Nat. Photonics. 2011;5:318–321. doi: 10.1038/nphoton.2011.100. [DOI] [PMC free article] [PubMed] [Google Scholar]
- 54.Belyy V., Kamaraju K., Sukharev S. Adaptive behavior of bacterial mechanosensitive channels is coupled to membrane mechanics. J. Gen. Physiol. 2010;135:641–652. doi: 10.1085/jgp.200910371. [DOI] [PMC free article] [PubMed] [Google Scholar]
- 55.Helfrich W. Elastic properties of lipid bilayers: theory and possible experiments. Z. Naturforsch. C. 1973;28:693–703. doi: 10.1515/znc-1973-11-1209. [DOI] [PubMed] [Google Scholar]
Associated Data
This section collects any data citations, data availability statements, or supplementary materials included in this article.