

Abstract
Kinesin motor domains couple cycles of ATP hydrolysis to cycles of microtubule binding and conformational changes that result in directional force and movement on microtubules. The general principles of this mechanochemical coupling have been established; however, fundamental atomistic details of the underlying allosteric mechanisms remain unknown. This lack of knowledge hampers the development of new inhibitors and limits our understanding of how disease-associated mutations in distal sites can interfere with the fidelity of motor domain function. Here, we combine unbiased molecular-dynamics simulations, bioinformatics analysis, and mutational studies to elucidate the structural dynamic effects of nucleotide turnover and allosteric inhibition of the kinesin-5 motor. Multiple replica simulations of ATP-, ADP-, and inhibitor-bound states together with network analysis of correlated motions were used to create a dynamic protein structure network depicting the internal dynamic coordination of functional regions in each state. This analysis revealed the intervening residues involved in the dynamic coupling of nucleotide, microtubule, neck-linker, and inhibitor binding sites. The regions identified include the nucleotide binding switch regions, loop 5, loop 7, α4-α5-loop 13, α1, and β4-β6-β7. Also evident were nucleotide- and inhibitor-dependent shifts in the dynamic coupling paths linking functional sites. In particular, inhibitor binding to the loop 5 region affected β-sheet residues and α1, leading to a dynamic decoupling of nucleotide, microtubule, and neck-linker binding sites. Additional analyses of point mutations, including P131 (loop 5), Q78/I79 (α1), E166 (loop 7), and K272/I273 (β7) G325/G326 (loop 13), support their predicted role in mediating the dynamic coupling of distal functional surfaces. Collectively, our results and approach, which we make freely available to the community, provide a framework for explaining how binding events and point mutations can alter dynamic couplings that are critical for kinesin motor domain function.
Introduction
Kinesins are a large superfamily of microtubule-based motor proteins that play essential roles in intracellular trafficking, cell motility, and cell division (1,2). All kinesins contain one or more homologous motor domains that are responsible for nucleotide-dependent motility along microtubules. Cycles of ATP binding and hydrolysis within these domains are allosterically coupled to changes in microtubule binding affinity and to the coordination of partner domains required for directed motion. For a number of families, this directed motion is thought to involve the hand-over-hand-like stepping of paired motor domains along microtubules (3,4). However, despite extensive biochemical, biophysical, and structural studies, a full appreciation of the underlying allosteric coordination mechanisms remains to be achieved. This lack of knowledge about fundamental dynamic mechanisms hampers the development of new allosteric inhibitors and limits our understanding of how disease-associated mutations in distal sites can interfere with the fidelity of motor domain function.
At a fundamental level, kinesin motor domains, which share core structural features with G proteins and myosins, can be usefully considered as nucleotide-sensing conformational switches. Consequently, much effort has been devoted to characterizing the details of potentially important structural changes. Indeed, crystallographically observed structural differences together with cryo-electron microscopy (cryo-EM) reconstructions and spectroscopic studies have led to a general model for motor domain allostery. In this model, small structural changes at the nucleotide-binding switch I and switch II regions are linked to larger changes at the microtubule-binding α4-loop 12-α5 region that in turn affect the structural dynamics of the partner domain tethering neck-linker (NL) region. This 14- to 18-residue-long segment has been crystallized in a range of conformations, including largely disordered, or so-called undocked, states and a more ordered docked state attached to the main body of the motor domain (3,5–7). This observation, together with electron paramagnetic resonance (EPR) and cryo-EM studies reporting on NL orientation in kinesin-1, support a nucleotide-dependent NL docking model that is thought to provide the principal conformational change that drives kinesin-1 stepping (3,8,9). However, in apparent contrast to findings with kinesin-1, recent kinesin-5 cryo-EM and luminescent studies using fluorescent probes on the kinesin-5 NL indicate nucleotide-dependent transitions between different ordered NL conformations (10–12). Our recent meta-analysis indicated that the more than 90 available motor domain crystal structures represent one of three major conformational groups (13). Two of these three groups correspond to ATP- and ADP-like states, with only the ATP state having a fully docked NL when present in the crystallized construct. The third distinct conformational group is populated solely by Eg5-inhibitor-bound structures. Eg5 is a mitotic kinesin-5 family member that has recently attracted significant attention due to its central role in cell division and because it represents an attractive target for chemotherapeutic intervention (1). A number of allosteric inhibitors of Eg5 have been developed that bind to a site distal from the nucleotide- and microtubule-binding interfaces. These compounds affect microtubule-stimulated ADP release, arrest Eg5 activity, and lead to a common crystallographically observed conformation distinct from that of other ATP- and ADP-bound kinesin family members (13,14).
Our previous detailed comparison of available structures indicated that the conformational differences that define ATP-, ADP-, and Eg5-inhibitor states are localized to four main regions: 1), the nucleotide-binding switch I and switch II loops; 2), the motor tip, comprising portions of β4-β6-β7 and α1b-α2b; 3), the microtubule-binding α4-loop 12-α5 region; and 4), the NL loop (13). Intriguingly, the conformational features of these regions in Eg5 inhibitor structures appear intermediate to those in ATP and ADP structures. This includes a more ATP-like α4-loop 12-α5 region, an ADP-like motor tip (β4-β6-β7 and α1b-α2b), and a partially docked NL (where the beginning N-terminal segment is attached to the side of the motor domain but the C-terminal is detached). Other structurally variable regions (such as loops 5, 8, and 11) either exist in a wide range of conformations with no clear relationship to nucleotide or inhibitor state, or vary in composition between Eg5 and other kinesin families, complicating direct superfamily-level comparisons. However, a number of these variable regions are likely to have an important allosteric role in at least some families. For example, the variable-length, solvent-exposed loop 5 (located between α2a and α2b in all kinesin families) provides a major portion of the binding site for small-molecule kinesin-5 allosteric inhibitors, including monastrol and its derivatives. Furthermore, mutagenesis of residues in loop 5, transient-state kinetics, infrared spectroscopy, and EPR spectroscopy measurements have demonstrated that mutations in this region can affect ADP release and NL conformational variations (15–17). Similarly, the N-terminal region can be observed to form a short β-sheet interaction with a portion of the NL in a number of ATP-like crystal structures. This interaction has been termed the cover-neck bundle, and steered molecular-dynamics (MD) simulations, mutagenesis, and EPR measurements indicate that this potentially transient interaction may be required for force generation in kinesin-5 (10,11,18).
Emerging evidence indicates that different conformations of functional regions are to some extent accessible regardless of the bound nucleotide (13,19–21). In contrast to the strict nucleotide-associated conformational trends observed for a number of structurally related G protein families (22,23), multiple kinesin crystal structures are characterized as ATP-like but have ADP present in the nucleotide-binding pocket (and vice versa). This ability to adopt distinct conformations with either nucleotide is also supported by recent enhanced sampling MD simulations that revealed a tendency for nucleotide-free kinesin to exhibit both ATP- and ADP-like conformations (13). In a similar vein, recent Eg5 spectroscopic data indicate that loop 5 exists in a range of conformations, but their relative populations differ between nucleotide states (21). Collectively, these recent findings highlight the fact that the use of static crystallographic structures and relatively low-resolution cryo-EM averages must be complemented by a dissection of the dynamic conformational equilibrium and a characterization of the potentially distinct long-range dynamic couplings among functionally important protein regions.
In this work, we used extensive unbiased MD simulations to explore the conformational mobility of the kinesin-5 motor domain and the allosteric effect of inhibitor binding. Multiple replica simulations of ATP-, ADP-, and inhibitor-bound states, together with network analysis of correlated motions, were used to create dynamic protein structure networks depicting the internal dynamic coordination of each state. The nodes of these networks represent individual protein residues, and their connecting edges are weighted by their constituent atomic correlation values. A dissection of network properties, followed by additional analysis of point mutations, was then used to provide the first robust in silico interpretation of the dynamic linkage of key functional regions, including nucleotide-, inhibitor-, microtubule-, and NL-binding sites. Collectively, our results and approach, which we make freely available to the community, provide a framework for explaining how binding events and point mutations can alter the dynamic couplings that are critical for kinesin motor domain function.
Materials and Methods
MD simulations
Simulation models were based on the high-resolution crystallographic structures of human Eg5 kinesin in complex with the nonhydrolyzable analog AMPPNP (PDB code: 3HQD) (24), ADP (PDB code: 1II6) (25), and ADP plus ispinesib-mesilate (PDB code: 4AP0) (26). AMPPNP was modified to ATP to resemble the natural nucleotide. The unresolved portions of loop 10 and loop 12 in PDB structures 1II6 and 4AP0 were modeled using Modeler v9.10 (27) and evaluated according to the discrete optimized protein energy score (28). All MD simulations were performed using the AMBER 12 package (29) and corresponding all-atom potential function ff99SB (30). The energetic parameters for the nucleotide molecules were obtained from the AMBER parameter database (31). The GAFF force field (32) was used to model the ispinesib molecule, and the atomic charges were determined with GAUSSIAN09 software (33) at the RHF/6-31+G∗ level. The simulation parameters included periodic boundary conditions, TIP3P water, and charge-neutralizing counterions, with full particle-mesh Ewald electrostatics. A 2 fs time step and a 12 Å cutoff value were used for truncation of nonbonded interactions. The equilibration of the three systems consisted of constant volume heating to 300 K for 10 ps, followed by 200 ps of a constant temperature (300 K), constant pressure (1 atm) simulation. The SHAKE algorithm was used to constrain all covalent bonds involving hydrogen atoms. Four 40 ns MD simulations with random initial velocity assignments were then performed on each system, resulting in a total of 160 ns of production phase dynamics for each state. Five additional sets of in silico mutation simulations (with substitutions based on the results of wild-type simulations, namely, P131A (loop 5), Q78A/I79A (α1), E166A (loop 7), and K272A/I273A (β7) G325A/G326A (loop 13)), were performed with the same parameters used for the wild-type simulations. Note that extended 100 ns simulations of the wild-type ATP state were found to yield results similar to those obtained in 40 ns simulations in terms of correlation network analysis.
Trajectory analysis
The Bio3D package version 2.0.1 was used for all trajectory analyses, including dynamic network construction and analysis (34). To characterize correlated atomic fluctuations, the heavy-atom residue-wise linear mutual information (LMI) (35) was calculated as follows:
where Ci is the covariance matrix for the displacement of heavy atom i and Cij for atoms i and j. The LMI of residues A and B corresponds to the maximum value of the LMI among the atoms forming residue A and residue B (indicated with G(A) and G(B), respectively). This analysis was performed separately on each simulation, resulting in four matrices per protein state. Each group of four matrices was also used to obtain a consensus matrix containing average LMI values if the values from individual simulations were greater than or equal to a cutoff value of 0.6. Zero values were assigned to ij of the consensus matrix if any LMIij was <0.6 and the respective atoms were separated by >10 Å in 70% of cumulative simulation frames. In contrast to previous approaches, this procedure retains strong couplings regardless of structural proximity and limits the use of a contact map filter to the small subset of weak correlations that fluctuate both above and below the cutoff value.
Correlation network analysis
A network for each protein state depicting the internal dynamic correlation of the motor domain was built from the consensus matrices described above. As implemented in Bio3D (34), network nodes represent heavy atoms, which are connected through edges weighted by minus the logarithm of their LMI values. Community analysis and node centrality with Bio3D and suboptimal path calculation with the WISP software (36) were performed on each network to characterize network properties and to identify residues involved in the potential dynamic coupling of distal sites. The parameters for the suboptimal path analysis included input source and sink nodes, as well as the total number of paths to be calculated. The latter parameter was set to 500 paths, which was found to yield converged results in all cases (see Fig. S1 in the Supporting Material). We note that all analysis methods have been made freely available within the Bio3D package (http://thegrantlab.org/bio3d/).
Results and Discussion
Extensive MD simulations were used to characterize the internal dynamics of the kinesin-5 motor domain in ATP-, ADP-, and inhibitor-bound states. These consisted of four independent 40 ns simulations for each state (160 ns of total simulation time per state) from which consensus dynamic properties were calculated. In addition to conventional geometric metrics, we used correlation network analysis methods to investigate dynamically coordinated regions in all simulations (see Materials and Methods section for full details). We then characterized the dynamical coordination of nucleotide-, inhibitor-, microtubule-, and NL-binding sites in the various states by calculating optimal and suboptimal paths between these sites in the respective atomically detailed correlation networks. Finally, we performed four additional sets of in silico alanine mutation simulations to probe the potential allosteric role of residues in loop 5, loop 7, α1, and loop 13.
Nucleotide-dependent differences in flexibility and dynamical correlations
ATP-, ADP-, and inhibitor-bound states were found to display an overall common trend of residue-wise root mean-square fluctuations (RMSFs; see Fig. 1). This trend consisted of comparatively low RMSF values for the buried core β-sheet, with larger values evident for solvent-exposed regions, including loop 2, loop 5, β5b-β5c-loop 8, loop 10, loop 11, and NL regions. Structural regions with statistically significant differences between states (shaded regions in Fig. 1 with a p value < 0.01) were localized to inhibitor-, nucleotide-, and NL-interacting sites. These included the inhibitor-binding loop 5 (residues 118–132) and nucleotide-binding switch I (residues 220–235) and switch II (residues 278–288) regions, as well as the NL itself (residues 358–370). In ATP and inhibitor simulations, the N-terminal of the NL region was observed to display significantly reduced flexibility when compared with ADP state simulations, due to the formation of cover-neck bundle interactions with loop 0. However, we noted a relatively high degree of flexibility for the C-terminal portion of the NL in all states. Both loop 5 and switch I displayed significantly higher flexibilities in ADP simulations, reflecting their lack of contacts with inhibitor and the γ-phosphate of ATP. In the ATP state, the switch I region formed frequent contacts with the γ-phosphate of the nucleotide and with switch II, which stabilized a β-hairpin conformation, resulting in an overall reduced switch I and switch II flexibility. In the ADP and inhibitor states, switch I lacked these contacts, was not directly dynamically correlated with the nucleotide, and adopted a range of different conformations with enhanced flexibility. The enhanced ADP state loop 5 flexibility is in agreement with the trend reported from recent time-resolved fluorescence spectroscopy experiments (21) and with a previous MD simulation study (37). However, we noted no significant flexibility differences for this region between ATP and inhibitor simulations. The C-terminal portion of switch II displayed a more disordered and flexible structure in going from ATP- to ADP- and inhibitor-bound states. Helix α4 was extended by one turn in ADP and three turns in ATP compared with the inhibitor. This is reflected in the flexibility of this region, with the inhibitor state having the highest peak in the RMSF profile. Since only the N-terminal portion of switch II (residues 280–285 of the Walker B motif, located between β7 and α4) contacts the γ-phosphate, it is not immediately apparent from direct trajectory inspection why the C-terminal portion displays a distinct flexibility. We used correlation network analysis methods to address the underlying cause of the difference in flexibility of this region, as discussed further below.
Figure 1.
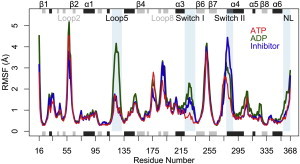
The distinct flexibilities of nucleotide- (switch I and switch II), inhibitor- (loop 5), and NL-binding regions in ATP- (red line), ADP- (green line), and inhibitor- (blue line) bound states. Regions that show statistically significant differences between states (with p < 0.01) and are composed of at least three consecutive residues are highlighted with a light-blue-shaded background. The consensus secondary structure is reported schematically with β strands in gray and α helices in black (top and bottom).
To characterize the potential dynamic coordination of distal sites, we calculated the atomic displacement correlations for each residue pair in all simulations (Fig. 2). Consistent with our previously reported results obtained from accelerated MD simulations (13), the correlation matrices showed strong couplings in all states to the central β-sheet comprising residues in β4-β6-β7 and α1b-α2b, among the microtubule-binding-site elements α4-loop 12-α5-loop 8, and between loop 2 and loop 14. An additional feature common to all states was loop 7 coordination with switch I, switch II, and α5. This result is consistent with the suggestion that loop 7 plays a key role in bridging the nucleotide- and microtubule-binding sites (13,38), as also indicated by the correlation network analysis results detailed below. The prominent coordinating role of loop 7 is further supported by the decoupling of microtubule- and nucleotide-binding coordination upon mutation of loop 7 Y485 in Drosophila kinesin-14 (equivalent to Y164 in kinesin-5) (38). The NL region displays variable couplings in the different states. With ATP and inhibitor, the N-terminal portion of the NL couples to the central β-sheet through β1-loop 0. These interactions have been referred to as the cover-neck bundle (39), and kinetic and mutational analyses have demonstrated the importance of these interactions for NL conformation (10,39). The simulations described here indicate that these couplings are largely absent in ADP simulations, consistent with the undocked conformation of the NL, which intermittently coordinates with the loop 2 region. The C-terminal portion of the NL couples with β7 in the presence of ATP, but not with ADP or inhibitor. Taken together, these results are consistent with full NL docking with ATP, partial docking with inhibitor, and full undocking with ADP.
Figure 2.
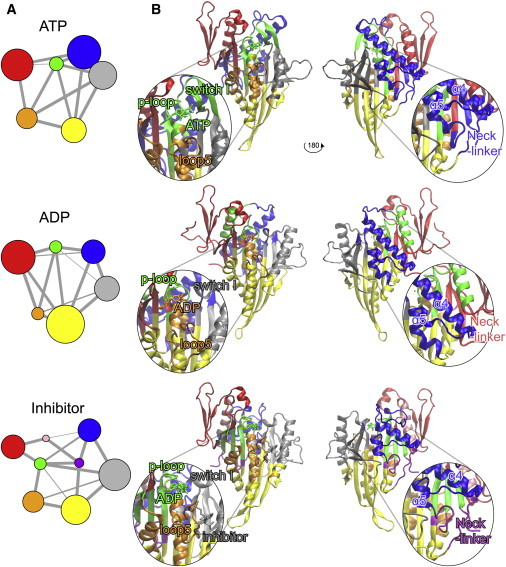
Community analysis reveals nucleotide- and inhibitor-dependent differences in the dynamic coupling of nucleotide-, inhibitor-, and NL-binding regions. (A) Community partitioning from correlation network analysis. (B) Front and back views of the motor domain structure for each state along with a zoomed-in view of the nucleotide- and microtubule-binding regions. The colors match the community partitioning shown in A.
Correlation network analysis
To aid in the further interpretation and quantification of state-specific couplings, we constructed correlation networks in which nodes represent protein residues and the connecting edges are weighted by the strength of their respective correlation values. This approach has been used successfully to dissect allosteric couplings in a range of systems (13,40–42). To assess the consistency of our results, given the potential limited sampling of a single simulation, we calculated correlation networks using both individual simulations and the consensus mutual information from multiple replica simulations (see Materials and Methods). Applying community analysis to cluster these networks into highly intracorrelated structural regions that are more loosely connected to the rest of the motor domain reveals four main consistently correlated protein sectors (or community groups) common to all three states. The largest of these common sectors comprises the bottom portion of the central β-sheet (yellow in Fig. 2). The second major correlated motor domain sector is comprised of switch II-α4-loop 12-α5 regions (blue in Fig. 2). The third sector corresponds to α0-loop 1-β2-loop 2-loop 14 regions (red in Fig. 2) and the fourth corresponds to α3-loop 8 (gray in Fig. 2). This result indicates that these portions of structure have an intrinsic tendency to exhibit correlated motions regardless of the motor domain’s nucleotide- or inhibitor-bound state. In contrast, nucleotide and inhibitor presence was found to clearly affect the collective motions (and community composition) of switch I, switch II, loop 5, and the distal NL regions. Consistent with the differences in flexibility noted above, in the ATP state the P loop, switch I, switch II, and the nucleotide itself formed one highly coupled community (green in Fig. 2, ATP), whereas in the ADP state the nucleotide grouped with loop 5-α2a (orange in Fig. 2, ADP), and in the inhibitor state it grouped with the P loop and β1-β3-β8 (back to green in Fig. 2, inhibitor). This indicates that the γ-phosphate of ATP plays a fundamental role in the coordination of these regions, but in the presence of ADP these elements show an overall looser coupling. The nucleotide also affected loop 5 (orange sector in Fig. 2): in the ATP and inhibitor states, loop 5 clustered with α1a and α2b through interactions between residues P131 (loop 5) and Q78-I79 (α1a) and E128 (loop 5) to H141 (α2b), whereas in the ADP state this coordination was absent. As noted above, RMSF data indicating that loop 5 is more rigid in ATP and inhibitor states and more flexible with ADP are consistent with this result (Fig. 1). Furthermore, a recent mutational study confirmed the importance of P131 and loop 5 in modulating ADP dissociation kinetics, as well as NL conformational changes (17). Further supporting the allosteric effect of the inhibitor, we found that the NL region in the ATP state coordinates with the microtubule-binding site (blue in Fig. 2, ATP), whereas in the inhibitor state it is isolated (purple in Fig. 2, inhibitor). Residues L324–G325 (loop 13), T330 (β8), and N358-I359 (NL) showed reduced couplings in the inhibitor state (Table S1), leading to NL decoupling from these elements. Both experiments and our previous in silico mutational studies identified residues G325 and I359 as being fundamental for NL coordination and kinesin motility, further supporting the results presented here (13,43).
The ATP state displays a higher degree of microtubule-binding-site coordination
To quantify the relative importance of each residue in the correlated motions of the motor domain, we calculated the eigenvector centrality for each node in all correlation networks. This method diagonalizes the adjacency matrix (i.e., the correlation matrix) and selects the eigenvector associated with the highest eigenvalue. The result is a measure of the influence of each residue on the overall correlation network of each state. A comparison of the residue centralities of ATP and ADP states reveals major differences in the microtubule-binding site and NL regions (Fig. 3). The α4-loop 12-α5-loop 13 and the NL display comparatively low centrality values in the ADP state, but higher values with ATP. This indicates an increased importance in the network and higher overall correlations for these regions in the presence of ATP. This result parallels the diverse affinities of the motor domain conformations for the microtubule: in the ATP state, the affinity is stronger and the structural elements that form the binding interface are dynamically correlated, whereas in the ADP state, both the affinity and the binding-site dynamical correlation are weaker (44,45). In addition, the ATP- and ADP-state centrality values highlight the importance of α1-β4-β6-β7 regions, which exhibit high centrality values in both ATP and ADP states (Fig. 3).
Figure 3.
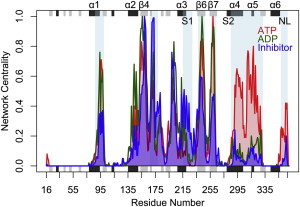
Differences in residue-wise network centralities for ATP (red), ADP (green), and inhibitor (blue) networks. Regions of significant difference are highlighted with a light-blue-shaded background. Note the reduced inhibitor centralities for the central β-sheet (β3, β4, β6, and β7), as well as the α4-loop 12-α5-loop 13 and NL regions.
Nucleotide-dependent couplings link ATP to switch I, and the NL to the central β-sheet
To identify residues with distinct couplings in the ATP and ADP states, we characterized the unique edges present in ATP and ADP networks. This analysis identified distinct state-specific correlations for residues located in regions that undergo nucleotide-associated conformational rearrangements (β5b, switch I, switch II, and NL) and in their coordinating structural elements (α5, β3, β7, loop 13, β8) (Fig. 4; Table 1). The nucleotide-dependent correlations of these regions imply a potentially important allosteric role for these sites. Intriguingly, mutations at a number of these sites (see Table 1) are associated with deficiencies in the kinesin cycle that lead to pathologies such as spastic paraplegia and Charcot-Marie-Tooth syndrome (46,47).
Figure 4.
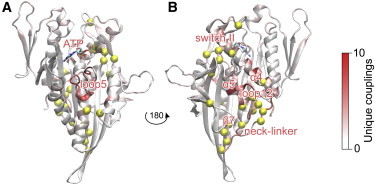
The extent of unique dynamic couplings per state defines the regions affected by nucleotide binding. (A and B) Front (A) and rear (B) views of the motor domain, colored by the proportion of unique couplings per residue. Yellow spheres correspond to residues with three or more unique couplings in both ATP and ADP states (see Table 1 for details).
Table 1.
Residues with three or more unique dynamic couplings in both ATP and ADP states
| Residue | Location |
|---|---|
| Y97 | β3 |
| H141 | α2a |
| E162 | β4 |
| F185a | β5b |
| K207 | α3 |
| T222 | SI |
| S232a | SI |
| R234a | SI |
| S235a | SI |
| V256 | β7 |
| K257 | β7 |
| I258 | β7 |
| G259 | β7 |
| I272a | SII |
| I288 | SII |
| I299 | α4 |
| D322 | α5 |
| L324 | L13 |
| G325a | L13 |
| R329a | β8 |
| N361a | NL |
| K362 | NL |
Sites with mutations known to be associated with diseases.
Among the most notable nucleotide-associated unique couplings, we found that the nucleotide-binding-site residues S232, R234, and S235 (switch I) displayed strong coupling with ATP and the magnesium ion, whereas ADP lacked any persistent correlations with switch I residues. This is consistent with results from network community analysis, which showed that the nucleotide-binding pocket had a high overall correlation in the ATP state. Intriguingly, residues R234 and S235 coordinated with switch II residues 284–288, forming a switch I-switch II connection that was present in the ADP state only. In addition, for the microtubule-binding and NL regions, residue F185 (β5b) coordinated both β5a and α5, and residues Y97 (β3), V256–G259 (β7), I299 (α4), D322 (α5), L324–G325 (loop 13), and R329 (β8) showed distinct couplings with the NL (Fig. 4; Table S2). Consistent with this analysis, previous simulations of G325A/G326A mutation displayed a reduced coupling between microtubule-binding-site elements and NL regions (13).
Inhibitor affects both the microtubule-binding-site and central-β-sheet coordination, leading to a dynamic decoupling of nucleotide-, NL-, and microtubule-binding-site regions
A node centrality analysis of inhibitor-state simulations revealed a striking reduction in centrality values for the microtubule-binding-site elements, as well as for β3, β4, β6, and β7 of the central β-sheet (Fig. 3). This difference demonstrates how the presence of the simulated inhibitor, ispinesib-mesilate, affects multiple dynamic sites on the protein structure, decreasing their overall coordination to other key regions of the motor domain. Regions that show increased centrality values in the inhibitor state include helix α3 and loop 8a. The α3 helix, together with loop 5, forms part of the inhibitor-binding site. Inhibitor binding leads to new correlations between these binding-site regions. To characterize the additional effects of inhibitor binding, we performed a set of control simulations on the inhibitor state by removing the ispinesib-mesilate molecule. A comparison of the inhibitor-state node centrality with the control system supported the inhibitor’s effect on the microtubule-binding site and the core β-sheet, as the peaks in these regions dramatically increased upon inhibitor removal (Fig. S2). Among the unique ATP- and ADP-state residue couplings that were previously identified, we found that residues D322 in α5 and L324–G325 in loop 13 exhibited a lower coordination with β5b, α4, loop 12, and the N-terminal portion of the NL in the inhibitor state (Table S1). This result indicates that inhibitor binding affects the microtubule-binding site by decreasing its dynamical coupling to distal sites. In addition, β7 residues from V256–G259 exhibited a marked reduction in their couplings with the adjacent C-terminal segment of the docked NL when compared with the ATP state, highlighting the inhibitor’s effect on β7 (Table S2). In the inhibitor state, we also noted a decoupling between residue D162 (β4) and loop 8a due to a displacement of these regions upon inhibitor binding.
Network path analysis indicates a nucleotide- and inhibitor-dependent shift in the allosteric linkage of functional sites
To further characterize the dynamic linkage of distal functional regions, we subjected the ATP, ADP, and inhibitor networks to optimal and suboptimal path analysis. This approach entails the calculation of the shortest path plus the longer suboptimal paths through all network edges (representing residue correlations) between selected node pairs. The resulting path ensemble depicts the multiple ways in which dynamic communication could flow among the selected sites, with the path lengths defined as the sum of the respective edge weights crossed. Applying this approach to the nucleotide-NL, nucleotide-microtubule, and loop 5-NL binding sites revealed state-dependent differences in potential functional significance (Fig. 5).
Figure 5.
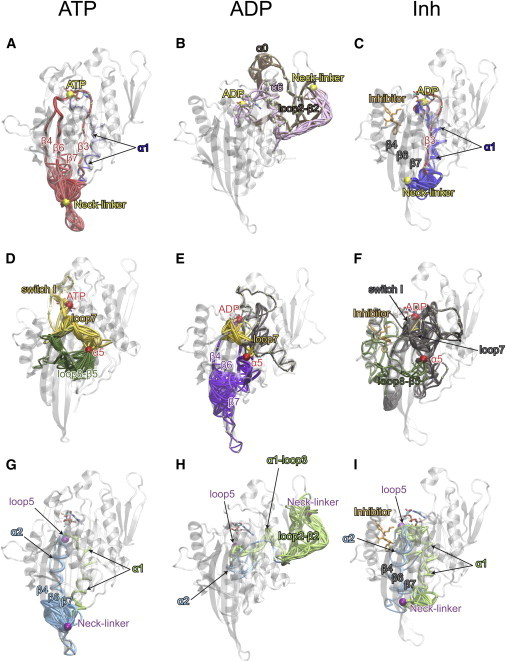
Optimal and suboptimal path analysis reveals nucleotide- and inhibitor-dependent coupling routes between functional sites. (A–C) Paths linking nucleotide and the NL (with source and sink nodes represented by the β-phosphate of the nucleotide and residue 368 of the NL). (D–F) Paths from the nucleotide to α5 (β-phosphate and residue 318) and (G–I) paths from loop5 to the NL (residues 131 and 368). The ATP state is represented in A, D, and G; ADP is represented in B, E, and H; and inhibitor is represented in C, F, and I. Source and sink nodes are highlighted with spheres with related paths (passing through the same structural elements) between these nodes shown in the same color. See main text for details. To see this figure in color, go online.
In the presence of ATP, the majority of the nucleotide-NL paths (>99%) crossed switch I, loop 7, and the central β3, β4, β6, or β7 strands (Fig. 5 A, red paths; Table S3). An alternative, longer route passed through α1 in a minority of paths (<1%; blue in Fig. 5 A). A shift in the relative coupling via these two paths was evident in mutational simulations of K257A/I258A in β7, which favored the α1 route (Fig. S3). Intriguingly, clinically observed mutations of residues S159, E162, S233, R234, and S235, which are located on the predicted dominant path, are known to be associated with behavioral disturbance and peripheral neuropathy diseases (46,47). A strikingly different pattern of paths was evident with bound ADP (Fig. 5 B). These involved β1-loop 1-α0-loop 2-β2 segments (59% of paths, brown paths in Fig. 5 B) or helix α6 (41%; pink in Fig. 5 B). This difference reflects the variable but distinct conformation of the NL, which in this state is frequently distant from the motor tip and occasionally proximal to loop 2-β2. In the inhibitor state, we observed a pattern similar to that observed for the ATP state (Fig. 5 C), but due to the dynamical decoupling of the central β-strands in the presence of inhibitor, the paths shifted toward the less favorable α1 route (99%; blue in Fig. 5 C), with only a small fraction crossing β3 (1%; red on Fig. 5 C). This result indicates that the inhibitor decouples the nucleotide from the NL by affecting the dynamic coupling of the central β-strands, consistent with the lower centrality values for these regions (Fig. 3).
The inhibitor also reduced the overall coordination of switch I, switch II, and loop 7 elements, which link the nucleotide- and microtubule-binding sites (Fig. 5, D–F; Table S4). In the presence of ATP, the majority of paths (69%) linking the nucleotide to α5 crossed switch I and loop 7 through residues N165–E166 (yellow in Fig. 5 D). Also evident was another group of paths (31%; green in Fig. 5 D) traversing the longer β5-loop 8 region, consistent with the high dynamic coordination of this region with the microtubule-binding site in the presence of ATP. To further investigate the main route of the ATP state, we performed simulations on the mutant E166A. The results showed a striking coupling reduction between loop 7 and α5 (from 69% to 47% of total paths), confirming the importance of the glutamate in this position (Fig. S4). The switch II, switch I, and loop 7 regions also featured prominently in the ADP state (17% of paths) (yellow in Fig. 5 E). However, differences in the α4-α5 orientation prevented the paths from crossing β5 and loop 8, instead favoring linkage through β4-β6-β7 (74% of paths; purple in Fig. 5 E). In the inhibitor state, only a small fraction of paths (<1%) traversed these regions and no overall dominant route was evident (Fig. 5 F). This was found to result from weakening of the coordination of switch II, switch I, and loop 7 residues, along with the enhanced flexibility evident for the C-terminus of the switch II region in the inhibitor state. These effects result in path calculations diffusing to a large number of less favorable (longer) surface sites, effectively decoupling these sites in the presence of inhibitor.
As mentioned above, the loop 5 region has recently attracted attention as a potential allosteric regulator of kinesin structure (17). Our simulations indicate that both α1 and α2 helices are involved in the coupling of loop 5 dynamics to the NL in a nucleotide- and inhibitor-dependent fashion (blue and green paths in Fig. 5, G–I). In the presence of ATP, the majority of paths (>99%) from loop 5 to NL traversed α2b and the motor-tip portion of β4, β6, or β7, with only a minority utilizing α1 (<1%) (Fig. 5 G; Table S5). The lack of coordination in β4-β6-β7 in the presence of inhibitor led to the distribution of paths shifting to favor the α1 route (79%) over α2b (21%) (Fig. 5 I). In addition, an examination of the network connections involving α1 identified residues Q78–I79 in α1a and P131 in loop 5 as key coupling positions. Their importance for coupling loop5 and α1 was also evident in additional mutational simulations of P131A (loop 5) and Q78A/I79A (α1a), which showed reduced coordination between loop 5 and α1a (Fig. S5). Conversely, helix α2b is adjacent in sequence and structure to loop 5, and these elements share many highly correlated edges. Indeed, we were not able to identify individual residue substitutions that resulted in significant changes for the coupling of these regions (data not shown). Also, our results contrast with the previously proposed hypothesis that α3 could represent a key element for loop 5 allosteric regulations (21). We note that loop 5 residues link to α3 in both ATP and inhibitor networks (residues W127 and E128 in loop 5, and K207 and Y211 in α3), but they do not emerge as participating in the coupling paths between loop 5 and NL or nucleotide. Furthermore, despite the undocked NL conformation, the ADP-state paths crossed the N-terminal portions of α1 (98%) and α2 (2%) (Fig. 5 H), as well as β2 and loop 2 segments, indicating that the loop5-α1 and loop5-α2 connections are important for coupling to the NL in all states.
Conclusions
This study combines results from extensive MD simulations with insights from bioinformatics analysis to reveal new (to our knowledge) details about the internal dynamics of the kinesin-5 motor domain associated with allosteric regulation and inhibition. Improved dynamic network analysis methods indicate that the γ-phosphate of a bound ATP plays a fundamental role in the coordination of switch I and switch II regions with the nucleotide itself and the P loop. In addition, the ATP state favored coupling of the microtubule-binding site with the NL. Conversely, in the ADP state the nucleotide was coordinated with loop 5, whereas the switches were dynamically dissociated and the microtubule-binding-site elements showed lower internal couplings. We also found that allosteric inhibitor binding decouples the nucleotide from the microtubule-binding site and the NL by affecting the dynamics and reducing the coupling of the residues in switch I, switch II, loop 7, and the β4-β6-β7 regions. A set of control simulations with the inhibitor instantaneously removed confirmed this result. Investigations of the dynamic coupling between nucleotide-, NL-, and microtubule-binding sites identified β4-β6-β7, loop 7, and α1-α2 as participating in the dynamic coupling of these distal functional regions. In addition, we tested in silico alanine mutations to investigate the role of potentially key residues in α1, loop 5, loop 7, β7, and loop 13 that were predicted to be involved in allosteric pathways in the wild-type structure. Among these, residue Q78/I79 (α1) and P131 (loop 5) emerge as relevant sites for the allosteric coupling between loop 5 and the NL and residue E166 (loop 7) for the nucleotide- and microtubule-binding-site coordination. These findings provide an atomic description of the allosteric communication among nucleotide-, microtubule-, and NL-binding sites in the presence of ATP, ADP, and inhibitor ligands. Our data provide structural and dynamic insights that are not available from the accumulated crystal structures, and lay the foundation for dissecting the dynamic consequences of disease-associated mutations linked to human pathologies, including neurodegeneration, tumorigenesis, and ciliopathies.
Acknowledgments
We thank Mr. Hongyang Li and Drs. Xin-Qiu Yao, Ana Grant, Steven Rosenfeld, and Robert Cross for valuable discussions.
Footnotes
This is an open access article under the CC BY-NC-ND license (http://creativecommons.org/licenses/by-nc-nd/3.0/).
Supporting Material
References
- 1.Wojcik E.J., Buckley R.S., Kim S. Kinesin-5: cross-bridging mechanism to targeted clinical therapy. Gene. 2013;531:133–149. doi: 10.1016/j.gene.2013.08.004. [DOI] [PMC free article] [PubMed] [Google Scholar]
- 2.Atherton J., Houdusse A., Moores C. MAPping out distribution routes for kinesin couriers. Biol. Cell. 2013;105:465–487. doi: 10.1111/boc.201300012. [DOI] [PubMed] [Google Scholar]
- 3.Vale R.D., Milligan R.A. The way things move: looking under the hood of molecular motor proteins. Science. 2000;288:88–95. doi: 10.1126/science.288.5463.88. [DOI] [PubMed] [Google Scholar]
- 4.Asbury C.L., Fehr A.N., Block S.M. Kinesin moves by an asymmetric hand-over-hand mechanism. Science. 2003;302:2130–2134. doi: 10.1126/science.1092985. [DOI] [PMC free article] [PubMed] [Google Scholar]
- 5.Clancy B.E., Behnke-Parks W.M., Block S.M. A universal pathway for kinesin stepping. Nat. Struct. Mol. Biol. 2011;18:1020–1027. doi: 10.1038/nsmb.2104. [DOI] [PMC free article] [PubMed] [Google Scholar]
- 6.Kikkawa M., Sablin E.P., Hirokawa N. Switch-based mechanism of kinesin motors. Nature. 2001;411:439–445. doi: 10.1038/35078000. [DOI] [PubMed] [Google Scholar]
- 7.Sindelar C.V. A seesaw model for intermolecular gating in the kinesin motor protein. Biophys Rev. 2011;3:85–100. doi: 10.1007/s12551-011-0049-4. [DOI] [PMC free article] [PubMed] [Google Scholar]
- 8.Rice S., Lin A.W., Vale R.D. A structural change in the kinesin motor protein that drives motility. Nature. 1999;402:778–784. doi: 10.1038/45483. [DOI] [PubMed] [Google Scholar]
- 9.Vale R.D., Case R., Fletterick R. Searching for kinesin’s mechanical amplifier. Philos. Trans. R. Soc. Lond. B Biol. Sci. 2000;355:449–457. doi: 10.1098/rstb.2000.0586. [DOI] [PMC free article] [PubMed] [Google Scholar]
- 10.Goulet A., Major J., Moores C.A. Comprehensive structural model of the mechanochemical cycle of a mitotic motor highlights molecular adaptations in the kinesin family. Proc. Natl. Acad. Sci. USA. 2014;111:1837–1842. doi: 10.1073/pnas.1319848111. [DOI] [PMC free article] [PubMed] [Google Scholar]
- 11.Goulet A., Behnke-Parks W.M., Moores C.A. The structural basis of force generation by the mitotic motor kinesin-5. J. Biol. Chem. 2012;287:44654–44666. doi: 10.1074/jbc.M112.404228. [DOI] [PMC free article] [PubMed] [Google Scholar]
- 12.Rosenfeld S.S., Xing J., King P.H. Docking and rolling, a model of how the mitotic motor Eg5 works. J. Biol. Chem. 2005;280:35684–35695. doi: 10.1074/jbc.M506561200. [DOI] [PubMed] [Google Scholar]
- 13.Scarabelli G., Grant B.J. Mapping the structural and dynamical features of kinesin motor domains. PLOS Comput. Biol. 2013;9:e1003329. doi: 10.1371/journal.pcbi.1003329. [DOI] [PMC free article] [PubMed] [Google Scholar]
- 14.Rice S.E. Kinesin-5 seems to step to its own unique tune, but really it’s a cover. Biophys. J. 2013;104:1846–1848. doi: 10.1016/j.bpj.2013.03.050. [DOI] [PMC free article] [PubMed] [Google Scholar]
- 15.Kim E.D., Buckley R., Kim S. Allosteric drug discrimination is coupled to mechanochemical changes in the kinesin-5 motor core. J. Biol. Chem. 2010;285:18650–18661. doi: 10.1074/jbc.M109.092072. [DOI] [PMC free article] [PubMed] [Google Scholar]
- 16.Jun B., Kim S. Real-time structural transitions are coupled to chemical steps in ATP hydrolysis by Eg5 kinesin. J. Biol. Chem. 2010;285:11073–11077. doi: 10.1074/jbc.C110.103762. [DOI] [PMC free article] [PubMed] [Google Scholar]
- 17.Behnke-Parks W.M., Vendome J., Rosenfeld S.S. Loop L5 acts as a conformational latch in the mitotic kinesin Eg5. J. Biol. Chem. 2011;286:5242–5253. doi: 10.1074/jbc.M110.192930. [DOI] [PMC free article] [PubMed] [Google Scholar]
- 18.Hesse W.R., Steiner M., Lang M.J. Modular aspects of kinesin force generation machinery. Biophys. J. 2013;104:1969–1978. doi: 10.1016/j.bpj.2013.03.051. [DOI] [PMC free article] [PubMed] [Google Scholar]
- 19.Grant B.J., Gorfe A.A., McCammon J.A. Ras conformational switching: simulating nucleotide-dependent conformational transitions with accelerated molecular dynamics. PLOS Comput. Biol. 2009;5:e1000325. doi: 10.1371/journal.pcbi.1000325. [DOI] [PMC free article] [PubMed] [Google Scholar]
- 20.Grant B.J., McCammon J.A., Gorfe A.A. Conformational selection in G-proteins: lessons from Ras and Rho. Biophys. J. 2010;99:L87–L89. doi: 10.1016/j.bpj.2010.10.020. [DOI] [PMC free article] [PubMed] [Google Scholar]
- 21.Muretta J.M., Behnke-Parks W.M., Rosenfeld S.S. Loop L5 assumes three distinct orientations during the ATPase cycle of the mitotic kinesin Eg5: a transient and time-resolved fluorescence study. J. Biol. Chem. 2013;288:34839–34849. doi: 10.1074/jbc.M113.518845. [DOI] [PMC free article] [PubMed] [Google Scholar]
- 22.Gorfe A.A., Grant B.J., McCammon J.A. Mapping the nucleotide and isoform-dependent structural and dynamical features of Ras proteins. Structure. 2008;16:885–896. doi: 10.1016/j.str.2008.03.009. [DOI] [PMC free article] [PubMed] [Google Scholar]
- 23.Yao X.Q., Grant B.J. Domain-opening and dynamic coupling in the α-subunit of heterotrimeric G proteins. Biophys. J. 2013;105:L08–L10. doi: 10.1016/j.bpj.2013.06.006. [DOI] [PMC free article] [PubMed] [Google Scholar]
- 24.Parke C.L., Wojcik E.J., Worthylake D.K. ATP hydrolysis in Eg5 kinesin involves a catalytic two-water mechanism. J. Biol. Chem. 2010;285:5859–5867. doi: 10.1074/jbc.M109.071233. [DOI] [PMC free article] [PubMed] [Google Scholar]
- 25.Turner J., Anderson R., Sakowicz R. Crystal structure of the mitotic spindle kinesin Eg5 reveals a novel conformation of the neck-linker. J. Biol. Chem. 2001;276:25496–25502. doi: 10.1074/jbc.M100395200. [DOI] [PubMed] [Google Scholar]
- 26.Talapatra S.K., Schüttelkopf A.W., Kozielski F. The structure of the ternary Eg5-ADP-ispinesib complex. Acta Crystallogr. D Biol. Crystallogr. 2012;68:1311–1319. doi: 10.1107/S0907444912027965. [DOI] [PMC free article] [PubMed] [Google Scholar]
- 27.Sali A., Blundell T.L. Comparative protein modelling by satisfaction of spatial restraints. J. Mol. Biol. 1993;234:779–815. doi: 10.1006/jmbi.1993.1626. [DOI] [PubMed] [Google Scholar]
- 28.Shen M.Y., Sali A. Statistical potential for assessment and prediction of protein structures. Protein Sci. 2006;15:2507–2524. doi: 10.1110/ps.062416606. [DOI] [PMC free article] [PubMed] [Google Scholar]
- 29.Case D.A., Darden T.A., Kollman P.A. University of California; San Francisco: 2012. AMBER 12. [Google Scholar]
- 30.Hornak V., Abel R., Simmerling C. Comparison of multiple Amber force fields and development of improved protein backbone parameters. Proteins. 2006;65:712–725. doi: 10.1002/prot.21123. [DOI] [PMC free article] [PubMed] [Google Scholar]
- 31.Meagher K.L., Redman L.T., Carlson H.A. Development of polyphosphate parameters for use with the AMBER force field. J. Comput. Chem. 2003;24:1016–1025. doi: 10.1002/jcc.10262. [DOI] [PubMed] [Google Scholar]
- 32.Wang J., Wolf R.M., Case D.A. Development and testing of a general Amber force field. J. Comput. Chem. 2004;25:1157–1174. doi: 10.1002/jcc.20035. [DOI] [PubMed] [Google Scholar]
- 33.Frisch M.J., Trucks G.W., Fox D.J. Gaussian, Inc.; Wallingford CT: 2009. Gaussian 09, Revision D.01. [Google Scholar]
- 34.Grant B.J., Rodrigues A.P., Caves L.S. Bio3d: an R package for the comparative analysis of protein structures. Bioinformatics. 2006;22:2695–2696. doi: 10.1093/bioinformatics/btl461. [DOI] [PubMed] [Google Scholar]
- 35.Lange O.F., Grubmüller H. Generalized correlation for biomolecular dynamics. Proteins. 2006;62:1053–1061. doi: 10.1002/prot.20784. [DOI] [PubMed] [Google Scholar]
- 36.Van Wart A.T., Durrant J., Amaro R.E. Weighted implementation of suboptimal paths (WISP): an optimized algorithm and tool for dynamical network analysis. J. Chem. Theory Comput. 2014;10:511–517. doi: 10.1021/ct4008603. [DOI] [PMC free article] [PubMed] [Google Scholar]
- 37.Zhang W. Exploring the intermediate states of ADP-ATP exchange: a simulation study on Eg5. J. Phys. Chem. B. 2011;115:784–795. doi: 10.1021/jp107255t. [DOI] [PubMed] [Google Scholar]
- 38.Liu H.L., Hallen M.A., Endow S.A. Altered nucleotide-microtubule coupling and increased mechanical output by a kinesin mutant. PLoS ONE. 2012;7:e47148. doi: 10.1371/journal.pone.0047148. [DOI] [PMC free article] [PubMed] [Google Scholar]
- 39.Khalil A.S., Appleyard D.C., Lang M.J. Kinesin’s cover-neck bundle folds forward to generate force. Proc. Natl. Acad. Sci. USA. 2008;105:19247–19252. doi: 10.1073/pnas.0805147105. [DOI] [PMC free article] [PubMed] [Google Scholar]
- 40.Sethi A., Eargle J., Luthey-Schulten Z. Dynamical networks in tRNA:protein complexes. Proc. Natl. Acad. Sci. USA. 2009;106:6620–6625. doi: 10.1073/pnas.0810961106. [DOI] [PMC free article] [PubMed] [Google Scholar]
- 41.Gasper P.M., Fuglestad B., McCammon J.A. Allosteric networks in thrombin distinguish procoagulant vs. anticoagulant activities. Proc. Natl. Acad. Sci. USA. 2012;109:21216–21222. doi: 10.1073/pnas.1218414109. [DOI] [PMC free article] [PubMed] [Google Scholar]
- 42.Sethi A., Tian J., Gnanakaran S. A mechanistic understanding of allosteric immune escape pathways in the HIV-1 envelope glycoprotein. PLOS Comput. Biol. 2013;9:e1003046. doi: 10.1371/journal.pcbi.1003046. [DOI] [PMC free article] [PubMed] [Google Scholar]
- 43.Case R.B., Rice S., Vale R.D. Role of the kinesin neck linker and catalytic core in microtubule-based motility. Curr. Biol. 2000;10:157–160. doi: 10.1016/s0960-9822(00)00316-x. [DOI] [PubMed] [Google Scholar]
- 44.Gilbert S.P., Johnson K.A. Pre-steady-state kinetics of the microtubule-kinesin ATPase. Biochemistry. 1994;33:1951–1960. doi: 10.1021/bi00173a044. [DOI] [PubMed] [Google Scholar]
- 45.Ma Y.Z., Taylor E.W. Mechanism of microtubule kinesin ATPase. Biochemistry. 1995;34:13242–13251. doi: 10.1021/bi00040a040. [DOI] [PubMed] [Google Scholar]
- 46.Kawaguchi K. Role of kinesin-1 in the pathogenesis of SPG10, a rare form of hereditary spastic paraplegia. Neuroscientist. 2013;19:336–344. doi: 10.1177/1073858412451655. [DOI] [PubMed] [Google Scholar]
- 47.Djagaeva I., Rose D.J., Saxton W.M. Three routes to suppression of the neurodegenerative phenotypes caused by kinesin heavy chain mutations. Genetics. 2012;192:173–183. doi: 10.1534/genetics.112.140798. [DOI] [PMC free article] [PubMed] [Google Scholar]
Associated Data
This section collects any data citations, data availability statements, or supplementary materials included in this article.