

Abstract
AIM: To assess quantitatively the relationship between fish intake and the incidence of gastrointestinal cancers in a meta-analysis of cohort studies.
METHODS: We searched MEDLINE, Embase, Science Citation Index Expanded, and the bibliographies of retrieved articles. Prospective cohort studies were included if they reported relative risks (RRs) and corresponding 95% confidence intervals (CIs) of various cancers with respect to fish intake. When RRs were not available in the published article, they were computed from the exposure distributions. Two investigators extracted the data independently and discrepancies were resolved by discussion with a third investigator. We performed random-effect meta-analyses and meta-regressions of study-specific incremental estimates to determine the risk of cancer associated with a 20-g/d increment of fish consumption.
RESULTS: Forty-two studies, comprising 27 independent cohorts, met our inclusion criteria. The studies included 2325040 participants and 24115 incident cases of gastrointestinal cancer, with an average follow-up of 13.6 years. Compared with individuals who did not eat, or seldom ate, fish, the pooled RR of gastrointestinal cancers was 0.93 (95%CI: 0.88-0.98) for regular fish consumers, 0.94 (0.89-0.99) for low to moderate fish consumers, and 0.91 (0.84-0.97) for high fish consumers. Overall, a 20-g increase in fish consumption per day was associated with a 2% reduced risk of gastrointestinal cancers (RR = 0.98; 95%CI: 0.96-1.01). In subgroup analyses, we noted that fish consumption was associated with reduced risk of colorectal (RR = 0.93; 95%CI: 0.87-0.99; P < 0.01), esophageal (RR = 0.91; 95%CI: 0.83-0.99; P < 0.05) and hepatocellular cancers (RR = 0.71; 95%CI: 0.48-0.95; P < 0.01).
CONCLUSION: This meta-analysis suggested that fish consumption may reduce total gastrointestinal cancer incidence. Inverse relationships were also detected between fish consumption and specific types of cancers.
Keywords: Diet, Cancer prevention, Fish intake, Gastrointestinal cancer
Core tip: Epidemiological studies have revealed associations between fish consumption and cancers of the gastrointestinal tract. After meta-analysis of forty-two studies, comprising 27 independent cohorts, we found that fish consumption might reduce the total incidence of gastrointestinal cancer. A 20-g increase in fish consumption per day was associated with a 2% reduced risk of gastrointestinal cancers. In subgroup analyses, fish consumption was associated with reduced risk of colorectal, esophageal and hepatocellular cancers.
INTRODUCTION
Gastrointestinal (GI) cancers are the most common types of human tumors[1], and their development has been linked to diet[2,3]. A report published in 2007 by the World Cancer Research Fund and the American Institute for Cancer Research on the relationship between diet and cancer suggested that the consumption of certain types of food may be directly associated with the development of GI cancers[4]. Epidemiological data have shown that in populations with high levels of fish consumption, such as Finnish or Swedish fisherman, the incidence and mortality rates for GI cancers are greatly reduced[5,6].
The diets of most human populations include fish. Fish is an ideal source of fatty acids, which are important components of cell membranes. Fish can also contain high levels of vitamin D and selenium, which may protect against the development of several cancers[7]. Most importantly, fish is a rich source of omega-3 fatty acids, which may protect against GI cancers through their anticarcinogenic and anti-inflammatory effects. Fatty acids regulate the production of proinflammatory prostaglandins and hydroxyeicosatetraenoic acid via the cyclooxygenase and lipoxygenase pathways[8]. These pathways play major roles in inflammation, cell proliferation and angiogenesis, each of which represents a key factor in cancer progression. Evidence from animal models and cultured cells indicates that long-chain Ω-3 polyunsaturated fatty acids (PUFAs) could inhibit the progression of cancer[9,10]. Thus, it is likely that the anti-inflammatory properties of fish are important for preventing cancer.
To date, there have been no intervention studies examining the association between fish consumption and the risk of GI cancer. Several epidemiological studies have focused on this association, but their results have been inconsistent[11-13]. Data from case-control studies can be subject to recall bias with respect to fish consumption and selection bias with respect to the control group. Prospective cohort studies that exclude these biases are more useful to identify associations between dietary fish and cancer. We therefore performed a meta-analysis of prospective cohort studies to assess quantitatively the association between fish intake and the risk of GI cancer in humans.
MATERIALS AND METHODS
Literature search
We searched the electronic databases MEDLINE (1966 to May 2013), Embase (1985 to May 2013) and the Science Citation Index Expanded (1945 to May 2013), using the Medical Subject Heading terms fish and gastrointestinal neoplasm, or esophageal neoplasm, or stomach neoplasm, or colorectal neoplasm, or hepatocellular neoplasm, or pancreatic neoplasm. We also reviewed reference lists of retrieved articles to search for additional studies. Only studies published as full-length articles in English were considered.
Inclusion and exclusion criteria
Studies were included if they: (1) had a prospective cohort design; (2) reported relative risks (RRs) or hazard ratios (HRs) and corresponding 95% confidence intervals (CIs) (or data to calculate them) of GI cancer relating to different levels of fresh fish intake; and (3) included the frequency of fish consumption. Studies were excluded if they: (1) had a case-control design; (2) analyzed the consumption of fish oil, salted fish, or fried fish, rather than fresh fish; and (3) did not include the frequency of fish consumption. If multiple published reports from a single cohort were available we included the report with the most information concerning outcome and fish consumption.
Data extraction
Two investigators (XY and JD) extracted the data independently, according to meta-analysis of observation studies in epidemiology (MOOSE) guidelines[14]. Discrepancies were resolved through discussions involving a third investigator (JZ). The following information was extracted from each study: first author’s last name, year of publication, country of origin, follow-up period, number of subjects and cases, age at baseline, GI cancer type, frequency of fish intake, outcome assessments, RRs or HRs of cancer and corresponding 95%CI for each category of fish, and covariates that were adjusted during the statistical analysis.
Statistical analysis
The measures of interest were the RRs and corresponding 95%CI for each of the included cohort studies. When RRs were not provided in the published article they were computed from exposure distributions. Different studies used different units for describing fish consumption; therefore, we converted fish consumption into g/d as a standard measure. Some studies reported consumption using qualitative scales (such as low, medium and high), or servings per month, week or day. We transformed these consumption levels into g/d by assuming that a ‘‘serving’’ corresponded to 105 g (the derived average portion size in the Health Professional Follow-Up Study). For studies that did not report CIs, we estimated these values based on the number of cases and controls in each category of exposure.
We computed summary RRs for fish consumers vs non-consumers and for different levels of consumption by assigning each study-specific RR a weight that was proportional to its precision (i.e., the inverse of the variance derived from the reported 95%CI). To estimate summary RRs for various levels of fish consumption, we first calculated study-specific estimates for low to moderate consumption and for high consumption. For various GI cancer types, we performed stratified analysis on cancer types associated with more than two cohorts.
Statistical heterogeneity among studies was estimated using Q and I2 statistics. For the Q statistic, heterogeneity was considered present for P < 0.1. We pooled study-specific estimates using both the fixed-effect model and the random-effect model (proposed by DerSimonian and Laird). When significant heterogeneity was found, results from the random-effect model were presented. A sensitivity analysis was also conducted, in which one study at a time was removed and the others analyzed. This allowed us to estimate whether the results could have been dramatically affected by a single study.
For dose-response analysis, we used the method proposed by Greenland and Greenland et al[15] to estimate study-specific slopes from the correlated natural logarithm of the RR across categories of consumed fish. For each category, the assigned dose corresponded to the midpoint between upper and lower boundaries. The highest open-ended category was assumed to have the same amplitude of consumption as the preceding category[16]. We then obtained the summary RR for GI cancer risk associated with a 20-g/d increment of consumed fish by pooling study-specific slopes, using the inverse of the corresponding variances as weights.
Finally, publication bias was evaluated through visual analysis of funnel plots and by the Begg’s and Egger’s tests. P < 0.05 was considered statistically significant. All statistical analyses were performed with STATA 9.0; (Stata Corp, College Station, TX).
RESULTS
Using the predefined search strategy we identified 37 publications that were eligible for inclusion in the meta-analysis[5,17-52] (Figure 1). These publications included 27 prospective cohort studies, 2325040 participants, and 24115 cases of GI cancer with an average follow-up of 13.6 years. Characteristics of the included studies are summarized in Table 1. For 225/247 of the reviewed publications the two investigators agreed, without discussion, whether a study was eligible for inclusion (91.1%; κ = 0.852). Of the 27 cohorts included in the meta-analysis, 10 were conducted in Europe (Denmark, France, Germany, Greece, Italy, the Netherlands, Norway, Spain, Sweden, Switzerland and the United Kingdom), nine in North America (the United States), seven in Asia (China and Japan), and one in Oceania (Australia).
Figure 1.
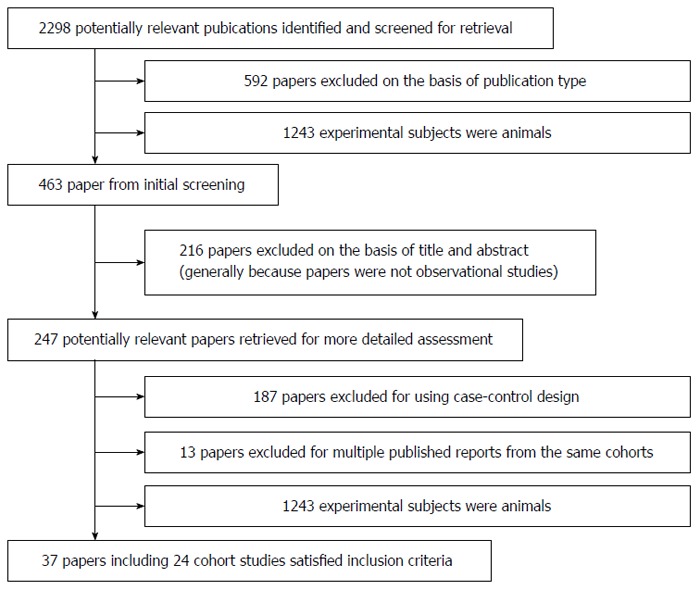
Flow diagram of search strategy and study selection.
Table 1.
Summary characteristics of studies included in the meta-analysis
| Ref. | Year | Country | Follow-up period | Study subjects | Number of cases | Cancer site | Fish consumption | Relative risk (95%CI) | Adjustments |
| Willett et al[17] | 1990 | United States | 6 yr | 88751 F | 150 F | Colon | < 1/mo | 1 | Age |
| 1-3/mo | 1.29 (0.70-2.40) | ||||||||
| 1/wk | 0.92 (0.49-1.72) | ||||||||
| 2-4/wk | 0.75 (0.35-1.58) | ||||||||
| ≥ 5/wk | 1.06 (0.36-3.12) | ||||||||
| Bostick et al[18] | 1994 | United States | 6 yr | 35215 F | 212 F | Colon | < 1 time/wk | 1 | Age, energy intake, |
| 1 time/wk | 0.73 (0.50-1.07) | height, parity, vitamin E, | |||||||
| 1.5 time/wk | 0.96 (0.65-1.42) | vitamin E*age interaction, | |||||||
| 2-2.5 time/wk | 0.83 (0.54-1.28) | vitamin A | |||||||
| > 2.5 time/wk | 0.76 (0.49-1.19) | ||||||||
| Giovannucci et al[19] | 1994 | United States | 47949 M | 205 M | Colon | 8.4 g/d | 1 | Age, | |
| 20.9 g/d | 0.85 (0.54-1.33) | total energy intake | |||||||
| 31.0 g/d | 1.05 (0.68-1.61) | ||||||||
| 47.8 g/d | 0.80 (0.51-1.26) | ||||||||
| 83.4 g/d | 1.06 (0.70-1.60) | ||||||||
| Kato et al[20] | 1997 | United States | 7.1 yr | 14727 F | 100 F | Colorectal | Q1 | 1 | Age, total energy intake, |
| Q2 | 1.01 (0.62-1.67) | education, place of | |||||||
| Q3 | 0.65 (0.37-1.13) | residence | |||||||
| Q4 | 0.49 (0.27-0.89) | ||||||||
| Hsing et al[21] | 1998 | United States | 20 yr | 17633 M | 145 M | Colorectal | < 0.8 time/mo | 1 | Age, calories, smoking, |
| 0.8-1.6 time/mo | 1.1 (0.7-1.9) | alcohol intake, | |||||||
| 1.7-4.0 time/mo | 1.2 (0.7-2.0) | total energy | |||||||
| > 4 times/mo | 1.5 (0.9-2.6) | ||||||||
| Knekt et al[22] | 1999 | Finland | 24 yr | 9985 | 73 | Colorectal | Q1 | 1 | Age, energy intake, |
| Q2 | 1.07 (0.53-2.17) | gender, municipality, | |||||||
| Q3 | 1.60 (0.81-3.16) | smoking | |||||||
| Q4 | 1.11 (0.55-2.28) | ||||||||
| Pietinen et al[5] | 1999 | Finland | 8 yr | 27111 M | 185 M | Colorectal | 13 g/d | 1 | Age, education, smoking, |
| 26 g/d | 1.1 (0.7-1.6) | BMI, alcohol, physical | |||||||
| 40 g/d | 0.8 (0.5-1.3) | activity, calcium intake | |||||||
| 68 g/d | 0.9 (0.6-1.4) | ||||||||
| Tiemersma et al[23] | 2002 | The Netherlands | 8.5 yr | 537 | 102 | Colorectal | 0-1 time/mo | 1 | Age, gender, center, total |
| 1-4 time/mo | 1.1 (0.7-1.9) | energy intake, alcohol, | |||||||
| > 4 times/mo | 0.7 (0.4-1.3) | height | |||||||
| English et al[24] | 2004 | Australia | 9 yr | 37112 | 451 | Colorectal | < 1 times/wk | 1 | Age, energy intake, |
| 1.0-1.4 times/wk | 0.9 (0.7-1.2) | country of birth, | |||||||
| 1.5-2.4 times/wk | 0.9 (0.7-1.1) | gender, fat, | |||||||
| ≥ 2.5 times/wk | 0.9 (0.7-1.2) | cereal intake | |||||||
| Kojima et al[25] | 2004 | Japan | 9.9 yr | 107824 | 457 | Colorectal | 0-2 times/wk | 1 | Age, family history, BMI, |
| 3-4 times/wk | 0.88 (0.65-1.12) | smoking, physical activity, | |||||||
| every day | 0.96 (0.71-1.16) | education, alcohol intake, | |||||||
| region | |||||||||
| Sanjoaquin et al[26] | 2004 | United Kingdom | 17 yr | 10998 | 95 | Colorectal | 0 times/wk | 1 | Age, gender, |
| 0-1 time/wk | 1.21 (0.71-2.06) | smoking, alcohol | |||||||
| ≥ 1 time/wk | 1.17 (0.71-1.92) | ||||||||
| Larsson et al[27] | 2005 | Sweden | 13.9 yr | 61433 F | 733 F | Colorectal | < 0.5 servings/wk | 1 | Age, energy, education, |
| 0.5-< 1.0 servings/wk | 0.94 (0.72-1.22) | BMI, alcohol, saturated | |||||||
| 1.0-< 2.0 servings/wk | 1.21 (0.94-1.55) | fat, calcium, fruits and vegetables, whole-grain | |||||||
| ≥ 2 servings/wk | 1.08 (0.81-1.43) | foods, red meat, poultry | |||||||
| Lüchtenborg et al[28] | 2005 | The Netherlands | 5 yr | 2948 | 588 | Colorectal | 0 g/d | 1 | Age, energy intake, |
| 4.6 g/d | 1.13 (0.84-1.41) | gender, family history | |||||||
| 15.2 g/d | 0.86(0.65-1.06) | of colorectal cancer, | |||||||
| 29.4 g/d | 1.00 (0.74-1.27) | smoking, BMI | |||||||
| Norat et al[29] | 2005 | 10 European | 4.8 yr | 478040 | 1329 | Colorectal | < 10 g/d | 1 | Age, energy intake, |
| countries | 10-20 g/d | 0.88 (0.74-1.06) | gender, height, weight, | ||||||
| 20-40 g/d | 0.86 (0.72-1.02) | occupational physical | |||||||
| ≥ 80 g/d | 0.69 (0.54-0.88) | dietary fiber, alcohol, center | |||||||
| Engeset et al[30] | 2007 | Norway | 8 yr | 63914 F | 254 F | Colon | < 70.8 g/d | 1 | Age, daily intake of |
| 70.8-117 g/d | 0.93 (0.66-1.31) | energy, smoking, fish | |||||||
| > 117 g/d | 1.28 (0.90-1.81) | liver, fruit and vegetables, | |||||||
| fiber, fats, sauces | |||||||||
| Hall et al[31] | 2008 | United States | 22 yr | 21406 M | 500 M | Colorectal | < 1 time/wk | 1 | Age, smoking, BMI, |
| 1-< 2 time/wk | 0.88 (0.65-1.20) | multivitamin use, history | |||||||
| 2-< 5 time/wk | 0.82 (0.61-1.10) | of diabetes, random | |||||||
| ≥ 5 times/wk | 0.63 (0.42-0.95) | assignment to aspirin or | |||||||
| placebo, vigorous exercise, | |||||||||
| alcohol, red meat intake | |||||||||
| Lee et al[32] | 2009 | China | 7.4 yr | 73224 F | 394 F | Colorectal | < 20 g/d | 1 | Age, education, income, |
| < 33 g/d | 1.2 (0.9-1.5) | survey season, tea | |||||||
| < 49 g/d | 1.2 (0.8-1.6) | consumption, NSAID | |||||||
| < 74 g/d | 1.5 (1.1-1.9) | use, energy intake, | |||||||
| ≥ 74 g/d | 1.3 (0.9-1.9) | fiber intake | |||||||
| Sugawara et al[33] | 2009 | Japan | 8 yr | 39498 | 566 | Colorectal | 0-26.2 g/d | 1 | Age, BMI, family history |
| 26.3-53.3 g/d | 1.04 (0.79-1.39) | of cancer, history of | |||||||
| 53.4-96.3 g/d | 1.11 (0.81-1.53) | stroke, hypertension, | |||||||
| ≥ 96.4 g/d | 1.07 (0.78-1.46) | myocardial infarction | |||||||
| and diabetes mellitus, | |||||||||
| education, marital | |||||||||
| status, job status, | |||||||||
| smoking, alcohol, time | |||||||||
| spent walking, total | |||||||||
| calories, fruit and | |||||||||
| vegetables | |||||||||
| Spencer et al[34] | 2010 | United Kingdom | 2575 | 579 | Colorectal | < 1 g/d | 1 | Age, height, weight, | |
| 1 < 15 g/d | 0.89 (0.71-1.08) | smoking, energy, | |||||||
| 15 < 30 g/d | 1.10 (0.90-1.30) | alcohol, dietary fiber | |||||||
| ≥ 30 g/d | 0.78 (0.62-0.95) | ||||||||
| Daniel et al[35] | 2011 | United States | 9 yr | 492186 | 6979 | Colorectal | 3.6 g/1000 kcal | 1 | Red meat intake, age, sex, |
| 7.0 g/1000 kcal | 0.97 (0.90-1.04) | education, marital status, | |||||||
| 9.9 g/1000 kcal | 0.92 (0.85-0.99) | family history of cancer, | |||||||
| 13.4 g/1000 kcal | 0.93 (0.86-1.00) | race, BMI, smoking status, | |||||||
| 21.4 g/1000 kcal | 0.95 (0.88-1.03) | frequency of vigorous physical activity, | |||||||
| MHT in women, intake of alcohol, | |||||||||
| fruit, vegetables, and total energy | |||||||||
| Nomura et al[36] | 1990 | United States | 19 yr | 7990 M | 150 | Gastric | ≤ 1 time/wk | 1 | Age |
| 2-4 times/wk | 1.4 (1.0-1.9) | ||||||||
| ≥ 5 times/wk | 0.9 (0.5-1.8) | ||||||||
| Ngoan et al[37] | 2002 | Japan | 10.5 yr | 13250 | 116 | Gastric | ≤ 2-4 times/mo | 1 | Sex, age, smoking |
| 2-4 times/wk | 0.90 (0.40-2.20) | smoking, processed meat, liver, | |||||||
| ≥ 1 time/d | 0.90 (0.30-2.10) | cooking or salad oil, suimono, pickled food | |||||||
| Sauvaget et al[38] | 2005 | Japan | 20 yr | 38576 | 1270 | Gastric | > 2 times/wk | 1 | Sex, sex-specific age, |
| 2-4 times/wk | 1.09 (0.96-1.23) | city, radiation dose, | |||||||
| ≥ 5 times/wk | 1.16 (0.97-1.39) | sex-specific smoking habits, | |||||||
| education level | |||||||||
| Tokui et al[39] | 2005 | Japan | 11 yr | 110792 | 859 | Gastric | ≤ 1-2 times/mo | 1 | Age |
| 1-2 times/wk | 0.85 (0.61-1.19) | ||||||||
| 3-4 times/wk | 0.90 (0.65-1.26) | ||||||||
| ≥ 1 time/d | 0.95 (0.68-1.33) | ||||||||
| Larsson et al[40] | 2006 | Sweden | 18 yr | 61433 | 156 | Gastric | < 1.2 servings/wk | 1 | Age, education, |
| 1.2-1.9 servings/wk | 0.97 (0.64-1.46) | body mass index, | |||||||
| ≥ 5 servings/wk | 1.14 (0.75-1.72) | intake of total energy, | |||||||
| alcohol, fruits and vegetables | |||||||||
| Zheng et al[41] | 1993 | United States | 20 yr | 17633 M | 57 | Pancreatic | Q1 | 1 | Age, smoking index, |
| Q2 | 1.2 (0.5-3.0) | alcohol index, total calories | |||||||
| Q3 | 2.0 (0.8-4.7) | ||||||||
| Q4 | 1.4 (0.6-3.7) | ||||||||
| Stolzenberg- Solomon et al[42] | 2002 | Finland | 13 yr | 27111 M | 163 M | Pancreatic | ≤ 17.9 g/d | 1 | Energy intake, |
| > 17.9 and ≤ 27.7 g/d | 1.22 (0.75-1.97) | age and years of smoking | |||||||
| > 27.7 and ≤ 38.6 g/d | 1.14 (0.70-1.86) | ||||||||
| > 38.6 and ≤ 55.8 g/d | 1.07 (0.65-1.76) | ||||||||
| > 55.8 g/d | 0.91 (0.54-1.52) | ||||||||
| Michaud et al[43] | 2003 | United States | 18 yr | 88802 F | 178 FM | Pancreatic | < 4/mo | 1 | pack-years of smoking, BMI, |
| 1/wk | 1.42 (1.01-1.98) | history of diabetes mellitus, | |||||||
| ≥ 2/wk | 1.30 (0.86-1.98) | caloric intake, height, | |||||||
| physical activity, menopausal status | |||||||||
| Nöthlings et al[44] | 2005 | United States | 7 yr | 190545 | 482 | Pancreatic | 1.1 | 1 | Age, ethnicity, |
| 3.8 | 0.85 (0.70-1.03) | history of diabetes mellitus, | |||||||
| 6.4 | 0.84 (0.69-1.03) | familial history of pancreatic cancer, | |||||||
| 9.8 | 0.90 (0.74-1.10) | smoking status, energy intake | |||||||
| 17.3 | 0.91 (0.75-1.11) | ||||||||
| Larsson et al[45] | 2006 | Sweden | 17 yr | 61433 F | 172 | Pancreatic | ≤ 1.0 servings/wk | 1 | Age, education, |
| 1.1 < 1.5 servings/wk | 0.88 (0.58-1.34) | BMI, smoking, | |||||||
| 1.5 < 2.0 servings/wk | 1.52 (0.96-2.40) | intakes of total energy, | |||||||
| ≥ 2.0 servings/wk | 1.22 (0.77-1.92) | alcohol, energy-adjusted folate | |||||||
| Lin et al[46] | 2006 | Japan | 11 yr | 110792 | 300 | Pancreatic | 0-2/mo | 1 | Age, area, |
| 1-4/wk | 1.21 (0.60-1.81) | pack-years of smoking | |||||||
| Almost every day | 0.98 (0.43-1.53) | ||||||||
| Heinen et al[47] | 2009 | Netherlands | 13.3 yr | 120852 | 350 | Pancreatic | 0 | 1 | Gender, age, energy, smoking, |
| 0-10 g/d | 1.22 (0.89-1.67) | alcohol, history of diabetes mellitus, | |||||||
| 10-20 g/d | 1.02 (0.75-1.38) | history of hypertension, BMI, | |||||||
| ≥ 20 g/d | 1.05 (0.75-1.47) | vegetables, fruit | |||||||
| Rohrmann et al[48] | 2012 | 10 European | 16 yr | 477202 | 865 | Pancreatic | 0 to <10 g/d | 1 | Height, weight, |
| countries | 10 to < 20 g/d | 1.13 (0.90-1.41) | physical activity index, | ||||||
| 20 to <40 g/d | 1.20 (0.97-1.50) | cigarette smoking, education, | |||||||
| ≥ 40 g/d | 1.16 (0.92-1.47) | history of diabetes, total energy intake | |||||||
| Kinjo et al[50] | 1998 | Japan | 15 yr | 220272 | 440 | Esophageal | 1-3 times/mo or less | 1 | Age, prefecture, |
| 1-3 times/wk or less | 0.9 (0.7-1.1) | occupation, sex | |||||||
| 4 times/wk or more | 1.1 (0.9-1.3) | ||||||||
| Kjaerheim et al[49] | 1998 | Norway | 24 yr | 10960 M | 71 M | Esophageal | < monthly | 1 | Age, smoking level, |
| 1-5 times/mo | 0.73 (0.18-1.28) | frequency of alcohol consumption, | |||||||
| ≥ 6 times/mo | 0.96 (0.15-1.77) | ||||||||
| Kurozawa et al[51] | 2004 | Japan | 12 yr | 110792 | 401 | Liver | ≤ 1-2 times/wk | 1 | Age, gender |
| 3-4 times/wk | 0.34 (0.13-0.55) | ||||||||
| Almost every day | 0.46 (0.16-0.76) | ||||||||
| Sawada et al[52] | 2012 | Japan | 11.2 yr | 90296 | 398 | Liver | 35.0 g/d | 1 | Age, area, sex, smoking status, |
| 60.6 g/d | 0.83 (0.59-1.17) | alcohol frequency, body mass index, | |||||||
| 82.8 g/d | 0.84 (0.59-1.20) | past history of diabetes mellitus, | |||||||
| 109.9 g/d | 0.75 (0.51-1.11) | and intake of coffee, soy foods, vegetables, | |||||||
| 160.6 g/d | 0.64 (0.41-1.02) | vegetable oil, protein, and iron |
The estimated RRs of various GI cancers for fish consumers compared with non/low consumers was 0.93 (95%CI: 0.88-0.98) (Figure 2). There was significant heterogeneity between studies (Q = 80.14; P < 0.001; I2 = 67.6%). For low to moderate fish consumption, the summary RR was 0.94 (95%CI: 0.89-0.99) (Figure 3), with significant heterogeneity between studies (Q = 50.29; P < 0.003; I2 = 48.3%). For high fish consumption, the summary RR was 0.91 (95%CI: 0.84-0.97) (Figure 4), also with significant heterogeneity between studies (Q = 70.27; P < 0.001; I2 = 63.0%).
Figure 2.
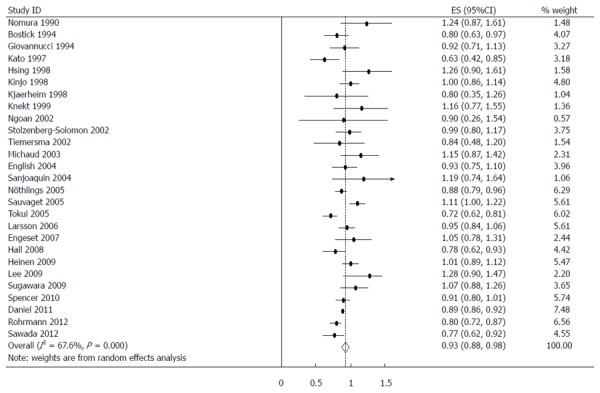
Summary relative risks of gastrointestinal cancer for fish consumers vs non/lowest consumers from all included studies. Squares represent study-specific relative risk estimates (size of the square reflects the study-specific statistical weight; i.e., the inverse of the variance); horizontal lines represent 95%CI; diamonds represent summary relative risk estimates with corresponding 95%CI.
Figure 3.
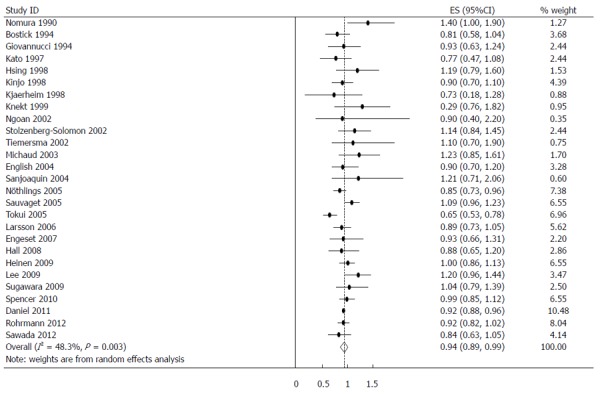
Summary relative risks of gastrointestinal cancer for low to moderate fish consumers vs non/lowest consumers from included studies. Squares represent study-specific relative risk estimates (size of the square reflects the study-specific statistical weight; i.e., the inverse of the variance); horizontal lines represent 95%CI; diamonds represent summary relative risk estimates with corresponding 95%CI.
Figure 4.
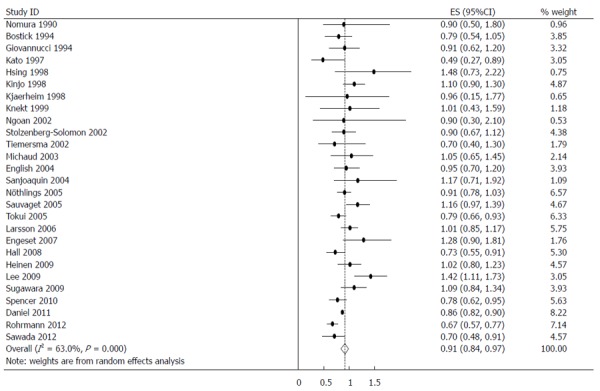
Summary relative risks of gastrointestinal cancer for high fish consumers vs non/lowest consumers from the included studies. Squares represent study-specific relative risk estimates (size of the square reflects the study-specific statistical weight; i.e., the inverse of the variance); horizontal lines represent 95%CI; diamonds represent summary relative risk estimates with corresponding 95%CI.
Sources of heterogeneity likely included international differences in fish consumption (e.g., fish type, serving size or cooking methods). To examine the magnitude of the combined RR in each stratum and its respective test of heterogeneity, we conducted subgroup analyses by gender, GI cancer sites, and geographical regions. The summary RR was 0.95 (95%CI: 0.87-1.02) for men and 0.96 (95%CI: 0.89-1.03) for women when all studies were combined. There was significant heterogeneity for men (Q = 13.97; P = 0.082; I2 = 42.8%) and women (Q = 27.60; P = 0.001; I2 = 71.0%).
When stratified by GI cancer sites, fish consumption was inversely associated with colorectal 0.93 (0.87-0.99) (Figure 5), colon 0.95 (0.91-0.98), rectal 0.85 (0.75-0.95), esophageal 0.91 (0.83-0.99) and hepatocellular 0.71 (0.48-0.95) cancers. There was no association with stomach and pancreatic cancer. The summary RR for an increment of 20 g of fish per day was 0.98 (95%CI: 0.96-1.01) for all studies combined. Pooled RRs for various GI cancer sites and an increment of 20 g/d of fish consumption (along with their heterogeneity) are listed in Table 2.
Figure 5.
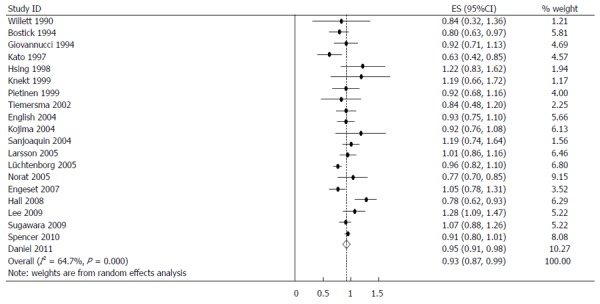
Summary relative risks of colorectal cancer for fish consumers vs non/lowest consumers from the included studies. Squares represent study-specific relative risk estimates (size of the square reflects the study-specific statistical weight; i.e., the inverse of the variance); horizontal lines represent 95%CI; diamonds represent summary relative risk estimates with corresponding 95%CI.
Table 2.
Summary relative risk for various cancer sites or different geographical regions and incremental estimates for 20-g/d increment of fish consumption
| Cancer sites regions | Corresponding RR (95%CI) for cancer |
Heterogeneity test |
RR for 20 g/d Increment of fish | |||
| Q value | P value | I2 (%) | ||||
| Total | 0.93 (0.88-0.98) | 80.14 | 0.000 | 67.6 | 0.98 (0.96-1.01) | |
| Total male | 0.95 (0.87-1.02) | 13.97 | 0.082 | 42.8 | ||
| Total female | 0.96 (0.89-1.03) | 27.60 | 0.001 | 71.0 | ||
| Low consumption | 0.94 (0.89-0.99) | 50.29 | 0.003 | 48.3 | ||
| High consumption | 0.91 (0.84-0.97) | 70.27 | 0.000 | 63.0 | ||
| Colorectum | Total | 0.93 (0.87-0.99) | 53.85 | 0.000 | 64.7 | 0.99 (0.97-1.01) |
| Low consumption | 0.95 (0.91-0.98) | 13.12 | 0.832 | 0.0 | ||
| High consumption | 0.91 (0.82-0.99) | 55.50 | 0.000 | 65.8 | ||
| Colon | Total | 0.95 (0.91-0.98) | 10.53 | 0.160 | 33.5 | |
| Low consumption | 0.97 (0.92-1.02) | 3.15 | 0.871 | 0.0 | ||
| High consumption | 0.90 (0.81-0.99) | 12.65 | 0.081 | 44.7 | ||
| Rectum | Total | 0.85 (0.75-0.95) | 16.66 | 0.020 | 58.0 | |
| Low consumption | 0.86 (0.80-0.93) | 3.32 | 0.853 | 0.0 | ||
| High consumption | 0.85 (0.70-0.99) | 17.53 | 0.014 | 60.1 | ||
| Esophagus | Total | 0.91 (0.83-0.99) | 2.43 | 0.297 | 17.6 | |
| Low consumption | 0.90 (0.79-1.02) | 0.43 | 0.807 | 0.0 | ||
| High consumption | 0.95 (0.73-1.17) | 4.71 | 0.095 | 57.5 | ||
| Stomach | Total | 1.04 (0.97-1.10) | 5.94 | 0.430 | 0.0 | 1.03 (1.00-1.05) |
| Low consumption | 1.02 (0.94-1.11) | 6.75 | 0.344 | 11.1 | ||
| High consumption | 1.06 (0.96-1.17) | 3.06 | 0.802 | 0.0 | ||
| Liver | Total | 0.71 (0.38-1.03) | 29.04 | 0.000 | 93.1 | 0.89 (0.84-0.94) |
| Low consumption | 0.73 (0.34-1.13) | 23.75 | 0.000 | 91.6 | ||
| High consumption | 0.71 (0.48-0.95) | 6.60 | 0.037 | 69.7 | ||
| Pancreas | Total | 1.07 (0.96-1.17) | 19.49 | 0.012 | 59.0 | 1.02 (0.96-1.08) |
| Low consumption | 1.05 (0.93-1.17) | 15.38 | 0.052 | 48.0 | ||
| High consumption | 1.04 (0.96-1.11) | 8.73 | 0.366 | 8.4 | ||
| Asia | 0.98 (0.81-1.15) | 49.49 | 0.000 | 87.9 | ||
| Europe | 0.94 (0.86-1.01) | 16.86 | 0.051 | 46.6 | ||
| North America | 0.88 (0.81-0.97) | 19.73 | 0.011 | 59.5 | ||
Associations were similar for studies from North America, but not from Europe and the Asia-Pacific region. The RR was 0.88 (95%CI: 0.81-0.97) when considering nine North American studies, 0.94 (95%CI: 0.86-1.01) for 10 European studies, and 0.98 (95%CI: 0.81-1.15) for seven Asian studies. No significant differences by sex and cancer-type were found.
There was no indication of publication bias from either visualization of the funnel plot or Egger’s (P = 0.287) and Begg’s (P = 0.404) (Figure 6) tests. A sensitivity analysis, in which one study was removed at a time, confirmed the stability of our results.
Figure 6.
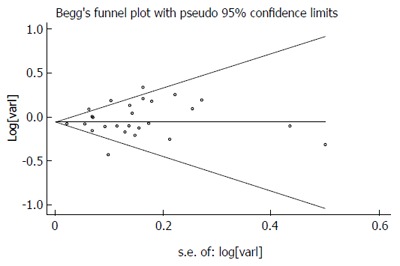
Publication bias in the studies. Begg’s funnel plot indicating no publication bias in the studies included in this meta-analysis. No indication of publication bias was noted from either visualization of the funnel plot or from Egger’s test.
DISCUSSION
Dietary fish can potentially affect the etiology of GI cancers through its effect on multiple biological pathways, including carcinogenesis and apoptosis. For most types of GI cancer, there is significant evidence that the consumption of up to 100 g of fish per day does not elevate cancer occurrence. Through the meta-analysis of cohort studies, we found that regular fish consumers had lower levels of GI cancer than individuals who did not eat or seldom ate fish. This was particularly true for high consumers. Overall, increasing fish consumption by 20 g/d was associated with a 2% reduction in the risk of developing a GI cancer. This suggested that fish intake may reduce GI cancer occurrence in humans.
In addition to vitamin D and selenium, fish is a rich source of PUFAs, which may protect against the development of GI cancers. Omega-3 (Ω-3) PUFAs are essential fatty acids necessary for human health. Studies in human populations have linked high consumption of fish or fish oil to reduced risk of colon, prostate and breast cancer. A number of biological effects that could contribute to cancer suppression by Ω-3 PUFAs have been suggested[53,54]. These effects include alterations in the proliferation, invasion, metastasis and apoptosis of cancer cells.
The most widely studied effects of PUFAs are those that relate to eicosanoid biosynthesis and function. Dietary Ω-3 PUFAs can be metabolized to prostaglandins, thromboxanes, hydroxyeicosatetraenoic acids and leukotrienes, by the enzymatic activity of COXs and LOXs[55]. Besides eicosanoids, marine Ω-3 PUFAs can also be metabolized to resolvins and protectins. These compounds possess potent anti-inflammatory and immunoregulatory actions[56]. Mounting evidence suggests that inflammation plays a critical role in the development of human cancer[57,58]. Therefore, one of the possible mechanisms for inhibition of tumors by Ω-3 PUFAs is by suppression of inflammation through resolvins.
A number of signaling pathways that are relevant to carcinogenesis and tumor progression are differentially affected by Ω-3 PUFAs. For instance, Ω-3 PUFA products were reported to downregulate and inactivate cellular signaling mediators, including ras, protein kinase C, ERK 1/2[59] and nuclear factor-κB (NF-κB)[60]. Changes in lipid composition of the plasma membrane may affect membrane fluidity and the way growth factors, cytokines and hormones interact with their receptors, and the resulting signal transduction through secondary messengers[61]. A second type of mechanism through which Ω-3 fatty acids may alter cellular signaling is by acting directly as ligands for nuclear receptors, including peroxisome proliferators-activated receptors[62] or retinoid X receptor alpha[63]. Ω-3 PUFAs may also regulate the translation machinery. Eicosapentaenoic acid (EPA) has been reported to affect intracellular homeostasis and inhibit translation initiation, and to preferentially downregulate oncogenes and G1 cyclins[64].
Colorectal cancer (CRC) is a worldwide problem, with an annual incidence of 1 million cases and an annual mortality of more than 500000 cases[65]. Although some studies have demonstrated an inverse relationship between fish consumption and colorectal cancer[20,29], others have not found a clear association[5]. A meta-analysis of prospective cohort studies on colorectal cancer and fish consumption was completed and published in 2007[66]. This analysis revealed an inverse association between the highest levels of fish consumption and the risk of colorectal cancer, although the association was only borderline statistically significant. The pooled RR for the highest compared with the lowest fish consumption category was 0.88 (95%CI: 0.78-1.00) for colorectal cancer incidence (14 studies). A more recent meta-analysis of 22 cohort and 19 case-control studies found that fish intake decreases the risk of colorectal cancer by 12%. The pooled odds ratios of colorectal cancer for the highest vs lowest fish consumption in the case-control and cohort studies were 0.83 (95%CI: 0.72-0.95) and 0.93 (95%CI: 0.86-1.01), respectively[67]. Our meta-analysis of 20 prospective cohort studies revealed a more significant association between fish intake and colorectal cancer risk abatement (summary RR = 0.93; 95%CI: 0.87-0.99).
Despite the fact that colon and rectal cancers share many features and are often referred to as “colorectal cancer”, these cancer types typically exhibit different characteristics[68]. We therefore investigated associations between fish consumption and colon or rectal cancer. In 12 studies involving colon cancer, fish intake slightly reduced the risk of colon cancer (summary RR = 0.95; 95%CI: 0.91-0.98). In eight studies involving rectal cancer, a significant decrease was found between fish consumption and the risk of rectal cancer (summary RR = 0.85; 95%CI: 0.75-0.95). The different characteristics of colon and rectal cancers may explain why fish consumption more effectively protected against rectal cancer. For example, colon cancers are generally molecularly heterogeneous, whereas rectal cancers tend to arise through a single neoplastic pathway[68]. Further analysis is required to determine the mechanisms underlying the difference in how these two cancer types are affected by fish consumption.
Over the past few decades, gastric cancer mortality has dropped significantly, but it remains a disease with a poor prognosis and high mortality. Among participants in the Japan Collaborative Cohort Study, there was no association was seen between fish intake and the risk of stomach cancer[39]. A meta-analysis of two cohort and 15 case-control studies found no association between fish consumption and the risk of gastric cancer, whether these studies were evaluated together or individually[69]. Our meta-analysis, which included seven cohort studies, also suggested no significant association between fish intake and gastric cancer. However, an increment of 20 g/d of fish influenced the risk of gastric cancer, although the association was only borderline statistically significant. The summary RR was 1.03 (95%CI: 1.00-1.05).
Our current meta-analysis only analyzed data concerning fresh fish consumption, thereby avoiding confounding factors such as fish oil, salted fish or fried fish. However, in the overwhelming majority of cases we could not determine the exact kind of fish consumed or the manner in which the fish was prepared. Although there is no conclusive evidence concerning the association between processed fish consumption and the risk of gastric cancer, many epidemiological studies and reviews have found associations between the consumption of highly salted foods and the risk of gastric cancer[70,71]. This may be because highly salted foods, such as salted or smoked fish products, can contain chemical carcinogens. These carcinogens include nitrites and their related compounds, and heterocyclic amines, which have been detected in fish or meat cooked at high temperatures[22,72]. In addition, 2-chloro-4-methylthiobutanoic acid, which is a mutagen found in salted fish, may be associated with gastric carcinogenesis[73].
Since the World Cancer Research Fund/American Institute for Cancer Research report, Lin et al[46] studied the association between fish consumption and the risk of pancreatic cancer in a large population-based cohort study in Japan and concluded that fish intake does not decrease the risk of pancreatic cancer. Preliminary results from the Nurses Health Study suggest no inverse association between fish intake and the risk of pancreatic cancer[43]. Our pooled analysis of nine cohort studies also revealed no association between fish consumption and the risk of pancreatic cancer.
Most of the studies reporting the associations of fish intake with risk of pancreatic cancer were primarily designed to study either the effect of meat or dietary fat consumption. Thus, they focused on total fish rather than different species of fish or different preparation methods. This limitation might contribute to the null findings in the primary studies and this meta-analysis. Fish can be served in many ways, such as fresh, broiled, baked, salted or fried. Fish preparation methods may alter the relation between fish intake and pancreatic cancer by changing the lipid profile and by generating unexpected chemicals with the use of certain cooking methods. Frying was found to considerably reduce the amount of LC-PUFA in fish. Deep-frying could generate trans-fatty acids, oxidized lipids, or food mutagens, such as heterocyclic amines and benzo(a)pyrene, which may promote carcinogenesis and which is associated with elevated pancreatic cancer risk[74,75].
Some study indicated that raw fish intake significantly reduced the risk of pancreatic cancer[76]. Norell et al[77] found that fried/grilled fish consumption may attenuate or cancel the potential benefit of fish consumption on pancreatic cancer risk. In a cohort study, researchers conducted a relative thorough separate analysis on both fish preparation methods and fish types[78]. Their results suggested that non-fried fish, but not total fish, intake was inversely associated with incident pancreatic cancer. It might be speculated that mixing all fish species and preparation methods may have masked the potential inverse association of fish intake with pancreatic cancer risk. An extensive analysis of fish species and preparation method with pancreatic cancer risk is needed in the future.
A recent prospective study showed an inverse association between the consumption of white meat, which included fish, and liver cancer[79]. Inverse associations between the consumption of white meat or fish and liver cancer have been observed in some studies[80,81], but not confirmed in others[82,83]. Sawada et al[52] investigated the association between fish and Ω-3 PUFA consumption and the incidence of hepatocellular carcinoma (HCC) in a population-based prospective cohort study of 90296 Japanese subjects. They found that consumption of Ω-3 PUFA-rich fish or Ω-3 PUFAs, particularly EPA, docosapentaenoic acid, and docosahexaenoic acid, appears to protect against the development of HCC, even among subjects with HBV and/or HCV infection. Although our meta-analysis did not confirm the findings of Sawada et al[52], we observed a 29% reduction in the risk of liver cancer among high consumers of fish.
In clinical trials, dietary supplementation with Ω-3 PUFAs for 1-3 mo was associated with a decreased release of interleukin-1 and -6[84,85]. Given that HCC is an inflammation-related cancer that has a background of chronic inflammation, triggered by exposure to hepatitis virus infection or toxic compounds, such as ethanol[86,87], the anti-inflammatory properties of Ω-3 PUFAs might decrease the risk of HCC. Here, we showed that the risk of HCC was decreased with greater consumption of fish. The intake of Ω-3 PUFA-rich fish may reduce the risk of HCC through the anti-inflammatory effects of Ω-3 PUFAs on chronic hepatitis.
Some limitations concerning our current meta-analysis should be acknowledged. First, as in all observational studies of diet and disease, the possibility of bias and confounding factors cannot be excluded. For example, some subjects may have modified their fish eating habits after the baseline assessment. However, cohort studies, which are less susceptible to bias because of their prospective design, also showed an inverse association between fish consumption and the risk of GI cancers, suggesting that this central finding is not likely attributable to recall and selection bias. Individual studies may have failed to adjust for known and unknown confounding factors. Second, the methods and units of measuring fish intake varied across studies. In some studies, the definitive volumes of fish consumption were not clearly defined and only the lowest and highest categories were reported. Statistical tests showed heterogeneity among studies; therefore, we used the random-effects model, which considers both within- and between-study variation, for pooled RR estimates and dose-response analyses. Third, we used fresh fish as an inclusion criterion to avoid confounding factors associated with fish oil, salted fish and fried fish. Despite this effort, we could not determine the exact kind of fish consumed or the manner in which the fish was prepared. This represents a limitation to our analysis, because a recent article showed that cooking temperature may affect the risk of colorectal cancer[88]. Fourth, we extracted risk estimates that reflected the greatest degree of control for potential confounders. Results based on adjustments for specific confounders were likely different from those based on standard adjustments. Finally, we included only studies published in English. This is because it is difficult for the authors to interpret data presented in different languages. Therefore, publication bias may have occurred, although such bias was not indicated from visualization of the funnel plot and Egger’s test.
In our meta-analysis of 27 prospective cohort studies, fish intake was not associated with harmful effects. Instead, fish consumption may reduce total incidence of GI cancer. Specific inverse associations were detected between fish consumption and colorectal, esophageal and hepatocellular cancers.
COMMENTS
Background
Gastrointestinal cancers are the most common types of human tumors and their development has been linked to diet. A report published by the World Cancer Research Fund and the American Institute for Cancer Research suggested that the consumption of certain types of food may be directly associated with the development of gastrointestinal cancers. Epidemiological data have shown that in populations with high levels of fish consumption, the incidence and mortality rates for gastrointestinal cancers are greatly reduced. However, a comprehensive analysis of this epidemiological evidence has not been performed.
Research frontiers
Fish is an ideal source of fatty acids, which are important components of cell membranes. Fish can also contain high levels of vitamin D and selenium, which may protect against the development of several cancers. Most importantly, fish is a rich source of omega-3 (Ω-3) fatty acids, which may protect against GI cancers through anticarcinogenic and anti-inflammatory effects. Fatty acids regulate the production of proinflammatory prostaglandins and hydroxyeicosatetraenoic acid via the cyclooxygenase and lipoxygenase pathways. These pathways play major roles in inflammation, cell proliferation, and angiogenesis, each of which represents a key factor in cancer progression.
Related publications
A meta-analysis of prospective cohort studies on colorectal cancer and fish consumption was completed and published in 2007. This analysis revealed an inverse association between the highest levels of fish consumption and the risk of colorectal cancer. The pooled RR for the highest compared with the lowest fish consumption category was 0.88 (95%CI: 0.78-1.00) for colorectal cancer incidence. A more recent meta-analysis of 22 cohort and 19 case-control studies found that fish intake decreases the risk of colorectal cancer by 12%. The pooled odds ratios of colorectal cancer for the highest vs lowest fish consumption in the case-control and cohort studies were 0.83 (95%CI: 0.72-0.95) and 0.93 (95%CI: 0.86-1.01), respectively.
Innovations and breakthroughs
This meta-analysis presents epidemiological evidence for the relationship between fish intake and risk of digestive cancers. We observed an inverse association between fish intake and the risk of digestive cancers. A 20-g increase in fish consumption per day was associated with a 2% reduced risk of gastrointestinal cancers. In subgroup analyses, fish consumption was associated with reduced risk of colorectal, esophageal and hepatocellular cancers. More investigations are needed to determine the biological mechanism of the inverse relationship between fish intake and the incidence of digestive cancers.
Applications
The study results suggest an inverse association between fish intake and the risk of digestive cancers. High fish intake may decrease the risk of colorectal, esophageal and hepatocellular cancers. Increasing fish intake could prevent gastrointestinal cancers.
Terminology
Long-chain Ω-3 polyunsaturated fatty acids (PUFAs) are essential fatty acids necessary for human health. They may protect against cancers through anticarcinogenic and anti-inflammatory effects. PUFAs regulate the production of proinflammatory prostaglandins and hydroxyeicosatetraenoic acid via the cyclooxygenase and lipoxygenase pathways. These pathways play major roles in inflammation, cell proliferation and angiogenesis, each of which represent key factors in cancer progression.
Peer review
This review presents a meta-analysis of prospective cohort studies on the association between fish consumption and the risk of gastrointestinal cancers. The authors conclude that fish intake may reduce gastrointestinal cancer incidence. This is an interesting and well written review, on an important topic. The data presented confirm and significantly extend the data already published.
Footnotes
Supported by National Natural Science Foundation of China, No. 81101617
P- Reviewer: Akbulut S, Grundmann O, Khatib M, Pulliero A, Swierczynski JT S- Editor: Ma YJ L- Editor: Stewart G E- Editor: Liu XM
References
- 1.Jemal A, Siegel R, Ward E, Hao Y, Xu J, Thun MJ. Cancer statistics, 2009. CA Cancer J Clin. 2009;59:225–249. doi: 10.3322/caac.20006. [DOI] [PubMed] [Google Scholar]
- 2.Key TJ, Schatzkin A, Willett WC, Allen NE, Spencer EA, Travis RC. Diet, nutrition and the prevention of cancer. Public Health Nutr. 2004;7:187–200. doi: 10.1079/phn2003588. [DOI] [PubMed] [Google Scholar]
- 3.Gonzalez CA. Nutrition and cancer: the current epidemiological evidence. Br J Nutr. 2006;96 Suppl 1:S42–S45. doi: 10.1079/bjn20061699. [DOI] [PubMed] [Google Scholar]
- 4.Wiseman M. The second World Cancer Research Fund/American Institute for Cancer Research expert report. Food, nutrition, physical activity, and the prevention of cancer: a global perspective. Proc Nutr Soc. 2008;67:253–256. doi: 10.1017/S002966510800712X. [DOI] [PubMed] [Google Scholar]
- 5.Pietinen P, Malila N, Virtanen M, Hartman TJ, Tangrea JA, Albanes D, Virtamo J. Diet and risk of colorectal cancer in a cohort of Finnish men. Cancer Causes Control. 1999;10:387–396. doi: 10.1023/a:1008962219408. [DOI] [PubMed] [Google Scholar]
- 6.Mikoczy Z, Rylander L. Mortality and cancer incidence in cohorts of Swedish fishermen and fishermen’s wives: updated findings. Chemosphere. 2009;74:938–943. doi: 10.1016/j.chemosphere.2008.10.006. [DOI] [PubMed] [Google Scholar]
- 7.World Cancer Research Fund/American Institute for Cancer Research. Food, Nutrition, Physical Activity and the Prevention of Cancer. A Global Perspective. Washington, DC: American Institute for Cancer Research; 2007. [Google Scholar]
- 8.Chan JM, Gann PH, Giovannucci EL. Role of diet in prostate cancer development and progression. J Clin Oncol. 2005;23:8152–8160. doi: 10.1200/JCO.2005.03.1492. [DOI] [PubMed] [Google Scholar]
- 9.Kelavkar UP, Parwani AV, Shappell SB, Martin WD. Conditional expression of human 15-lipoxygenase-1 in mouse prostate induces prostatic intraepithelial neoplasia: the FLiMP mouse model. Neoplasia. 2006;8:510–522. doi: 10.1593/neo.06202. [DOI] [PMC free article] [PubMed] [Google Scholar]
- 10.Brown MD, Hart CA, Gazi E, Bagley S, Clarke NW. Promotion of prostatic metastatic migration towards human bone marrow stoma by Omega 6 and its inhibition by Omega 3 PUFAs. Br J Cancer. 2006;94:842–853. doi: 10.1038/sj.bjc.6603030. [DOI] [PMC free article] [PubMed] [Google Scholar]
- 11.Chen H, Ward MH, Graubard BI, Heineman EF, Markin RM, Potischman NA, Russell RM, Weisenburger DD, Tucker KL. Dietary patterns and adenocarcinoma of the esophagus and distal stomach. Am J Clin Nutr. 2002;75:137–144. doi: 10.1093/ajcn/75.1.137. [DOI] [PubMed] [Google Scholar]
- 12.Hu J, La Vecchia C, DesMeules M, Negri E, Mery L. Meat and fish consumption and cancer in Canada. Nutr Cancer. 2008;60:313–324. doi: 10.1080/01635580701759724. [DOI] [PubMed] [Google Scholar]
- 13.Pourfarzi F, Whelan A, Kaldor J, Malekzadeh R. The role of diet and other environmental factors in the causation of gastric cancer in Iran--a population based study. Int J Cancer. 2009;125:1953–1960. doi: 10.1002/ijc.24499. [DOI] [PubMed] [Google Scholar]
- 14.Stroup DF, Berlin JA, Morton SC, Olkin I, Williamson GD, Rennie D, Moher D, Becker BJ, Sipe TA, Thacker SB. Meta-analysis of observational studies in epidemiology: a proposal for reporting. Meta-analysis Of Observational Studies in Epidemiology (MOOSE) group. JAMA. 2000;283:2008–2012. doi: 10.1001/jama.283.15.2008. [DOI] [PubMed] [Google Scholar]
- 15.Greenland S, Longnecker MP. Methods for trend estimation from summarized dose-response data, with applications to meta-analysis. Am J Epidemiol. 1992;135:1301–1309. doi: 10.1093/oxfordjournals.aje.a116237. [DOI] [PubMed] [Google Scholar]
- 16.Orsini N, Bellocco R, Greenland S. Generalized least squares for trend estimation of summarized dose-response data. Stata J. 2006;6:40–57. [Google Scholar]
- 17.Willett WC, Stampfer MJ, Colditz GA, Rosner BA, Speizer FE. Relation of meat, fat, and fiber intake to the risk of colon cancer in a prospective study among women. N Engl J Med. 1990;323:1664–1672. doi: 10.1056/NEJM199012133232404. [DOI] [PubMed] [Google Scholar]
- 18.Bostick RM, Potter JD, Kushi LH, Sellers TA, Steinmetz KA, McKenzie DR, Gapstur SM, Folsom AR. Sugar, meat, and fat intake, and non-dietary risk factors for colon cancer incidence in Iowa women (United States) Cancer Causes Control. 1994;5:38–52. doi: 10.1007/BF01830725. [DOI] [PubMed] [Google Scholar]
- 19.Giovannucci E, Rimm EB, Stampfer MJ, Colditz GA, Ascherio A, Willett WC. Intake of fat, meat, and fiber in relation to risk of colon cancer in men. Cancer Res. 1994;54:2390–2397. [PubMed] [Google Scholar]
- 20.Kato I, Akhmedkhanov A, Koenig K, Toniolo PG, Shore RE, Riboli E. Prospective study of diet and female colorectal cancer: the New York University Women’s Health Study. Nutr Cancer. 1997;28:276–281. doi: 10.1080/01635589709514588. [DOI] [PubMed] [Google Scholar]
- 21.Hsing AW, McLaughlin JK, Chow WH, Schuman LM, Co Chien HT, Gridley G, Bjelke E, Wacholder S, Blot WJ. Risk factors for colorectal cancer in a prospective study among U.S. white men. Int J Cancer. 1998;77:549–553. doi: 10.1002/(sici)1097-0215(19980812)77:4<549::aid-ijc13>3.0.co;2-1. [DOI] [PubMed] [Google Scholar]
- 22.Knekt P, Järvinen R, Dich J, Hakulinen T. Risk of colorectal and other gastro-intestinal cancers after exposure to nitrate, nitrite and N-nitroso compounds: a follow-up study. Int J Cancer. 1999;80:852–856. doi: 10.1002/(sici)1097-0215(19990315)80:6<852::aid-ijc9>3.0.co;2-s. [DOI] [PubMed] [Google Scholar]
- 23.Tiemersma EW, Kampman E, Bueno de Mesquita HB, Bunschoten A, van Schothorst EM, Kok FJ, Kromhout D. Meat consumption, cigarette smoking, and genetic susceptibility in the etiology of colorectal cancer: results from a Dutch prospective study. Cancer Causes Control. 2002;13:383–393. doi: 10.1023/a:1015236701054. [DOI] [PubMed] [Google Scholar]
- 24.English DR, MacInnis RJ, Hodge AM, Hopper JL, Haydon AM, Giles GG. Red meat, chicken, and fish consumption and risk of colorectal cancer. Cancer Epidemiol Biomarkers Prev. 2004;13:1509–1514. [PubMed] [Google Scholar]
- 25.Kojima M, Wakai K, Tamakoshi K, Tokudome S, Toyoshima H, Watanabe Y, Hayakawa N, Suzuki K, Hashimoto S, Ito Y, et al. Diet and colorectal cancer mortality: results from the Japan Collaborative Cohort Study. Nutr Cancer. 2004;50:23–32. doi: 10.1207/s15327914nc5001_4. [DOI] [PubMed] [Google Scholar]
- 26.Sanjoaquin MA, Appleby PN, Thorogood M, Mann JI, Key TJ. Nutrition, lifestyle and colorectal cancer incidence: a prospective investigation of 10998 vegetarians and non-vegetarians in the United Kingdom. Br J Cancer. 2004;90:118–121. doi: 10.1038/sj.bjc.6601441. [DOI] [PMC free article] [PubMed] [Google Scholar]
- 27.Larsson SC, Rafter J, Holmberg L, Bergkvist L, Wolk A. Red meat consumption and risk of cancers of the proximal colon, distal colon and rectum: the Swedish Mammography Cohort. Int J Cancer. 2005;113:829–834. doi: 10.1002/ijc.20658. [DOI] [PubMed] [Google Scholar]
- 28.Lüchtenborg M, Weijenberg MP, de Goeij AF, Wark PA, Brink M, Roemen GM, Lentjes MH, de Bruïne AP, Goldbohm RA, van ‘t Veer P, et al. Meat and fish consumption, APC gene mutations and hMLH1 expression in colon and rectal cancer: a prospective cohort study (The Netherlands) Cancer Causes Control. 2005;16:1041–1054. doi: 10.1007/s10552-005-0239-0. [DOI] [PubMed] [Google Scholar]
- 29.Norat T, Bingham S, Ferrari P, Slimani N, Jenab M, Mazuir M, Overvad K, Olsen A, Tjønneland A, Clavel F, et al. Meat, fish, and colorectal cancer risk: the European Prospective Investigation into cancer and nutrition. J Natl Cancer Inst. 2005;97:906–916. doi: 10.1093/jnci/dji164. [DOI] [PMC free article] [PubMed] [Google Scholar]
- 30.Engeset D, Andersen V, Hjartåker A, Lund E. Consumption of fish and risk of colon cancer in the Norwegian Women and Cancer (NOWAC) study. Br J Nutr. 2007;98:576–582. doi: 10.1017/S0007114507721487. [DOI] [PubMed] [Google Scholar]
- 31.Hall MN, Chavarro JE, Lee IM, Willett WC, Ma J. A 22-year prospective study of fish, n-3 fatty acid intake, and colorectal cancer risk in men. Cancer Epidemiol Biomarkers Prev. 2008;17:1136–1143. doi: 10.1158/1055-9965.EPI-07-2803. [DOI] [PMC free article] [PubMed] [Google Scholar]
- 32.Lee SA, Shu XO, Yang G, Li H, Gao YT, Zheng W. Animal origin foods and colorectal cancer risk: a report from the Shanghai Women’s Health Study. Nutr Cancer. 2009;61:194–205. doi: 10.1080/01635580802419780. [DOI] [PMC free article] [PubMed] [Google Scholar]
- 33.Sugawara Y, Kuriyama S, Kakizaki M, Nagai M, Ohmori-Matsuda K, Sone T, Hozawa A, Nishino Y, Tsuji I. Fish consumption and the risk of colorectal cancer: the Ohsaki Cohort Study. Br J Cancer. 2009;101:849–854. doi: 10.1038/sj.bjc.6605217. [DOI] [PMC free article] [PubMed] [Google Scholar]
- 34.Spencer EA, Key TJ, Appleby PN, Dahm CC, Keogh RH, Fentiman IS, Akbaraly T, Brunner EJ, Burley V, Cade JE, et al. Meat, poultry and fish and risk of colorectal cancer: pooled analysis of data from the UK dietary cohort consortium. Cancer Causes Control. 2010;21:1417–1425. doi: 10.1007/s10552-010-9569-7. [DOI] [PubMed] [Google Scholar]
- 35.Daniel CR, Cross AJ, Graubard BI, Hollenbeck AR, Park Y, Sinha R. Prospective investigation of poultry and fish intake in relation to cancer risk. Cancer Prev Res (Phila) 2011;4:1903–1911. doi: 10.1158/1940-6207.CAPR-11-0241. [DOI] [PMC free article] [PubMed] [Google Scholar]
- 36.Nomura A, Grove JS, Stemmermann GN, Severson RK. A prospective study of stomach cancer and its relation to diet, cigarettes, and alcohol consumption. Cancer Res. 1990;50:627–631. [PubMed] [Google Scholar]
- 37.Ngoan LT, Mizoue T, Fujino Y, Tokui N, Yoshimura T. Dietary factors and stomach cancer mortality. Br J Cancer. 2002;87:37–42. doi: 10.1038/sj.bjc.6600415. [DOI] [PMC free article] [PubMed] [Google Scholar]
- 38.Sauvaget C, Lagarde F, Nagano J, Soda M, Koyama K, Kodama K. Lifestyle factors, radiation and gastric cancer in atomic-bomb survivors (Japan) Cancer Causes Control. 2005;16:773–780. doi: 10.1007/s10552-005-5385-x. [DOI] [PubMed] [Google Scholar]
- 39.Tokui N, Yoshimura T, Fujino Y, Mizoue T, Hoshiyama Y, Yatsuya H, Sakata K, Kondo T, Kikuchi S, Toyoshima H, et al. Dietary habits and stomach cancer risk in the JACC Study. J Epidemiol. 2005;15 Suppl 2:S98–108. doi: 10.2188/jea.15.S98. [DOI] [PMC free article] [PubMed] [Google Scholar]
- 40.Larsson SC, Bergkvist L, Wolk A. Processed meat consumption, dietary nitrosamines and stomach cancer risk in a cohort of Swedish women. Int J Cancer. 2006;119:915–919. doi: 10.1002/ijc.21925. [DOI] [PubMed] [Google Scholar]
- 41.Zheng W, McLaughlin JK, Gridley G, Bjelke E, Schuman LM, Silverman DT, Wacholder S, Co-Chien HT, Blot WJ, Fraumeni JF. A cohort study of smoking, alcohol consumption, and dietary factors for pancreatic cancer (United States) Cancer Causes Control. 1993;4:477–482. doi: 10.1007/BF00050867. [DOI] [PubMed] [Google Scholar]
- 42.Stolzenberg-Solomon RZ, Pietinen P, Taylor PR, Virtamo J, Albanes D. Prospective study of diet and pancreatic cancer in male smokers. Am J Epidemiol. 2002;155:783–792. doi: 10.1093/aje/155.9.783. [DOI] [PubMed] [Google Scholar]
- 43.Michaud DS, Giovannucci E, Willett WC, Colditz GA, Fuchs CS. Dietary meat, dairy products, fat, and cholesterol and pancreatic cancer risk in a prospective study. Am J Epidemiol. 2003;157:1115–1125. doi: 10.1093/aje/kwg098. [DOI] [PubMed] [Google Scholar]
- 44.Nöthlings U, Wilkens LR, Murphy SP, Hankin JH, Henderson BE, Kolonel LN. Meat and fat intake as risk factors for pancreatic cancer: the multiethnic cohort study. J Natl Cancer Inst. 2005;97:1458–1465. doi: 10.1093/jnci/dji292. [DOI] [PubMed] [Google Scholar]
- 45.Larsson SC, Håkanson N, Permert J, Wolk A. Meat, fish, poultry and egg consumption in relation to risk of pancreatic cancer: a prospective study. Int J Cancer. 2006;118:2866–2870. doi: 10.1002/ijc.21732. [DOI] [PubMed] [Google Scholar]
- 46.Lin Y, Kikuchi S, Tamakoshi A, Yagyu K, Obata Y, Inaba Y, Kurosawa M, Kawamura T, Motohashi Y, Ishibashi T. Dietary habits and pancreatic cancer risk in a cohort of middle-aged and elderly Japanese. Nutr Cancer. 2006;56:40–49. doi: 10.1207/s15327914nc5601_6. [DOI] [PubMed] [Google Scholar]
- 47.Heinen MM, Verhage BA, Goldbohm RA, van den Brandt PA. Meat and fat intake and pancreatic cancer risk in the Netherlands Cohort Study. Int J Cancer. 2009;125:1118–1126. doi: 10.1002/ijc.24387. [DOI] [PubMed] [Google Scholar]
- 48.Rohrmann S, Linseisen J, Nöthlings U, Overvad K, Egeberg R, Tjønneland A, Boutron-Ruault MC, Clavel-Chapelon F, Cottet V, Pala V, et al. Meat and fish consumption and risk of pancreatic cancer: results from the European Prospective Investigation into Cancer and Nutrition. Int J Cancer. 2013;132:617–624. doi: 10.1002/ijc.27637. [DOI] [PubMed] [Google Scholar]
- 49.Kjaerheim K, Gaard M, Andersen A. The role of alcohol, tobacco, and dietary factors in upper aerogastric tract cancers: a prospective study of 10,900 Norwegian men. Cancer Causes Control. 1998;9:99–108. doi: 10.1023/a:1008809706062. [DOI] [PubMed] [Google Scholar]
- 50.Kinjo Y, Cui Y, Akiba S, Watanabe S, Yamaguchi N, Sobue T, Mizuno S, Beral V. Mortality risks of oesophageal cancer associated with hot tea, alcohol, tobacco and diet in Japan. J Epidemiol. 1998;8:235–243. doi: 10.2188/jea.8.235. [DOI] [PubMed] [Google Scholar]
- 51.Kurozawa Y, Ogimoto I, Shibata A, Nose T, Yoshimura T, Suzuki H, Sakata R, Fujita Y, Ichikawa S, Iwai N, et al. Dietary habits and risk of death due to hepatocellular carcinoma in a large scale cohort study in Japan. Univariate analysis of JACC study data. Kurume Med J. 2004;51:141–149. doi: 10.2739/kurumemedj.51.141. [DOI] [PubMed] [Google Scholar]
- 52.Sawada N, Inoue M, Iwasaki M, Sasazuki S, Shimazu T, Yamaji T, Takachi R, Tanaka Y, Mizokami M, Tsugane S. Consumption of n-3 fatty acids and fish reduces risk of hepatocellular carcinoma. Gastroenterology. 2012;142:1468–1475. doi: 10.1053/j.gastro.2012.02.018. [DOI] [PubMed] [Google Scholar]
- 53.Larsson SC, Kumlin M, Ingelman-Sundberg M, Wolk A. Dietary long-chain n-3 fatty acids for the prevention of cancer: a review of potential mechanisms. Am J Clin Nutr. 2004;79:935–945. doi: 10.1093/ajcn/79.6.935. [DOI] [PubMed] [Google Scholar]
- 54.Chapkin RS, McMurray DN, Lupton JR. Colon cancer, fatty acids and anti-inflammatory compounds. Curr Opin Gastroenterol. 2007;23:48–54. doi: 10.1097/MOG.0b013e32801145d7. [DOI] [PubMed] [Google Scholar]
- 55.Calder PC, Yaqoob P, Thies F, Wallace FA, Miles EA. Fatty acids and lymphocyte functions. Br J Nutr. 2002;87 Suppl 1:S31–S48. doi: 10.1079/bjn2001455. [DOI] [PubMed] [Google Scholar]
- 56.Serhan CN, Savill J. Resolution of inflammation: the beginning programs the end. Nat Immunol. 2005;6:1191–1197. doi: 10.1038/ni1276. [DOI] [PubMed] [Google Scholar]
- 57.Karin M. Nuclear factor-kappaB in cancer development and progression. Nature. 2006;441:431–436. doi: 10.1038/nature04870. [DOI] [PubMed] [Google Scholar]
- 58.Clevers H. At the crossroads of inflammation and cancer. Cell. 2004;118:671–674. doi: 10.1016/j.cell.2004.09.005. [DOI] [PubMed] [Google Scholar]
- 59.Sauer LA, Blask DE, Dauchy RT. Dietary factors and growth and metabolism in experimental tumors. J Nutr Biochem. 2007;18:637–649. doi: 10.1016/j.jnutbio.2006.12.009. [DOI] [PubMed] [Google Scholar]
- 60.Novak TE, Babcock TA, Jho DH, Helton WS, Espat NJ. NF-kappa B inhibition by omega -3 fatty acids modulates LPS-stimulated macrophage TNF-alpha transcription. Am J Physiol Lung Cell Mol Physiol. 2003;284:L84–L89. doi: 10.1152/ajplung.00077.2002. [DOI] [PubMed] [Google Scholar]
- 61.Schley PD, Brindley DN, Field CJ. (n-3) PUFA alter raft lipid composition and decrease epidermal growth factor receptor levels in lipid rafts of human breast cancer cells. J Nutr. 2007;137:548–553. doi: 10.1093/jn/137.3.548. [DOI] [PubMed] [Google Scholar]
- 62.Stoll BA. N-3 fatty acids and lipid peroxidation in breast cancer inhibition. Br J Nutr. 2002;87:193–198. doi: 10.1079/BJNBJN2001512. [DOI] [PubMed] [Google Scholar]
- 63.Fan YY, Spencer TE, Wang N, Moyer MP, Chapkin RS. Chemopreventive n-3 fatty acids activate RXRalpha in colonocytes. Carcinogenesis. 2003;24:1541–1548. doi: 10.1093/carcin/bgg110. [DOI] [PMC free article] [PubMed] [Google Scholar]
- 64.Aktas H, Halperin JA. Translational regulation of gene expression by omega-3 fatty acids. J Nutr. 2004;134:2487S–2491S. doi: 10.1093/jn/134.9.2487S. [DOI] [PubMed] [Google Scholar]
- 65.Center MM, Jemal A, Ward E. International trends in colorectal cancer incidence rates. Cancer Epidemiol Biomarkers Prev. 2009;18:1688–1694. doi: 10.1158/1055-9965.EPI-09-0090. [DOI] [PubMed] [Google Scholar]
- 66.Geelen A, Schouten JM, Kamphuis C, Stam BE, Burema J, Renkema JM, Bakker EJ, van’t Veer P, Kampman E. Fish consumption, n-3 fatty acids, and colorectal cancer: a meta-analysis of prospective cohort studies. Am J Epidemiol. 2007;166:1116–1125. doi: 10.1093/aje/kwm197. [DOI] [PubMed] [Google Scholar]
- 67.Wu S, Feng B, Li K, Zhu X, Liang S, Liu X, Han S, Wang B, Wu K, Miao D, et al. Fish consumption and colorectal cancer risk in humans: a systematic review and meta-analysis. Am J Med. 2012;125:551–559.e5. doi: 10.1016/j.amjmed.2012.01.022. [DOI] [PubMed] [Google Scholar]
- 68.Li M, Li JY, Zhao AL, Gu J. Colorectal cancer or colon and rectal cancer? Clinicopathological comparison between colonic and rectal carcinomas. Oncology. 2007;73:52–57. doi: 10.1159/000120628. [DOI] [PubMed] [Google Scholar]
- 69.Wu S, Liang J, Zhang L, Zhu X, Liu X, Miao D. Fish consumption and the risk of gastric cancer: systematic review and meta-analysis. BMC Cancer. 2011;11:26. doi: 10.1186/1471-2407-11-26. [DOI] [PMC free article] [PubMed] [Google Scholar]
- 70.Tsugane S. Salt, salted food intake, and risk of gastric cancer: epidemiologic evidence. Cancer Sci. 2005;96:1–6. doi: 10.1111/j.1349-7006.2005.00006.x. [DOI] [PMC free article] [PubMed] [Google Scholar]
- 71.Larsson SC, Orsini N, Wolk A. Processed meat consumption and stomach cancer risk: a meta-analysis. J Natl Cancer Inst. 2006;98:1078–1087. doi: 10.1093/jnci/djj301. [DOI] [PubMed] [Google Scholar]
- 72.Jakszyn P, Gonzalez CA. Nitrosamine and related food intake and gastric and oesophageal cancer risk: a systematic review of the epidemiological evidence. World J Gastroenterol. 2006;12:4296–4303. doi: 10.3748/wjg.v12.i27.4296. [DOI] [PMC free article] [PubMed] [Google Scholar]
- 73.Chen W, Weisburger JH, Fiala ES, Spratt TE, Carmella SG, Chen D, Hecht SS. Gastric carcinogenesis: 2-chloro-4-methylthiobutanoic acid, a novel mutagen in salted, pickled Sanma hiraki fish, or similarly treated methionine. Chem Res Toxicol. 1996;9:58–66. doi: 10.1021/tx9500585. [DOI] [PubMed] [Google Scholar]
- 74.Chavarro JE, Stampfer MJ, Campos H, Kurth T, Willett WC, Ma J. A prospective study of trans-fatty acid levels in blood and risk of prostate cancer. Cancer Epidemiol Biomarkers Prev. 2008;17:95–101. doi: 10.1158/1055-9965.EPI-07-0673. [DOI] [PubMed] [Google Scholar]
- 75.Li D, Day RS, Bondy ML, Sinha R, Nguyen NT, Evans DB, Abbruzzese JL, Hassan MM. Dietary mutagen exposure and risk of pancreatic cancer. Cancer Epidemiol Biomarkers Prev. 2007;16:655–661. doi: 10.1158/1055-9965.EPI-06-0993. [DOI] [PMC free article] [PubMed] [Google Scholar]
- 76.Ohba S, Nishi M, Miyake H. Eating habits and pancreas cancer. Int J Pancreatol. 1996;20:37–42. doi: 10.1007/BF02787374. [DOI] [PubMed] [Google Scholar]
- 77.Norell SE, Ahlbom A, Erwald R, Jacobson G, Lindberg-Navier I, Olin R, Törnberg B, Wiechel KL. Diet and pancreatic cancer: a case-control study. Am J Epidemiol. 1986;124:894–902. doi: 10.1093/oxfordjournals.aje.a114479. [DOI] [PubMed] [Google Scholar]
- 78.He K, Xun P, Brasky TM, Gammon MD, Stevens J, White E. Types of fish consumed and fish preparation methods in relation to pancreatic cancer incidence: the VITAL Cohort Study. Am J Epidemiol. 2013;177:152–160. doi: 10.1093/aje/kws232. [DOI] [PMC free article] [PubMed] [Google Scholar]
- 79.Freedman ND, Cross AJ, McGlynn KA, Abnet CC, Park Y, Hollenbeck AR, Schatzkin A, Everhart JE, Sinha R. Association of meat and fat intake with liver disease and hepatocellular carcinoma in the NIH-AARP cohort. J Natl Cancer Inst. 2010;102:1354–1365. doi: 10.1093/jnci/djq301. [DOI] [PMC free article] [PubMed] [Google Scholar]
- 80.Talamini R, Polesel J, Montella M, Dal Maso L, Crispo A, Tommasi LG, Izzo F, Crovatto M, La Vecchia C, Franceschi S. Food groups and risk of hepatocellular carcinoma: A multicenter case-control study in Italy. Int J Cancer. 2006;119:2916–2921. doi: 10.1002/ijc.22267. [DOI] [PubMed] [Google Scholar]
- 81.Wang MP, Thomas GN, Ho SY, Lai HK, Mak KH, Lam TH. Fish consumption and mortality in Hong Kong Chinese--the LIMOR study. Ann Epidemiol. 2011;21:164–169. doi: 10.1016/j.annepidem.2010.10.010. [DOI] [PubMed] [Google Scholar]
- 82.Srivatanakul P, Parkin DM, Khlat M, Chenvidhya D, Chotiwan P, Insiripong S, L’Abbé KA, Wild CP. Liver cancer in Thailand. II. A case-control study of hepatocellular carcinoma. Int J Cancer. 1991;48:329–332. doi: 10.1002/ijc.2910480303. [DOI] [PubMed] [Google Scholar]
- 83.Fukuda K, Shibata A, Hirohata I, Tanikawa K, Yamaguchi G, Ishii M. A hospital-based case-control study on hepatocellular carcinoma in Fukuoka and Saga Prefectures, northern Kyushu, Japan. Jpn J Cancer Res. 1993;84:708–714. doi: 10.1111/j.1349-7006.1993.tb02033.x. [DOI] [PMC free article] [PubMed] [Google Scholar]
- 84.Cooper AL, Gibbons L, Horan MA, Little RA, Rothwell NJ. Effect of dietary fish oil supplementation on fever and cytokine production in human volunteers. Clin Nutr. 1993;12:321–328. doi: 10.1016/0261-5614(93)90027-2. [DOI] [PubMed] [Google Scholar]
- 85.Vedin I, Cederholm T, Freund Levi Y, Basun H, Garlind A, Faxén Irving G, Jönhagen ME, Vessby B, Wahlund LO, Palmblad J. Effects of docosahexaenoic acid-rich n-3 fatty acid supplementation on cytokine release from blood mononuclear leukocytes: the OmegAD study. Am J Clin Nutr. 2008;87:1616–1622. doi: 10.1093/ajcn/87.6.1616. [DOI] [PubMed] [Google Scholar]
- 86.Berasain C, Castillo J, Perugorria MJ, Latasa MU, Prieto J, Avila MA. Inflammation and liver cancer: new molecular links. Ann N Y Acad Sci. 2009;1155:206–221. doi: 10.1111/j.1749-6632.2009.03704.x. [DOI] [PubMed] [Google Scholar]
- 87.Wall R, Ross RP, Fitzgerald GF, Stanton C. Fatty acids from fish: the anti-inflammatory potential of long-chain omega-3 fatty acids. Nutr Rev. 2010;68:280–289. doi: 10.1111/j.1753-4887.2010.00287.x. [DOI] [PubMed] [Google Scholar]
- 88.Ngoan le T, Thu NT, Lua NT, Hang LT, Bich NN, Hieu NV, Quyet HV, Tai le T, Van do D, Khan NC, et al. Cooking temperature, heat-generated carcinogens, and the risk of stomach and colorectal cancers. Asian Pac J Cancer Prev. 2009;10:83–86. [PubMed] [Google Scholar]