

Background: ITD-FLT3 mutations induce the refractory phenotype in patients with AML and enhance cell migration toward Cxcl12.
Results: The enhanced cell migration toward Cxcl12 by ITD-FLT3 is mediated by inhibiting the down-regulation of Rho-associated kinase.
Conclusion: ITD-FLT3 enhances Cxcl12-induced cell migration by modulating the expression of Rho-associated kinase.
Significance: Rho-associated kinase may be therapeutically manipulated for the treatment of ITD-FLT3+ AML patients.
Keywords: Cell Biology, Gene Regulation, Hematopoiesis, Leukemia, Signal Transduction, CXCL12, CXCR4, ITD-Flt3, Rho-associated Kinase
Abstract
Internal tandem duplication mutations in the Flt3 gene (ITD-FLT3) enhance cell migration toward the chemokine Cxcl12, which is highly expressed in the therapy-protective bone marrow niche, providing a potential mechanism underlying the poor prognosis of ITD-FLT3+ acute myeloid leukemia. We aimed to investigate the mechanisms linking ITD-FLT3 to increased cell migration toward Cxcl12. Classification of the expression of Cxcl12-regulated genes in ITD-FLT3+ cells demonstrated that the enhanced migration of ITD-FLT3+ cells toward Cxcl12 was associated with the differential expression of genes downstream of Cxcl12/Cxcr4, which are functionally distinct from those expressed in ITD-FLT3− cells but are independent of the Cxcr4 expression levels. Among these differentially regulated genes, the expression of Rock1 in the ITD-FLT3+ cells that migrated toward Cxcl12 was significantly higher than in ITD-FLT3− cells that migrated toward Cxcl12. In ITD-FLT3− cells, Rock1 expression and Mypt1 phosphorylation were transiently up-regulated but were subsequently down-regulated by Cxcl12. In contrast, the presence of ITD-FLT3 blocked the Cxcl12-induced down-regulation of Rock1 and early Mypt1 dephosphorylation. Likewise, the FLT3 ligand counteracted the Cxcl12-induced down-regulation of Rock1 in ITD-FLT3− cells, which coincided with enhanced cell migration toward Cxcl12. Rock1 antagonists or Rock1 shRNA abolished the enhanced migration of ITD-FLT3+ cells toward Cxcl12. Our findings demonstrate that ITD-FLT3 increases cell migration toward Cxcl12 by antagonizing the down-regulation of Rock1 expression. These findings suggest that the aberrant modulation of Rock1 expression and activity induced by ITD-FLT3 may enhance acute myeloid leukemia cell chemotaxis to the therapy-protective bone marrow niche, where Cxcl12 is abundantly expressed.
Introduction
Internal tandem duplication mutations in the FLT3 gene (ITD-FLT3), which are observed in human acute myeloid leukemia (AML)3 stem cells, are found in 20–30% of patients with AML (1–4). Although ITD-FLT3 has been associated with extremely poor patient prognoses, FLT3 inhibitors fail to display significant efficacy as an anti-AML therapy (1–3). This lack of significant efficacy of FLT3 inhibitors (1–3) suggests that targeting cells using a cell autonomous mechanism alone may not be sufficient for the treatment of ITD-FLT3+ AML and that the development of additional therapeutic strategies is necessary to overcome the refractory phenotype induced by ITD-FLT3. Human AML stem cells residing in the endosteal niche of the bone marrow are relatively chemoresistant (5). This resistance results from survival cues in the form of various cytokines and adhesion molecules produced by niche cells, which increase the resistance of these cells to cytoreductive therapies (6). Therefore, antagonizing the interaction between leukemia cells and their niche may provide additional therapeutic benefits to patients with AML that is refractory to FLT3 inhibitors. Stromal cell-derived factor-1 (Cxcl12), a chemokine expressed by bone marrow osteoblasts, is responsible for retaining hematopoietic stem cells in the marrow niche (6). Most leukemia cells express Cxcr4, a receptor for Cxcl12, and migrate in response to Cxcl12 (7–9). Cxcr4 expression is associated with poor prognoses in patients with AML, particularly patients who are ITD-FLT3+ (10, 11). Recent studies have suggested that releasing leukemia cells from the bone marrow niche by blocking the interaction between Cxcl12 and Cxcr4 effectively increases their sensitivity to cytoreductive treatment (12, 13). These findings suggest that the interaction between Cxcl12 and Cxcr4 facilitates the retention and homing of leukemia cells in the bone marrow niche and is associated with disease progression.
We previously reported that ITD-FLT3 mutations enhance the migration of mouse Ba/F3 and 32D cells toward Cxcl12 (14), suggesting that ITD-FLT3 may enhance the retention and/or adherence of leukemia cells to the bone marrow microenvironment where Cxcl12 is expressed. The Cxcr4 antagonist AMD3100 selectively reduces the proliferation of ITD-FLT3+ AML leukemic blasts (15), and Cxcr4 inhibition by AMD3465 increases the sensitivity of FLT3-mutated leukemic cells to the apoptogenic effects of an FLT3 inhibitor (16). These data suggest that ITD-FLT3-mediated retention resulting from enhanced chemotaxis toward Cxcl12 may represent one mechanism that underlies the resistance of ITD-FLT3+ AML cells to chemotherapy. However, the molecular mechanism responsible for the aberrant response of ITD-FLT3+ cells to Cxcl12 has not been investigated. A recent report demonstrated that Rho-associated kinase (Rock) regulates the proliferation of ITD-FLT3+ hematopoietic cells (17). Cxcl12 regulates Rock activity, but its effects on Rock activity can be either stimulatory or inhibitory depending on the cell type and the time course examined (18–21). In this study, we investigated the functional role of Rock1 and the signaling network involved in the aberrant migration of ITD-Flt3+ cells toward Cxcl12. Our data demonstrate that ITD-FLT3 blocks the down-regulation of Rock1, thereby augmenting the chemotaxis of these cells toward Cxcl12.
EXPERIMENTAL PROCEDURES
Antibodies and Reagents
The phycoerythrin anti-human CXCR4 (clone 12G5) and phycoerythrin anti-mouse Cxcr4 antibodies and the neutralizing antibody against mouse Cxcr4 (clone 247506) were purchased from BD Biosciences. Recombinant human FLT3 ligand (FL), recombinant murine Sdf-1α (Cxcl12), recombinant murine Ccl2, and the phycoerythrin-conjugated anti-human/mouse Cxcr7 antibody were purchased from R&D Systems (Minneapolis, MN). AC220 and AMD3100 were purchased from Selleckchem (Houston, TX) and EMD Chemicals, Inc. (Darmstadt, Germany), respectively. CEP701 and the Cxcr7 agonist VUF11207 were purchased from Calbiochem. LY294002, Y27632, and H1152 were purchased from Wako Pure Chemicals (Osaka, Japan). The antibodies against Rock1 and Actin (I-19) were purchased from Santa Cruz Biotechnology (Santa Cruz, CA). The antibodies against phosphorylated myosin phosphatase-targeting subunit 1 (p-Mypt1), total Mapkp42/p44, phosphorylated MAPKp42/p44, total Creb, and phosphorylated Creb were purchased from Cell Signaling Technology (Danvers, MA).
mRNA Microarray Analyses and RT-PCR
Ba/F3 cells expressing wild-type FLT3 or ITD-FLT3 (N51, N73, and N78) obtained from three different patients with AML were provided by Dr. D. G, Gilliland of Harvard Medical School (22). The in vitro migration assay was performed as described previously (14). Ba/F3 cells expressing wild-type FLT3 or ITD-FLT3 (N51 and N78) were subjected to a migration assay toward 100 ng/ml CXCL12 for 4 h. The percentage of migrated cells was calculated by dividing the number of migrated cells by the number of incubated cells and multiplying by 100. Both the cells that had migrated to the lower chamber and the input cells were collected, and the mRNA expression levels were quantified using mRNA microarrays. The microarray analyses were performed by Miltenyi Biotec (Auburn, CA). Briefly, 250 ng of each cDNA were used as a template for Cy3 and Cy5 labeling. Equal amounts of the labeled cDNAs from Ba/F3 cells expressing wild-type FLT3 or ITD-FLT3 (N51 and N78) were hybridized for 17 h at 65 °C to Agilent Whole Mouse Genome Oligo Microarrays (44 K) according to the manufacturer's protocol. The differentially expressed genes were annotated and functionally classified according to the available information regarding their molecular functions and biological processes as defined by the Gene Ontology terms and the molecular pathways in the KEGG database. The significantly differentially expressed genes were annotated and assigned to functional categories using the Database for Annotation, Visualization, and Integrated Discovery, DAVID) 2008 (23). The functional networks corresponding to the genes that were differentially expressed in response to ITD-FLT3 and/or CXCL12 were visualized using Cytoscape software (24). The primer sequences used for RT-PCR were as follows: Rock1, 5′-CGACCTGTAACCCAAGGAGA-3′ and 5′-GGCCTTTGTGATTCTGGAAA-3′; Rock2, 5′-GGCCTTGCATATTGGTATGG-3′ and 5′-CACAGGCAATGACAACCATC-3′; and Hprt, 5′-TGGACAGGACTGAAAGACTTGCTCG-3′ and 5′-GGCCACAATGTGATGGCCTCCC-3′. The PCR cycling parameters were 95 °C for 10 min, followed by 50 cycles at 95 °C for 15 s and 60 °C for 1 min.
Calcium Mobilization Assay
Calcium mobilization was analyzed using Fluo-4NW (Invitrogen). The cells in 1× Hanks' balanced salt solution supplemented with 20 mm HEPES solution were mixed with Fluo-4NW prior to incubation in Cxcl12. The fluorescent signal (488 nm excitation) in the cells was measured immediately before and after incubation in 10 ng or 100 ng/ml Cxcl12 using a FACSCalibur flow cytometer (BD Biosciences).
Generation of Rock1 shRNA
The sequences targeting Rock1 mRNA (NM_009071) were selected using Bioinformatics-siRNA Designer on the Clontech website. The shRNA oligonucleotides were cloned into the pSingle-tTS-shRNA vector containing neomycin phosphotransferase as a selectable marker (Clontech). To generate cells expressing shRNA against Rock1, we first generated Ba/F3 cells expressing wild-type FLT3 or ITD-FLT3 (N51) by transducing MSCV-Flt3-EGFP, which does not carry the neomycin phosphotransferase gene (22, 25). Then we collected the GFP-positive cells using a FACSAria IITM cell sorter (BD Biosciences). The recombinant vectors containing control shRNA or Rock1 shRNA were transfected into cells expressing wild-type FLT3 or ITD-FLT3 (N51). These cells were cultured in RPMI 1640 medium containing 10% Tet System-approved FBS (Clontech). Stable transformants were selected using 1 mg/ml G418. To activate RNA interference against Rock1, 1 μg/ml doxycycline was added to the culture medium. Finally, a single clone that exhibited Rock1 knockdown was subjected to a migration assay. The Rock1-specific shRNA sequences were 5′-GCTGGATAAGTCTGGACAT-3′ and 5′-GAGCAAATGCCAGTGAGAAC-3′.
Statistical Analysis
The data are expressed as the means ± S.E. of the mean, and statistical significance was evaluated using Microsoft Excel (Microsoft Corp., Seattle, WA) via the two-tailed Student's t test.
RESULTS
ITD-Flt3-induced Enhancement of Cell Migration toward Cxcl12 Does Not Involve the Up-regulation of Cxcr4 Signaling
We previously reported that ITD-FLT3 mutations enhance the migration of Ba/F3 and 32D cells within 4 h (14). Here, we assessed the kinetics of ITD-FLT3-induced cell migration. In the absence of chemokines or cytokines, Ba/F3 cells expressing ITD-FLT3 (ITD-FLT3+ Ba/F3 cells) exhibited increased migration than those expressing wild-type FLT3 (ITD-FLT3− Ba/F3 cells) at 4, 8, and 24 h (p < 0.05; Fig. 1A, left panel). The increased migration of ITD-FLT3 cells was not due to increased cell proliferation during the 24-h period, as the proportion of cells that migrated was significantly higher than that of cells that proliferated during this period (data not shown). Treatment with CEP-701, a tyrosine kinase inhibitor that inhibits FLT3 kinase activity, decreased the ITD-FLT3-induced migration of Ba/F3 cells (p < 0.05; Fig. 1A, right panel). Similarly, AC220, a more specific and potent antagonist of ITD-FLT3 (27), significantly inhibited the migration of ITD-FLT3+ Ba/F3 cells (p < 0.05; Fig. 1A, right panel). ITD-FLT3 mutations (N51 and N78) significantly increased the migration of Ba/F3 cells toward 100 ng/ml Cxcl12 compared with ITD-FLT3− Ba/F3 cells during a 24-h period (Fig. 1B, top panel). The superior migration of ITD-FLT3-expressing cells was also detected in the presence of a Cxcl12 concentration of 1, 10, 50, or 500 ng/ml (Fig. 1B, bottom panel). The migration of ITD-FLT3+ Ba/F3 cells was the highest at concentrations between 10 and 100 ng/ml. In contrast, the migration of ITD-FLT3− Ba/F3 cells peaked at concentrations between 1 and 50 ng/ml. Conversely, the migration of ITD-FLT3+ Ba/F3 cells toward Cxcl12 was inhibited by treatment with AC220 in a dose-dependent manner (Fig. 1B, center panel). Similarly, AC220 and CEP-701 reduced the migration of human leukemia MV4-11 cells harboring endogenous ITD-FLT3 toward Cxcl12 (Fig. 1B, right panel). A neutralizing antibody against Cxcr4 significantly inhibited the enhanced migration of ITD-FLT3+ Ba/F3 cells toward Cxcl12, and this inhibitory effect was exacerbated by combined treatment with AC220 (Fig. 1C, left panel). Similar results were found following treatment with CEP-701 and/or the Cxcr4 antagonist AMD3100 (Fig. 1C, right panel).
FIGURE 1.


ITD-FLT3-induced enhancement of cell migration toward Cxcl12 does not involve up-regulation of Cxcr4 signaling. A, baseline migration of ITD-FLT3− or ITD-FLT3+ (N51) Ba/F3 cells was quantified for 24 h (left panel, *, p < 0.05 compared with ITD-FLT3− Ba/F3 cells, n = 3). The right panel indicates the dose-dependent inhibition of the migration of ITD-FLT3+ (N51) Ba/F3 cells using CEP701 or AC220. The fold-change in migration relative to that of the DMSO control is shown (*, p < 0.05, n = 3). B, migration of ITD-FLT3+ (N51 and N78) and ITD-FLT3− Ba/F3 cells toward 100 ng/ml Cxcl12 (upper panel in the left panel). Cell migration was normalized to the number of input cells that were incubated during the corresponding time frame. (*, p < 0.05 compared with the ITD-FLT3− Ba/F3 cells, n = 2.) The lower panel on the left shows the migration of ITD-FLT3+ (N51) and ITD-FLT3− Ba/F3 cells toward various concentrations of Cxcl12 for 4 h. (*, p < 0.05 compared with the ITD-FLT3− Ba/F3 cells, n = 2.) The center panel represents the percentage of migration of ITD-FLT3+ Ba/F3 cells toward 100 ng/ml Cxcl12 in the presence of 1 or 5 nm AC220. (*, p < 0.05 compared with control cells in the absence of AC220, n = 3.) The right panel shows the fold-change in migration of ITD-FLT3+ MV4-11 cells toward 100 ng/ml CXCL12 in the presence of 1.0 nm CEP701 or 5.0 nm AC220 compared with the DMSO control. (*, p < 0.05, n = 3.) C, left panel shows the migration of ITD-FLT3+ (N51) and ITD-FLT3− Ba/F3 cells toward 10 ng/ml Cxcl12 in the presence of 1 nm AC220 and/or 10 μg/ml of a neutralizing anti-mouse CXCR4 antibody. The right panel shows the migration of the same cells toward 100 ng/ml CXCL12 in the presence of 20 μm AMD3100 and/or 10 nm CEP701. (*, p < 0.05 compared with the ITD-Flt3− cells treated with DMSO and CXCL12; †, p < 0.05 compared with the ITD-Flt3+ cells treated with DMSO and CXCL12, n = 3.) D, left panel, expression of Cxcr4 in ITD-FLT3+ (N51 and N78) Ba/F3 cells compared with ITD-FLT3− Ba/F3 cells analyzed via flow cytometry. The relative mRNA level of Cxcr4 was determined using an mRNA array. The right histogram shows Cxcr4 expression ITD-FLT3+ (N51 and N78) Ba/F3 cells in the presence or absence of a 4-h stimulation with 100 ng/ml Cxcl12. Quantification of the Cxcr4 surface protein and mRNA expression levels is shown below the plots. The data shown represent one of the three experiments. Right panel, left bar graph shows a comparison of the CXCR4 mRNA levels between patients with ITD-FLT3+ AML (78 cases) and ITD-FLT3− AML (190 cases). The CXCR4 levels were analyzed using three CXCR4 probes, which were deposited in a public gene expression database (GSE1159, www.ncbi.nlm.nih.gov) (26) (*, p < 0.05). The right bar graph indicates the relative surface expression of CXCR4 in MV4-11 cells that express endogenous ITD-FLT3 compared with RS4;11 cells, which do not harbor ITD-FLT3, as determined via flow cytometry (*, p < 0.05, n = 3). E, calcium mobilization in the ITD-FLT3+ (N51) and ITD-FLT3− Ba/F3 cells stimulated with 10 or 100 ng/ml Cxcl12. The fold-increase in fluorescence following stimulation with Cxcl12 compared with before incubation is shown (*, p < 0.05, n = 3). F, IL-3-deprived ITD-FLT3− and ITD-FLT3+ Ba/F3 cells (1, N51; 2, N73; and 3, N78) were incubated in 100 ng/ml Cxcl12 for 10 min. Erkp42/p44 and Creb phosphorylation was determined via Western blot analyses before and after incubation in Cxcl12. The signal of the protein was measured and analyzed using the densitometer in the Odyssey infrared imaging system (LI-COR biosciences, Lincoln, NE). The relative expression level of each phosphorylated protein compared with total protein is shown below the blots.
Despite the enhancement in cell migration toward Cxcl12, the Cxcr4 mRNA and Cxcr4 protein surface expression levels were consistently lower in ITD-FLT3+ Ba/F3 cells than in ITD-FLT3− cells (Fig. 1D, left panel). Moreover, Cxcr4 expression was further down-regulated by Cxcl12 in ITD-FLT3+ cells (Fig. 1D, left panel). Comparison of the Cxcr4 expression levels in different human AML cell lines using gene expression data from the public gene expression profile database (26) demonstrated that Cxcr4 mRNA expression was significantly lower in ITD-FLT3+ AML cells (n = 78) than in ITD-FLT3− AML cells (n = 190, p < 0.05; Fig. 1D, right panel). Consistent with these data, the Cxcr4 protein surface expression levels in human MV4-11 acute leukemia cells expressing ITD-FLT3 was lower than that in RS4;11 cells, which express wild-type FLT3 (p < 0.05; Fig. 1D, right panel). The expression of Cxcr7, another receptor of Cxcl12 that mediates Cxcl12 signaling (28, 29), was barely detectable in both ITD-FLT3+ and ITD-FLT3− Ba/F3 cells. Although CXCR7 was expressed on the surface of ITD-FLT3+ MV4-11 cells, the CXCR7 agonist VUF11207, which recruits β-arrestin2 at a concentration of 1.6 nm (30), failed to induce the migration of these cells at 2 or 20 nm (data not shown). Because ITD-FLT3 enhances cell migration toward Cxcl12 despite a reduction in the expression level of Cxcr4, we next examined whether ITD-FLT3 mutations enhance calcium mobilization and the phosphorylation of Erkp42/p44 and Creb in response to Cxcl12 stimulation. Calcium mobilization immediately after incubation in either 10 or 100 ng/ml Cxcl12 were equivalent or significantly reduced in ITD-FLT3+ Ba/F3 cells compared with ITD-FLT3− Ba/F3 cells (Fig. 1E). Although incubation in Cxcl12 enhances Erkp42/p44 and Creb phosphorylation in Ba/F3 cells expressing wild-type FLT3 (14) or three different types of ITD-FLT3, ITD-FLT3 mutation failed to enhance Cxcl12-induced phosphorylation (Fig. 1F). These data suggest that the enhanced migration toward Cxcl12 mediated by ITD-FLT3 does not correlate to an increase in Cxcr4 signaling.
ITD-Flt3 Modulates the Cxcl12-induced Changes in Gene Expression
Because the ITD-FLT3-induced enhancement of cell migration toward Cxcl12 does not appear to be caused by an increase in Cxcr4 signaling, we examined whether ITD-FLT3 qualitatively affects the pathways downstream of Cxcl12/Cxcr4 by identifying the differentially expressed genes in ITD-FLT3+ cells compared with ITD-FLT3− cells before and after migration toward Cxcl12 via mRNA microarray analysis. First, we compared the gene expression profile of ITD-FLT3+ Ba/F3 cells to that of ITD-FLT3− Ba/F3 cells to identify the pathways that are potentially involved in ITD-FLT3-induced cell migration. The expression of 1,274 mRNAs was up-regulated, whereas that of 569 mRNAs was down-regulated by more than 50% in the cells expressing N51- and N78-ITD-FLT3. Classification of the genes according to the KEGG database indicated that genes associated with leukocyte transendothelial migration, regulation of the actin cytoskeleton, and the chemokine signaling pathway were significantly regulated by ITD-FLT3 (p < 0.05; Fig. 2A). The similar classification of a gene expression profile deposited in the public expression profile database (GSE1159: www.ncbi.nlm.nih.gov) demonstrated that genes associated with the regulation of cell migration, actin cytoskeleton organization, cell motility, and cell adhesion molecule binding were significantly enriched among the genes differentially expressed in the ITD-FLT3+ AML cells (n = 78) compared with the ITD-FLT3− AML cells (n = 190, p < 0.05).
FIGURE 2.
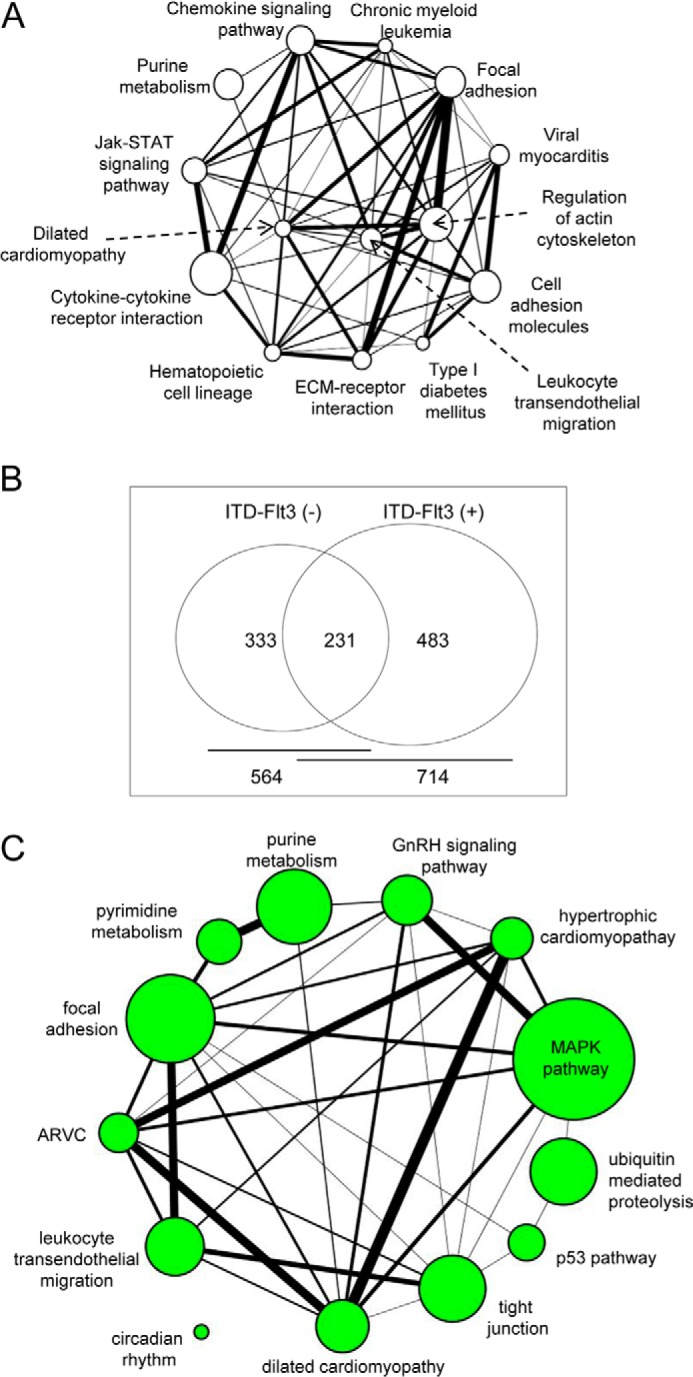
ITD-FLT3 modulates the CXCL12-induced changes in gene expression. A, genes that are regulated (greater than 50% increase or decrease in expression) by N51 or N78 ITD-FLT3 were assessed in Ba/F3 cells via mRNA microarray analyses. The genes were classified based on the KEGG pathway database using DAVID 2008 (23). The circles represent the functional groups, and the lines indicate the presence of shared molecules between the groups. The sizes of the circles and thickness of the lines represent the relative numbers of genes included in the functional group and the numbers of genes shared between the groups, respectively. B, genes regulated by Cxcl12 in control ITD-FLT3− and/or ITD-FLT3+ (N51 and N78) cells were classified. The data indicate that 333 genes are regulated by Cxcl12 only in the absence of ITD-FLT3, whereas 483 genes are regulated by Cxcl12 only in the presence of ITD-FLT3. The 231 shared genes represent genes regulated by Cxcl12 in the presence and absence of ITD-FLT3. The list of genes that are regulated by Cxcl12 in ITD-FLT3− and/or ITD-FLT3+ cells is presented in supplemental Tables 1–3. C, functional network of Cxcl12-regulated genes in ITD-FLT3+ cells is shown. The genes regulated by Cxcl12 in ITD-FLT3+ (N51) cells were functionally classified based on the KEGG database using DAVID 2008 (22). The sizes of the circles and thickness of the lines represent the relative numbers of genes included in the functional group and the numbers of genes shared between the groups, respectively.
A comparison of the Cxcl12-induced expression changes between ITD-FLT3+ and ITD-FLT3− Ba/F3 cells revealed that Cxcl12 modulates 714 of the 41,174 genes in ITD-FLT3+ cells, 483 of which are regulated by Cxcl12 exclusively in ITD-FLT3+ cells. Cxcl12 regulates 564 genes in ITD-FLT3− cells, 333 of which are regulated by Cxcl12 exclusively in the absence of ITD-FLT3 (>50% increase or decrease compared with no Cxcl12 stimulation, p < 0.05; Fig. 2B). Functional classification of the molecules selectively regulated by Cxcl12 in ITD-FLT3+ cells indicated that focal adhesion, trans-endothelial migration, and the MAPK pathway were significantly enriched by Cxcl12 in ITD-FLT3+ cells but not in control cells (Fig. 2C). These data demonstrate that ITD-FLT3 modulates genes downstream of Cxcl12 that are functionally distinct from those affected in ITD-FLT3− cells.
FLT3 Signaling Antagonizes the Cxcl12-induced Down-regulation of Rock Expression
One of the genes that was differentially regulated by Cxcl12 depending on the FLT3 status was Rock1, the expression of which was down-regulated in ITD-FLT3− cells but not in ITD-FLT3+ cells. Because Rock1 is a critical mediator of cell adhesion and migration, we investigated whether differences in Rock1 expression underlie the modulation of ITD-FLT3-mediated Cxcl12-induced cell migration. Microarray analyses indicated that Rock1 expression was down-regulated in ITD-FLT3− cells by 23 ± 9% (n = 4, p < 0.05) following a 4-h migration toward 100 ng/ml Cxcl12. This reduction in Rock1 was validated via quantitative RT-PCR (55 ± 9% reduction, n = 5, p < 0.05) and Western blot analyses (Fig. 3A). Despite the Cxcl12-induced reduction in Rock1 expression, treatment with the Rock inhibitor Y27632 significantly inhibited the migration of ITD-FLT3− Ba/F cells toward 100 ng/ml Cxcl12 in a dose-dependent manner (n = 3, p < 0.05; Fig. 3B), indicating that Rock1 is required for Cxcl12-induced cell migration. Because the paradoxical down-regulation of Rock1 by Cxcl12 does not adequately explain the requirement of Rock1 for cell migration toward Cxcl12, we examined the time course of Rock1 expression in response to Cxcl12. Incubating control cells lacking ITD-FLT3 in 1, 10, or 50 ng/ml Cxcl12 significantly up-regulated Rock1 mRNA; however, Rock1 mRNA expression returned to baseline after 4 h in the presence of 10 or 50 ng/ml Cxcl12 (Fig. 3C, left panel). These alterations in Rock1 mRNA expression were dependent on the concentration of Cxcl12. Whereas the Rock1 mRNA levels continued to increase in the cells incubated in 1 ng/ml Cxcl12, Rock1 expression was significantly down-regulated after 4 h in the presence of 100 ng/ml Cxcl12 (Fig. 3C, right panel). Therefore, Rock1 mRNA is up-regulated shortly after Cxcl12 stimulation, but it is subsequently down-regulated in the presence of 100 ng/ml Cxcl12.
FIGURE 3.

Flt3 signaling antagonizes the Cxcl12-induced down-regulation of Rock expression. A, Rock1 expression was analyzed in the control Ba/F3 cells lacking ITD-FLT3 before and after incubation in 100 ng/ml Cxcl12 for 4 h. The mRNA levels were determined via microarray and quantitative RT-PCR analysis using Power SYBR Green PCR SuperMix (Applied Biosystems, Foster City, CA). The bottom panel shows the Rock1 protein levels as determined by Western blot analysis. B, percentage of migration of ITD-FLT3− Ba/F3 cells toward Cxcl12 in the presence of the Rock antagonist Y27632. The cells were pretreated with DMSO or 1 or 10 μm Y27632 for 1 h and then subjected to a migration assay using 100 ng/ml Cxcl12 for 4 h (*, p < 0.05 compared with the DMSO control, n = 3). C, left panel shows the fold-increase in the Rock1 mRNA levels in ITD-FLT3− cells incubated in 1, 10, or 50 ng/ml Cxcl12 for 4 h compared with unstimulated cells. Rock1 mRNA expression was determined via quantitative RT-PCR (*, p < 0.05 compared with before CXCL12 stimulation, n = 4). The right panel indicates the fold-change in Rock1 mRNA expression in response to a 4-h incubation of ITD-FLT3− cells in different doses of Cxcl12 compared with the absence of Cxcl12 at time 0 (*, p < 0.05 compared with preceding Cxcl12 stimulation, n = 4). D, fold-change in Rock1 mRNA expression in cells expressing wild-type FLT3 (ITD-Flt3− control cells) that were incubated in 0–500 ng/ml FL for 4 h (*, p < 0.05 compared with 0 ng/ml FL, n = 3). E, left panel indicates the relative change in Rock1 mRNA expression in control cells expressing wild-type FLT3 that were incubated in 100 ng/ml Cxcl12 in the presence of 10 or 100 ng/ml FL for 4 h compared with unstimulated cells. (*, p < 0.05 compared with the unstimulated cells; †, p < 0.05 compared with the cells incubated in 100 ng/ml CXCL12, n = 3.) Right panel indicates the migration of BaF3 cells expressing wild-type FLT3 (ITD-FLT3− control cells) in response to 100 ng/ml Cxcl12 for 4 h in the presence or absence of 100 ng/ml FL (*, p < 0.05, n = 3). The bottom panel shows the fold-change in cell migration toward FL and Cxcl12 in cells pretreated with 0.01 or 0.1 μm H1152 compared with incubation in DMSO (*, p < 0.05, n = 3). F, left panel shows the fold-change in Rock2 mRNA expression in ITD-Flt3− control cells incubated in 0–500 ng/ml FL for 4 h. (*, p < 0.05 compared with the cells incubated in 0 ng/ml FL, n = 3.) Right panel indicates the relative change in the Rock2 mRNA expression levels in ITD-FLT3− control cells incubated in 100 ng/ml Cxcl12 in the presence of 10 or 100 ng/ml FL for 4 h. (*, p < 0.05 compared with the cells incubated in the absence of Cxcl12 stimulation; †, p < 0.05 compared with the cells incubated in 100 ng/ml Cxcl12, n = 3.)
In contrast to the effects of Cxcl12, Rock1 mRNA expression was up-regulated following a 4-h incubation of Ba/F cells expressing wild-type FLT3 in FLT3 ligand (FL) in a dose-dependent manner (n = 3, p < 0.05; Fig. 3D). Moreover, the Cxcl12-induced reduction in Rock1 mRNA expression was abrogated by treatment with 10 or 100 ng/ml FL (Fig. 3E, left panel). In the control cells, treatment with both 100 ng/ml FL and Cxcl12 up-regulated Rock1 mRNA expression compared with treatment with Cxcl12 alone (55 ± 19% increase, n = 3, p < 0.01; Fig. 3E, left panel), which coincided with an enhancement in cell migration toward Cxcl12 (Fig. 3E, right panel). The FL-induced enhancement of migration toward Cxcl12 was inhibited by the Rock inhibitor H1152 (Fig. 3E, bottom panel). Similar to Rock1, Rock2 mRNA expression was also up-regulated by FL in a dose-dependent manner (Fig. 3F, left panel). Whereas Cxcl12 decreased the expression of Rock2 after a 4-h incubation period, FL inhibited the Cxcl12-induced reduction in Rock2 mRNA expression (Fig. 3F, right panel). These data indicate that FLT3 signaling antagonizes the Cxcl12-induced down-regulation of Rock1 and Rock2 mRNA expression.
Enhanced Cell Migration toward Cxcl12 by ITD-FLT3 Is Mediated by Blocking the Down-regulation of Rock1
Similar to FL treatment, ITD-FLT3 mutations increased Rock1 mRNA expression compared with the control Flt3 (2.1 ± 0.5-, 2.2 ± 0.2-, and 3.2 ± 0.6-fold increases for N51, N73, and N78, respectively; p < 0.05; Fig. 4A, upper left panel). The elevation in the Rock1 mRNA expression level was accompanied by the enhanced phosphorylation of Mypt1, a substrate of Rho kinase, as reported previously (Fig. 4A, lower left panel) (17). Although there was no difference in the ROCK1 mRNA expression level between ITD-FLT3+ and ITD-FLT3− primary bone marrow samples derived from patients with M1 or M2 AML, the ROCK1 mRNA expression levels in the ITD-FLT3+ patients with M3, M4, M5, or M6 (n = 34) were higher than in the ITD-FLT3− AML samples that have been deposited in the public database (GSE 1159, n = 101, p < 0.05; Fig. 4A, upper right panel). Consistent with the elevation in Rock1 expression, treatment with the Rock inhibitor Y27632 dose-dependently inhibited the baseline migration of ITD-FLT3+ Ba/F3 cells (n = 3, p < 0.05; Fig. 4A, lower right panel). Although Rock1 expression returned to baseline levels or below in ITD-FLT3− Ba/F cells following incubation in 50–100 ng/ml Cxcl12 for 4 h, it remained largely unaffected by Cxcl12 in ITD-FLT3+ cells (N51) (Fig. 4, B and C). Rock1 expression was significantly higher in all of the ITD-FLT3+ cells (N51, N73, and N78) incubated in Cxcl12 than in the corresponding ITD-FLT3− Ba/F cells (2.2 ± 0.5-, 4.2 ± 1.1-, and 1.4 ± 0.2-fold increases in the N51, N73, and N78 cells, respectively; p < 0.02; Fig. 4D). Similar to Rock1, the mRNA expression of Adducin2, a downstream effector of Rock1 (31), is significantly down-regulated by 100 ng/ml Cxcl12 in ITD-FLT3− cells. In contrast, Adducin2 mRNA was up-regulated by Cxcl12 in ITD-FLT3+ (N51) cells (Fig. 4E). Similar to mRNA for Rock1, Rock1 protein was transiently up-regulated by 1, 10, or 100 ng/ml CXcl12, reaching up to a 2.1 ± 0.3-fold higher level compared with the baseline (p < 0.03). However, Rock1 expression was consistently down-regulated over time in the control ITD-FLT3− cells, and it was significantly lower at 6 h (0.67 ± 0.1-fold, p < 0.01) compared with their peak level (Fig. 4F). In contrast, the baseline Rock1 protein was 2.3 ± 0.5-fold (p < 0.05) higher in ITD-FLT3+ cells compared with ITD-FLT3− cells, which was largely unaffected and remained elevated in the ITD-FLT3+ cells even after stimulation with Cxcl12 (Fig. 4F). Although Cxcl12 enhanced the phosphorylation of MYPT1, a downstream substrate of Rock1, in ITD-FLT3− and ITD-FLT3+ cells, its phosphorylation level was higher in ITD-FLT3+ cells after 60 min than in ITD-FLT3− cells (Fig. 4G). Similar to FL stimulation, ITD-FLT3 significantly increased Rock2 mRNA expression in Ba/F cells (Fig. 4H).
FIGURE 4.


ITD-FLT3-induced enhancement of cell migration toward Cxcl12 is mediated by blocking the down-regulation of Rock1. A, upper left panel shows the fold-increase in Rock1 mRNA expression in Ba/F3 cells expressing three different types of ITD-FLT3 (N51, N73, or N78) (*, p < 0.05 compared with the ITD-FLT3− control cells, n = 6). Mypt1 phosphorylation in control ITD-FLT3− and ITD-FLT3+ (N51) cells is shown below the bar graph. The top right panel shows a comparison of the Rock1 mRNA expression level between patients with ITD-FLT3+ AML (M3, M4, M5, and M6 cases, n = 34) and ITD-FLT3− AML (101 cases) from data deposited in a public gene expression database (GSE1159, www.ncbi.nlm.nih.gov, *, p < 0.05) (26). Bottom right panel shows the relative baseline migration of ITD-FLT3+ (N51) Ba/F3 cells in the presence of the Rock antagonist Y27632. The cells were pretreated with DMSO or 1 or 10 μm Y27632 for 1 h and then subjected to a migration assay (*, p < 0.05 compared with the DMSO control, n = 3). B, fold-change in Rock1 mRNA expression in ITD-FLT3+ (N51) cells stimulated with Cxcl12 relative to these cells prior to stimulation. The cells were incubated in 1 or 50 ng/ml Cxcl12 for 4 h (*, p < 0.05 compared with the cells prior to Cxcl12 stimulation, n = 3). C, relative expression of Rock1 mRNA in ITD-FLT3+ (N51) and ITD-FLT3− cells incubated in 10, 100, or 500 ng/ml Cxcl12 for 4 h (*, p < 0.05 compared with control ITD-FLT3− cells in the absence of Cxcl12 stimulation, n = 3). D, relative change in Rock1 mRNA expression in ITD-FLT3+ (N51, N73, and N78) cells or ITD-FLT3− cells incubated in Cxcl12 compared with control ITD-FLT3− cells in the absence of Cxcl12 stimulation (*, p < 0.05 compared with the ITD-FLT3− cells incubated in 100 ng/ml Cxcl12, n = 5). The cells were incubated in 100 ng/ml Cxcl12 for 4 h. E, relative change in Adducin2 mRNA expression in ITD-FLT3− and ITD-FLT3+ (N51) cells stimulated with Cxcl12. The cells were treated in the same manner as described in D (*, p < 0.05 compared with the ITD-FLT3− cells incubated in 100 ng/ml Cxcl12, n = 3). F, Rock1 protein expression in ITD-FLT3− and ITD-FLT3+ (N51) cells stimulated with 1 (left top), 10 (left bottom), or 100 ng/ml (right top) Cxcl12. Although Rock1 mRNA was down-regulated by Cxcl12 in the control ITD-FLT3− cells, we found that the down-regulation of Rock1 protein was not necessarily observed before 4 h as opposed to the earlier decline in Rock1 mRNA within 4 h. Therefore, the cells were incubated up to 6 h. Each lane contains the lysate obtained from 500,000 cells. The relative protein expression of Rock1 compared with actin protein was quantified via the densitometer in the Odyssey infrared imaging system (LI-COR Biosciences, Lincoln, NE) and is shown in the line graph below the blots. The relative expression of Rock1 protein in ITD-FLT3+ cells before and after stimulation with 1, 10, and 100 ng/ml Cxcl12 compared with those in ITD-Flt3− cells were averaged and are shown in the right bottom histogram (*, p < 0.05). G, Mypt1 phosphorylation (p-Mypt1) in ITD-FLT3− and ITD-FLT3+ (N51) cells is shown. The cells were incubated in 100 ng/ml Cxcl12 for 4 h. Each lane contains the lysate obtained from 500,000 cells. The relative expression of p-Mypt1 compared with actin was quantified via densitometry and is shown below the blot. H, relative change in the expression of Rock2 mRNA in ITD-FLT3+ (N51) cells compared with control ITD-FLT3− cells (*, p < 0.05, n = 3). I, left panel shows the percentage of cells that migrated toward Cxcl12 among the ITD-FLT3+ (N51) cells pretreated with a Rock inhibitor (H1152 or Y27632). The cells were pretreated with DMSO (control), 0.01, or 0.1 μm H1152 or 1 or 10 μm Y27632 for 1 h and then subjected to a migration assay toward 100 ng/ml Cxcl12 (*, p < 0.05 compared with the DMSO control, n = 5). Right panel indicates the relative reduction in cell migration toward Cxcl12 for ITD-FLT3− and ITD-FLT3+ (N51) cells that were transduced with two different shRNAs specific for Rock1 (Rock1-A or Rock1-B) compared with the corresponding cells transduced with control shRNA (*, p < 0.02, n = 3). A representative experiment using Rock1-A shRNA is shown in the inset. The protein expression of Rock1 is shown below the bar graph. J, percentage of cells that migrated toward Cxcl12 among the ITD-FLT3+ (N51) cells pretreated with DMSO or LY294002. The cells were pretreated with DMSO or 50 μm LY294002 for 1 h and then subjected to a migration assay toward 100 ng/ml Cxcl12 for 4 h (*, p < 0.05 compared with the DMSO-pretreated cells, n = 3). K, expression of Ccr2 in ITD-FLT3− and ITD-FLT3+ (N51) cells is shown in the top panel. Lower left bar graph shows the percentage of cells that migrated toward 5 ng/ml Ccl2 among the ITD-FLT3− and ITD-FLT3+ (N51) cells, which was quantified at 4 h (*, p < 0.05 compared with ITD-FLT3− cells; †, p < 0.05 compared with the ITD-FLT3+ cells without Ccl2 stimulation, n = 3). Lower right panel shows the relative expression of Rock1 mRNA in ITD-FLT3− and ITD-FLT3+ cells in response to 5 ng/ml CCL2 compared with that in the control ITD-FLT3− cells prior to stimulation (*, p < 0.05, n = 3).
Incubating ITD-FLT3+ Ba/F cells in the Rock inhibitors H1152 and Y27632 significantly and dose-dependently inhibited their migration toward Cxcl12 (Fig. 4I, left panel). Consistent with these results, two different shRNAs specific for Rock1 abrogated the enhanced migration of ITD-FLT3+ cells toward Cxcl12 (p < 0.03; Fig. 4I, right panel). These results indicate that Rock1 is responsible for the enhanced migration of ITD-FLT3+ cells toward Cxcl12. Consistent with the activation of Rock1 via the PI3K pathway (17) and similar to the inhibitory effects of Rock1 antagonists on cell migration, the PI3K inhibitor LY294002 reduced the enhanced migration of ITD-FLT3+ cells toward Cxcl12 (n = 3, p < 0.05; Fig. 4J).
Finally, the effects of ITD-FLT3 on cell migration in response to other chemokines were investigated. The protein expression level of Ccr2, a receptor of the chemokine Ccl2 (32), in ITD-Flt3+Ba/F cells was equivalent to that in ITD-FLT3− cells (Fig. 4K, top panel). Whereas the control ITD-FLT3− Ba/F3 cells failed to migrate toward 1, 5, 10, or 50 ng/ml Ccl2, ITD-FLT3 marginally but significantly enhanced the migration of Ba/F3 cells toward 5 ng/ml Ccl2 within 4 h. In ITD-FLT3− cells exposed to 5 ng/ml Ccl2, the mRNA expression of Rock1 continued to increase, rather than being down-regulated to the basal level within 4 h. However, in ITD-FLT3+Ba/F3 cells, Rock1 expression was down-regulated within 30 min but returned to normal at 4 h in response to 5 ng/ml Ccl2 (Fig. 4K). Based on the data presented above, we conclude that ITD-FLT3 enhances both basal and Cxcl12-induced cell migration by modulating the expression of Rock.
DISCUSSION
ITD-FLT3 is associated with a refractory phenotype and extremely poor prognosis in patients with AML (3, 4). The chemoresistance of ITD-FLT3+ AML cells may be a consequence of their enhanced chemotaxis toward Cxcl12, which is expressed in the therapy-protective bone marrow niche. Therefore, identifying the molecular and cellular mechanisms underlying the migration of ITD-FLT3+ cells toward Cxcl12 will aid in the development of novel strategies to eradicate resistant ITD-FLT3+ AML cells that are protected in the bone marrow niche. Our study indicates that the superior migratory response to Cxcl12 mediated by ITD-FLT3 is not likely to be due to quantitative increases but rather to qualitative changes in Cxcr4 signaling. Among the differentially expressed genes, Rock1 expression was up-regulated shortly after stimulation with Cxcl12, but it was down-regulated thereafter in control ITD-FLT3− cells. However, in ITD-FLT3+ cells, Rock1 expression remained consistently elevated following incubation in Cxcl12 compared with ITD-FLT3− cells, demonstrating that the down-regulation of Rock1, which is typically induced by Cxcl12, was blocked by ITD-FLT3. Antagonizing Rock1 abrogated the ITD-FLT3- or FL-mediated enhancement of cell migration toward Cxcl12, indicating that Rock1 mediates the enhancement of cell migration toward Cxcl12 via both normal and oncogenic FLT3 signaling. Taken together, ITD-FLT3 affects the cellular and molecular responses to Cxcl12 stimulation and augments cell migration toward Cxcl12 by blocking the down-regulation of Rock1 expression.
The role of ITD-FLT3 in cell migration is supported by the altered expression of genes that are involved in trans-endothelial migration, the actin cytoskeleton, and cell motility in ITD-FLT3+ Ba/F3 cells and a published primary ITD-FLT3+ AML profile compared with the expression of their ITD-FLT3− counterparts (Fig. 2A). Among the genes that are associated with cell migration, the expression of Cxcr4 was down-regulated by ITD-FLT3 (Fig. 1D). Whereas the down-regulation of Cxcr4 decreases Cxcl12/Cxcr4 signaling activity, ITD-FLT3 enhanced cell migration toward Cxcl12, suggesting that the enhanced migration toward Cxcl12 was unlikely caused by a quantitative increase in Cxcl12/Cxcr4 signaling. This implication is supported by the lack of enhancement in Cxcl12-induced calcium mobilization (Fig. 1E) or Cxcl12-induced phosphorylation of Erkp42/p44 and Creb by ITD-FLT3 (Fig. 1F). The very low expression of Cxcr7 and the significant reduction in Cxcl12-induced migration in ITD-FLT3+ cells in the presence of a Cxcr4 antagonist or a neutralizing antibody against Cxcr4 suggest that the ITD-FLT3-induced enhancement in cell migration toward Cxcl12 is mediated by Cxcr4 rather than Cxcr7. This finding is supported by the failure of CXCR7+, ITD-FLT3+ MV4-11 AML cell migration in response to a CXCR7 agonist. Our mRNA microarray analysis demonstrated that ITD-FLT3 modulates the Cxcl12-induced changes in gene expression involving pathways that are functionally distinct from those in ITD-FLT3− cells, suggesting that ITD-FLT3 qualitatively modulates Cxcl12/Cxcr4 signaling. These results also imply that the specific molecules that are differentially regulated by Cxcl12 in ITD-FLT3+ and ITD-FLT3− cells may be responsible for the aberrant migration of ITD-FLT3+ cells toward Cxcl12.
One molecule that is differentially modulated by Cxcl12 in ITD-FLT3− and ITD-FLT3+ cells is Rock1, which regulates the actin cytoskeleton, cell motility, and ITD-FLT3+ cell proliferation (17). Rock activity is known to be regulated by Cxcl12, but this regulation can be either stimulatory or inhibitory depending on the cell type and time course examined (18–21). In control cells lacking ITD-FLT3, both the mRNA and protein levels of Rock1 were transiently up-regulated and then returned to baseline or below following exposure to Cxcl12 (Figs. 3C and 4F). Transient up-regulation of Rock1 by Cxcl12 suggested that Rock1 is required for cell migration. The significant reductions in the migration of ITD-FLT3− cells toward Cxcl12 using chemical inhibitors or shRNA directed against Rock1 (Figs. 3B and 4I) indicate that Rock1 expression and activity are required for Cxcl12-induced cell migration. Although the kinetics of Rock1 mRNA and protein expression were not entirely aligned, the down-regulation of Rock1 mRNA expression was pronounced at higher Cxcl12 concentrations in ITD-FLT3− Ba/F3 cells, suggesting that this reduction in Rock1 mRNA expression requires sufficient activation of Cxcl12/Cxcr4 signaling. However, in contrast to Rock1 mRNA, the down-regulation of the Rock1 protein was delayed at a high Cxcl12 dose, suggesting that Cxcl12 may protect Rock1 protein from degradation. In normal hematopoietic cells, the initial exposure to Cxcl12 inhibits subsequent cell migration in response to additional Cxcl12 stimulation (33). Therefore, the down-regulation of Rock1 expression may represent one mechanism that underlies the desensitization of these cells to subsequent Cxcl12 stimulation. These results suggest that the down-regulation of Rock1 expression may represent a safeguard or auto-inhibitory mechanism that prevents excessive migration in normal hematopoietic cells (Fig. 5, left panel).
FIGURE 5.
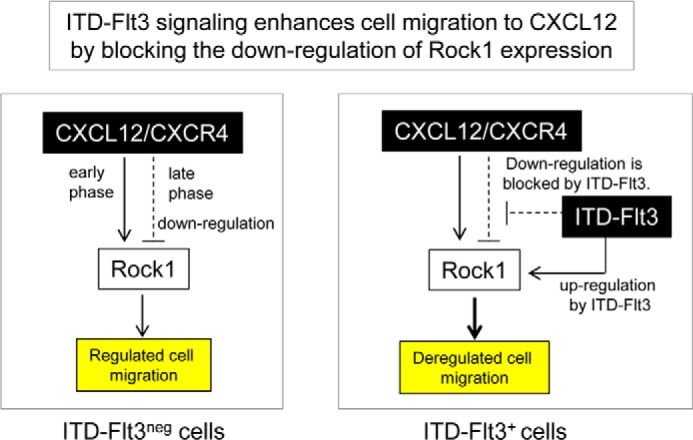
Suggested model for the molecular mechanism underlying ITD-FLT3-induced aberrant cell migration. We propose that that functional cross-talk between ITD-FLT3 and Cxcl12/Cxcr4 signaling leads to aberrant cell migration. In the absence of ITD-FLT3, Rock1 is required for cell migration toward Cxcl12, and its expression is transiently up-regulated but is subsequently down-regulated. The down-regulation of Rock1 at later stages may involve a mechanism that prevents excessive cell migration. In contrast, ITD-FLT3 mutations increase Rock1 expression and inhibit its down-regulation as normally induced in the control cells. Therefore, ITD-FLT3 mutations enhance cell migration toward Cxcl12 by blocking the down-regulation of Rock1 expression.
In contrast to Cxcl12, FL increased the Rock1 protein expression level in control cells, blocked the Cxcl12-induced down-regulation of Rock1 expression, and increased cell migration (Fig. 3E) (14). Similar to normal FLT3 signaling, Rock1 expression remained elevated following Cxcl12 stimulation in the presence of each of the three ITD-FLT3 mutations compared with in the control wild-type FLT3 (Fig. 4D), indicating that ITD-FLT3 antagonizes the Cxcl12-induced down-regulation of Rock1 expression. The increased level of Rock1 expression in the ITD-FLT3+ cells compared with the ITD-FLT3− cells is consistent with the finding of elevated Mypt1 phosphorylation after a 4-h Cxcl12 stimulation period (Fig. 4G). These results indicate that ITD-FLT3 stimulates the expression of Rock1 and antagonizes the down-regulation of Rock1 that normally occurs in control cells (Fig. 5, right panel). Moreover, antagonizing Rock1 restored the migration of ITD-FLT3+ Ba/F3 cells toward Cxcl12 (Fig. 4I), indicating that Rock1 is also necessary for the ITD-FLT3-induced enhancement in cell migration toward Cxcl12. The significant inhibition of Cxcl12-induced migration in ITD-FLT3+ cells that was caused by the PI3K inhibitor (Fig. 4J) is consistent with the concept that Rock1 is a downstream target of the PI3K pathway (17). These data provide evidence that the Cxcl12/Cxcr4 and ITD-FLT3 signaling pathways functionally interact via Rock1 and that ITD-FLT3 enhances cell migration toward Cxcl12 by blocking the down-regulation of Rock1 expression (Fig. 5, right panel). Therefore, Rock1 contributes to the aberrant migration of ITD-FLT3+ cells in addition to regulating their proliferation (17). Adducin2, a downstream effector of Rock (31), displayed the same expression profile as Rock1 in response to Cxcl12 in the control ITD-FLT3− cells and in the ITD-FLT3+ cells (Fig. 4E). We also found that the mRNA expression of the microtubule-associated proteins Tau, endophilin, and doublecortin, all of which are known to be effector molecules of Rock1 (31), are differentially regulated by Cxcl12 between ITD-FLT3+ (N51) and control ITD-FLT3− cells. Although it remains to be determined whether these downstream effectors are also functionally involved in the enhanced migratory response to Cxcl12 in ITD-FLT3+ cells, these data support that Rock1 signaling is differentially modulated by Cxcl12 in the presence of ITD-FLT3 compared with wild-type FLT3. In addition to Cxcl12, cell migration toward Ccl2 was also enhanced by ITD-FLT3 (Fig. 4K), indicating that the enhanced chemotaxis induced by ITD-FLT3 is not specific to Cxcl12. However, in contrast to Cxcl12, Rock1 expression was up-regulated by Ccl2 in control ITD-FLT3− cells but was transiently down-regulated by Ccl2 in ITD-Flt3+ cells. The down-regulation of Rock1 expression in response to Ccl2 contrasts with the results for Cxcl12 in ITD-FLT3+ cells, suggesting that the involvement of Rock1 in cell migration may differ between Ccl2 and Cxcl12. These data indicate that although the ITD-FLT3-induced enhancement in cell migration toward chemokines is not specific to Cxcl12/Cxcr4, the mechanism underlying Rock1 down-regulation in Cxcl12/Cxcr4 signaling is not always induced by ITD-FLT3 in other chemokine signaling pathways. Therefore, blocking the negative feedback mechanism regulating Rock1 expression does not merely represent a global effect of ITD-FLT3.
In summary, ITD-FLT3 mutations modulate Cxcl12/Cxcr4 signaling pathways via a functionally distinct mechanism from that of wild-type Flt3, and these mutations augment chemotaxis toward Cxcl12 by blocking the down-regulation of Rock1. The dual roles of Rock1 in aberrant proliferation (17) and migration toward Cxcl12 as a functional effector of ITD-FLT3 suggest that Rock1 plays a crucial role in the resistant phenotype by modulating the interaction between ITD-FLT3+ AML cells and the bone marrow microenvironment, in addition to regulating AML cell proliferation (17). In this regard, antagonizing Rock1 (34) may represent an additional approach to the treatment of patients with AML harboring ITD-Flt3.
Supplementary Material
Acknowledgment
We thank Midori Furui for technical assistance.
This work was supported by research support funds from the Medical and Pharmaceutical Research Fund, the Sankyo Biomedical Research Foundation, the Mitsubishi Mother and Pharma Research Foundation, the Japanese Leukemia Research Fund, the Naito Foundation, Grants-in-aid for Scientific Research 20390298 and 25461593 (to S. F.), and Grant-in-aid for Young Investigators 24791064 (to C. O.) from the Japanese Society for the Promotion of Science.

This article contains supplemental Tables S1–S3.
- AML
- acute myeloid leukemia
- Rock
- Rho-associated kinase
- FL
- Flt3 ligand
- CREB
- cAMP-response element-binding protein.
REFERENCES
- 1. Fiedler W., Mesters R., Tinnefeld H., Loges S., Staib P., Duhrsen U., Flasshove M., Ottmann O. G., Jung W., Cavalli F., Kuse R., Thomalla J., Serve H., O'Farrell A. M., Jacobs M., Brega N. M., Scigalla P., Hossfeld D. K., Berdel W. E. (2003) A phase II clinical study of SU5416 in patients with refractory acute myeloid leukemia. Blood 102, 2763–2767 [DOI] [PubMed] [Google Scholar]
- 2. Smith B. D., Levis M., Beran M., Giles F., Kantarjian H., Berg K., Murphy K. M., Dauses T., Allebach J., Small D. (2004) Single-agent CEP-701, a novel FLT3 inhibitor, shows biologic and clinical activity in patients with relapsed or refractory acute myeloid leukemia. Blood 103, 3669–3676 [DOI] [PubMed] [Google Scholar]
- 3. Stirewalt D. L., Radich J. P. (2003) The role of FLT3 in haematopoietic malignancies. Nat. Rev. Cancer 3, 650–665 [DOI] [PubMed] [Google Scholar]
- 4. Gilliland D. G., Griffin J. D. (2002) The roles of FLT3 in hematopoiesis and leukemia. Blood 100, 1532–1542 [DOI] [PubMed] [Google Scholar]
- 5. Saito Y., Uchida N., Tanaka S., Suzuki N., Tomizawa-Murasawa M., Sone A., Najima Y., Takagi S., Aoki Y., Wake A., Taniguchi S., Shultz L. D., Ishikawa F. (2010) Induction of cell cycle entry eliminates human leukemia stem cells in a mouse model of AML. Nat. Biotechnol. 28, 275–280 [DOI] [PMC free article] [PubMed] [Google Scholar]
- 6. Lane S. W., Scadden D. T., Gilliland D. G. (2009) The leukemic stem cell niche: current concepts and therapeutic opportunities. Blood 114, 1150–1157 [DOI] [PMC free article] [PubMed] [Google Scholar]
- 7. Voermans C., van Heese W. P., de Jong I., Gerritsen W. R., van Der Schoot C. E. (2002) Migratory behavior of leukemic cells from acute myeloid leukemia patients. Leukemia. 16, 650–657 [DOI] [PubMed] [Google Scholar]
- 8. Tavor S., Petit I., Porozov S., Avigdor A., Dar A., Leider-Trejo L., Shemtov N., Deutsch V., Naparstek E., Nagler A., Lapidot T. (2004) CXCR4 regulates migration and development of human acute myelogenous leukemia stem cells in transplanted NOD/SCID mice. Cancer Res. 64, 2817–2824 [DOI] [PubMed] [Google Scholar]
- 9. Möhle R., Schittenhelm M., Failenschmid C., Bautz F., Kratz-Albers K., Serve H., Brugger W., Kanz L. (2000) Functional response of leukaemic blasts to stromal cell-derived factor-1 correlates with preferential expression of the chemokine receptor CXCR4 in acute myelomonocytic and lymphoblastic leukaemia. Br. J. Haematol. 110, 563–572 [DOI] [PubMed] [Google Scholar]
- 10. Spoo A. C., Lübbert M., Wierda W. G., Burger J. A. (2007) CXCR4 is a prognostic marker in acute myelogenous leukemia. Blood 109, 786–791 [DOI] [PubMed] [Google Scholar]
- 11. Rombouts E. J., Pavic B., Löwenberg B., Ploemacher R. E. (2004) Relation between CXCR-4 expression, Flt3 mutations, and unfavorable prognosis of adult acute myeloid leukemia. Blood 104, 550–557 [DOI] [PubMed] [Google Scholar]
- 12. Nervi B., Ramirez P., Rettig M. P., Uy G. L., Holt M. S., Ritchey J. K., Prior J. L., Piwnica-Worms D., Bridger G., Ley T. J., DiPersio J. F. (2009) Chemosensitization of acute myeloid leukemia (AML) following mobilization by the CXCR4 antagonist AMD3100. Blood 113, 6206–6214 [DOI] [PMC free article] [PubMed] [Google Scholar]
- 13. Uy G. L., Rettig M. P., Motabi I. H., McFarland K., Trinkaus K. M., Hladnik L. M., Kulkarni S., Abboud C. N., Cashen A. F., Stockerl-Goldstein K. E., Vij R., Westervelt P., DiPersio J. F. (2012) A phase 1/2 study of chemosensitization with the CXCR4 antagonist plerixafor in relapsed or refractory acute myeloid leukemia. Blood 119, 3917–3924 [DOI] [PMC free article] [PubMed] [Google Scholar]
- 14. Fukuda S., Broxmeyer H. E., Pelus L. M. (2005) Flt3 ligand and the Flt3 receptor regulate hematopoietic cell migration by modulating the SDF-1α(CXCL12)/CXCR4 axis. Blood 105, 3117–3126 [DOI] [PubMed] [Google Scholar]
- 15. Jacobi A., Thieme S., Lehmann R., Ugarte F., Malech H. L., Koch S., Thiede C., Müller K., Bornhäuser M., Ryser M., Brenner S. (2010) Impact of CXCR4 inhibition on FLT3-ITD-positive human AML blasts. Exp. Hematol. 38, 180–190 [DOI] [PMC free article] [PubMed] [Google Scholar]
- 16. Zeng Z., Shi Y. X., Samudio I. J., Wang R. Y., Ling X., Frolova O., Levis M., Rubin J. B., Negrin R. R., Estey E. H., Konoplev S., Andreeff M., Konopleva M. (2009) Targeting the leukemia microenvironment by CXCR4 inhibition overcomes resistance to kinase inhibitors and chemotherapy in AML. Blood 113, 6215–6224 [DOI] [PMC free article] [PubMed] [Google Scholar]
- 17. Mali R. S., Ramdas B., Ma P., Shi J., Munugalavadla V., Sims E., Wei L., Vemula S., Nabinger S. C., Goodwin C. B., Chan R. J., Traina F., Visconte V., Tiu R. V., Lewis T. A., Stern A. M., Wen Q., Crispino J. D., Boswell H. S., Kapur R. (2011) Rho kinase regulates the survival and transformation of cells bearing oncogenic forms of KIT, FLT3, and BCR-ABL. Cancer Cell 20, 357–369 [DOI] [PMC free article] [PubMed] [Google Scholar]
- 18. Arakawa Y., Bito H., Furuyashiki T., Tsuji T., Takemoto-Kimura S., Kimura K., Nozaki K., Hashimoto N., Narumiya S. (2003) Control of axon elongation via an SDF-1 alpha/Rho/mDia pathway in cultured cerebellar granule neurons. J. Cell Biol. 161, 381–391 [DOI] [PMC free article] [PubMed] [Google Scholar]
- 19. Moyer R. A., Wendt M. K., Johanesen P. A., Turner J. R., Dwinell M. B. (2007) Rho activation regulates CXCL12 chemokine stimulated actin rearrangement and restitution in model intestinal epithelia. Lab. Invest. 87, 807–817 [DOI] [PMC free article] [PubMed] [Google Scholar]
- 20. Struckhoff A. P., Vitko J. R., Rana M. K., Davis C. T., Foderingham K. E., Liu C. H., Vanhoy-Rhodes L., Elliot S., Zhu Y., Burow M., Worthylake R. A. (2010) Dynamic regulation of ROCK in tumor cells controls CXCR4-driven adhesion events. J. Cell Sci. 123, 401–412 [DOI] [PMC free article] [PubMed] [Google Scholar]
- 21. Vicente-Manzanares M., Cabrero J. R., Rey M., Pérez-Martínez M, Ursa A., Itoh K., Sánchez-Madrid F. (2002) A role for the Rho-p160 Rho coiled-coil kinase axis in the chemokine stromal cell-derived factor-1 α-induced lymphocyte actomyosin and microtubular organization and chemotaxis. J. Immunol. 168, 400–410 [DOI] [PubMed] [Google Scholar]
- 22. Kelly L. M., Liu Q., Kutok J. L., Williams I. R., Boulton C. L., Gilliland D. G. (2002) FLT3 internal tandem duplication mutations associated with human acute myeloid leukemias induce myeloproliferative disease in a murine bone marrow transplant model. Blood 99, 310–318 [DOI] [PubMed] [Google Scholar]
- 23. Huang da W., Sherman B. T., Lempicki R. A. (2009) Systematic and integrative analysis of large gene lists using DAVID bioinformatics resources. Nat. Protoc. 4, 44–57 [DOI] [PubMed] [Google Scholar]
- 24. Cline M. S., Smoot M., Cerami E., Kuchinsky A., Landys N., Workman C., Christmas R., Avila-Campilo I., Creech M., Gross B., Hanspers K., Isserlin R., Kelley R., Killcoyne S., Lotia S., Maere S., Morris J., Ono K., Pavlovic V., Pico A. R., Vailaya A., Wang P. L., Adler A., Conklin B. R., Hood L., Kuiper M., Sander C., Schmulevich I., Schwikowski B., Warner G. J., Ideker T., Bader G. D. (2007) Integration of biological networks and gene expression data using Cytoscape. Nat. Protoc. 2, 2366–2382 [DOI] [PMC free article] [PubMed] [Google Scholar]
- 25. Fukuda S., Singh P., Moh A., Abe M., Conway E. M., Boswell H. S., Yamaguchi S., Fu X. Y., Pelus L. M. (2009) Survivin mediates aberrant hematopoietic progenitor cell proliferation and acute leukemia in mice induced by internal-tandem-duplication of Flt3. Blood 114, 394–403 [DOI] [PMC free article] [PubMed] [Google Scholar]
- 26. Valk P. J., Verhaak R. G., Beijen M. A., Erpelinck C. A., Barjesteh van Waalwijk van Doorn-Khosrovani S., Boer J. M., Beverloo H. B., Moorhouse M. J., van der Spek P. J., Löwenberg B., Delwel R. (2004) Prognostically useful gene-expression profiles in acute myeloid leukemia. N. Engl. J. Med. 350, 1617–1628 [DOI] [PubMed] [Google Scholar]
- 27. Smith C. C., Wang Q., Chin C. S., Salerno S., Damon L. E., Levis M. J., Perl A. E., Travers K. J., Wang S., Hunt J. P., Zarrinkar P. P., Schadt E. E., Kasarskis A., Kuriyan J., Shah N. P. (2012) Validation of ITD mutations in FLT3 as a therapeutic target in human acute myeloid leukaemia. Nature 485, 260–263 [DOI] [PMC free article] [PubMed] [Google Scholar]
- 28. Burns J. M., Summers B. C., Wang Y., Melikian A., Berahovich R., Miao Z., Penfold M. E., Sunshine M. J., Littman D. R., Kuo C. J., Wei K., McMaster B. E., Wright K., Howard M. C., Schall T. J. (2006) A novel chemokine receptor for SDF-1 and I-TAC involved in cell survival, cell adhesion, and tumor development. J. Exp. Med. 203, 2201–2213 [DOI] [PMC free article] [PubMed] [Google Scholar]
- 29. Choi Y. H., Burdick M. D., Strieter B. A., Mehrad B., Strieter R. M. (2014) CXCR4, but not CXCR7, discriminates metastatic behavior in non-small cell lung cancer cells. Mol. Cancer Res. 12, 38–47 [DOI] [PMC free article] [PubMed] [Google Scholar]
- 30. Wijtmans M., Maussang D., Sirci F., Scholten D. J., Canals M., Mujić-Delić A., Chong M., Chatalic K. L., Custers H., Janssen E., de Graaf C., Smit M. J., de Esch I. J., Leurs R. (2012) Synthesis, modeling and functional activity of substituted styrene-amides as small-molecule CXCR7 agonists. Eur. J. Med. Chem. 51, 184–192 [DOI] [PubMed] [Google Scholar]
- 31. Amano M., Nakayama M., Kaibuchi K. (2010) Rho-kinase/ROCK: A key regulator of the cytoskeleton and cell polarity. Cytoskeleton 67, 545–554 [DOI] [PMC free article] [PubMed] [Google Scholar]
- 32. Ji Z., Fan Z., Zhang Y., Yu R., Yang H., Zhou C., Luo J., Ke Z. J. (2014) Thiamine deficiency promotes T cell infiltration in experimental autoimmune encephalomyelitis: the involvement of CCL2. J. Immunol. 193, 2157–2167 [DOI] [PMC free article] [PubMed] [Google Scholar]
- 33. Basu S., Broxmeyer H. E. (2005) Transforming growth factor-β1 modulates responses of CD34+ cord blood cells to stromal cell-derived factor-1/CXCL12. Blood 106, 485–493 [DOI] [PMC free article] [PubMed] [Google Scholar]
- 34. Fukumoto Y., Yamada N., Matsubara H., Mizoguchi M., Uchino K., Yao A., Kihara Y., Kawano M., Watanabe H., Takeda Y., Adachi T., Osanai S., Tanabe N., Inoue T., Kubo A., Ota Y., Fukuda K., Nakano T., Shimokawa H. (2013) Double-blind, placebo-controlled clinical trial with a rho-kinase inhibitor in pulmonary arterial hypertension. Circ. J. 77, 2619–2625 [DOI] [PubMed] [Google Scholar]
Associated Data
This section collects any data citations, data availability statements, or supplementary materials included in this article.