Background: The catalytic A domain of Ca2+-ATPase moves substantially and connects to distant Ca2+ sites through transmembrane helices M1 and M2.
Results: Systematic mutation along M2 profoundly and differentially affects cytoplasmic and luminal gating and catalysis.
Conclusion: M2 plays region- and catalytic step-specific roles in Ca2+ transport.
Significance: M2 is a conduit for coupling A domain movements to transport ion gating.
Keywords: Calcium ATPase, Enzyme Kinetics, Enzyme Mutation, Enzyme Structure, Phosphoryl Transfer, Domain Motion, Phosphoenzyme Intermediate, Sarco(endo)plasmic Reticulum, Transmembrane Helix
Abstract
The actuator (A) domain of sarco(endo)plasmic reticulum Ca2+-ATPase not only plays a catalytic role but also undergoes large rotational movements that influence the distant transport sites through connections with transmembrane helices M1 and M2. Here we explore the importance of long helix M2 and its junction with the A domain by disrupting the helix structure and elongating with insertions of five glycine residues. Insertions into the membrane region of M2 and the top junctional segment impair Ca2+ transport despite reasonable ATPase activity, indicating that they are uncoupled. These mutants fail to occlude Ca2+. Those at the top segment also exhibited accelerated phosphoenzyme isomerization E1P → E2P. Insertions into the middle of M2 markedly accelerate E2P hydrolysis and cause strong resistance to inhibition by luminal Ca2+. Insertions along almost the entire M2 region inhibit the dephosphorylated enzyme transition E2 → E1. The results pinpoint which parts of M2 control cytoplasm gating and which are critical for luminal gating at each stage in the transport cycle and suggest that proper gate function requires appropriate interactions, tension, and/or rigidity in the M2 region at appropriate times for coupling with A domain movements and catalysis.
Introduction
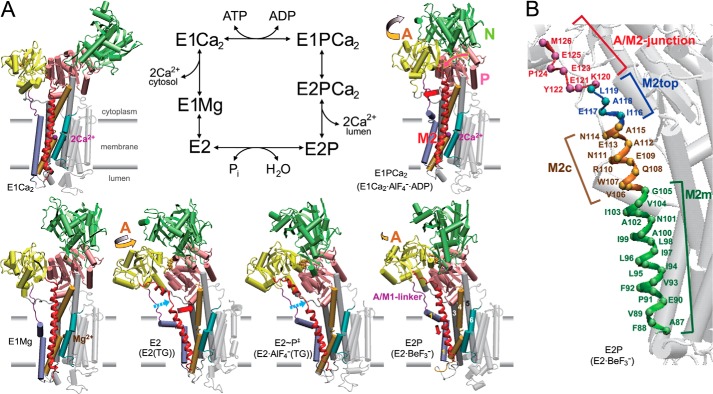
Sarco(endo)plasmic reticulum Ca2+-ATPase (SERCA1a),2 a representative member of the P-type ion transporting ATPases, catalyzes Ca2+ transport coupled with ATP hydrolysis (Fig. 1A) (for recent reviews, see Refs. 1–3). The enzyme is activated by the binding of two cytoplasmic Ca2+ ions at the cytoplasmic facing high affinity transport sites (E2 to E1Ca2 in Fig. 1) and autophosphorylated at Asp351 with MgATP to form an ADP-sensitive phosphoenzyme (E1P), which reacts with ADP to regenerate ATP in the reverse reaction. Upon E1P formation, the two bound Ca2+ are occluded in the transport sites (E1PCa2). The subsequent isomeric transition to the ADP-insensitive E2P form results in rearrangements of the Ca2+ binding sites to deocclude Ca2+, open the release path, and reduce the affinity, thus releasing Ca2+ into the lumen. Finally, the Asp351-acylphosphate in E2P is hydrolyzed to form a Ca2+-unbound inactive E2 state. During the hydrolysis, the Ca2+ release path is closed, thereby preventing possible luminal Ca2+ access to the transport sites and Ca2+ leakage.
FIGURE 1.
Reaction cycle and structural changes of Ca2+-ATPase. A, the structural changes are modeled on the crystal structures E1Ca2·AlF4−·ADP as the E1∼P·ADP·Ca2 analog (PDB code 1T5T (10)), E2·BeF3− as the E2P ground state analog (7) (PDB code 2ZBE (11)), E2·AlF4−(TG) as the transition state analog for E2P hydrolysis (7) (PDB 2ZBG (11)), E2(TG) as the E2 state fixed with thapsigargin (PDB 1IWO (6)), E1Mg2+ (PDB 3W5A (14)), and E1Ca2 (PDB 1SU4 (4)). The structures are aligned with the static M8–M10 helices. The N, P, and A domains and M1–M6 helices are colored as indicated. The approximate position of the membrane is shown by gray lines. The binding sites for two Ca2+ (purple spheres) consist of residues on M4, M5, M6, and M8. The yellow, pink, and red arrows indicate the approximate motions of the A and P domains and M2 (depicted in red), respectively, to the next structural state during the EP processing (isomerization and hydrolysis) and the E2 → E1 transition. The broken light blue arrow indicates the unwound M2 part. B, the regions of M2 are named as M2m (transmembrane part), M2c (cytoplasmic part), M2top (top part), and A/M2-junction (junction with the A domain) and indicated with different colors on the α-carbon of residues.
In the transport cycle, the three cytoplasmic domains N, P, and A undergo large movements and change their organizational state, a repositioning that is coupled to rearrangements in transmembrane helices and thereby changes in the transport sites (1–15). Most remarkable is the motion of the A domain, which functions in cytoplasmic and luminal gating to regulate Ca2+ binding and release as well as the E2P hydrolysis. The critical importance of the M1/M2 segment, which forms a V-shaped rigid body connected with the A domain, for luminal gating is nicely demonstrated by the crystal structures of catalytic intermediates with bound substrate analogs (9, 11). The long helix M2 connects directly with the A domain at their junction (A/M2-junction) and moves largely together with the A domain and also changes its secondary structure, unwinding/rewinding with consequent length changes, during the Ca2+ transport cycle (Fig. 1A). Notably, a long helix structure of M2 and the A domain motions are common features in P-type ion-transporting ATPases (16–20). With the Ca2+-ATPase, we previously demonstrated (21, 22) that Tyr122 and Leu119 at the A/M2-junction and the top part of M2 (M2top) form a hydrophobic interaction network, which includes a Tyr122-hydrophobic cluster (an interaction with the P domain (Val706/Val726), with the loop connecting the A domain and M3 (A/M3-linker, Ile232), and with the A domain (Ile179/Leu180) in E2P) and that this formation is critical for stabilizing E2P structure with the luminal gate open and the potential for hydrolytic activity at the catalytic site. However, the importance of other M2 regions as well as of the long M2 helix structure itself has not yet been fully explored.
In this study, we focus on each region of the long helix M2: transmembrane M2m, cytoplasmic M2c, M2top, and A/M2-junction (Fig. 1B). We explored their roles and the functional significance of the changes in secondary structure and length for the coupling of the different conformational steps that are required to efficiently convert the chemical energy of ATP hydrolysis into the changes in accessibility, orientation, and affinity of the Ca2+ binding transport sites.
In extensive preliminary experiments, we first introduced a series of mutations at various positions throughout: insertions of 1–5 glycine residues, deletions of 1–4 successive residues, glycine substitutions of 2 or 3 successive residues, and some specific substitutions. In detailed kinetic analyses, we found that results were most clear with the insertions of five glycine residues (5Gis), which disrupt the helix structure and elongates, showing profound region-specific and catalytic step-specific effects. Therefore, we present here the results obtained for the 5Gi insertions. Our results demonstrate that different parts of the A/M2 link play a critical role in synchronizing gating of the two Ca2+ at the transport sites on both sides of the membrane, and each is therefore part of the mechanism for coupling catalytic and transport site structural events. M2 and its connection with the A domain have a role distinct from that of the A/M1′-linker loop (23–25), although both are needed to coordinate coupling.
EXPERIMENTAL PROCEDURES
Mutagenesis and Expression
The pMT2 expression vector (26) carrying rabbit SERCA1a cDNA with a desired mutation was constructed as described previously (24). Transfection of pMT2 DNA into COS-1 cells and preparation of microsomes from the cells were performed as described (27). The amount of expressed SERCA1a was quantified by a sandwich enzyme-linked immunosorbent assay (28).
Ca2+-ATPase Activity and Ca2+ Transport Activity
Activities of expressed SERCA1a were obtained essentially as described previously (29). The rate of ATP hydrolysis was determined at 25 °C in a mixture containing 1–5 μg of microsomal protein, 0.1 mm [γ-32P]ATP, 0.1 m KCl, 7 mm MgCl2, 0.1 mm CaCl2, 5 mm potassium oxalate, and 50 mm MOPS/Tris (pH 7.0). The Ca2+-ATPase activity of expressed SERCA1a was obtained by subtracting the ATPase activity determined in the presence of 1 μm thapsigargin (TG), a specific inhibitor of SERCA, with conditions otherwise as above. The rate of Ca2+ transport was determined with 45Ca2+ and nonradioactive ATP, otherwise as above. The Ca2+ transport activity of expressed SERCA1a was obtained by subtracting the activity determined in the presence of 1 μm TG, with conditions otherwise as above.
Formation and Hydrolysis of EP
Phosphorylation of SERCA1a in microsomes with [γ-32P]ATP or 32Pi and dephosphorylation of 32P-labeled SERCA1a were performed under conditions described in the legends to Figs. 4–9. The reaction was quenched with ice-cold trichloroacetic acid containing Pi. Precipitated proteins were separated by 5% SDS-PAGE at pH 6.0 according to Weber and Osborn (30). The radioactivity associated with the separated Ca2+-ATPase was quantified by digital autoradiography as described (31). The amount of EP in expressed SERCA1a was obtained by subtracting the background radioactivity determined in the presence of 1 μm TG, with conditions otherwise as above.
FIGURE 4.
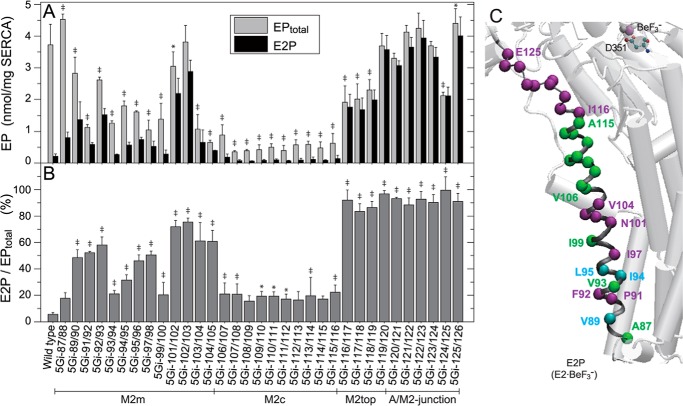
Total amount of EP (EPtotal) at steady state and E2P fraction. A, microsomes expressing wild type or the 5Gi mutant were phosphorylated with [γ-32P]ATP at 0 °C for 1 min in 50 μl of a mixture containing 1–5 μg of microsomal protein, 10 μm [γ-32P]ATP, 1 μm A23187, 0.1 m KCl, 7 mm MgCl2, 0.1 mm CaCl2, and 50 mm MOPS/Tris (pH 7.0). The EPtotal formed (gray bars) was determined by acid quenching. For determination of E2P (closed bars), an equal volume of a mixture containing 2 mm ADP, 1 μm A23187, 0.1 m KCl, 7 mm MgCl2, 10 mm EGTA, and 50 mm MOPS/Tris (pH 7.0) was added to the above phosphorylation mixture, and the reaction was quenched at 1 s after the ADP addition. ADP-sensitive EP (E1P) disappeared entirely within 1 s after the ADP addition. B, the E2P fraction in EPtotal (E1P plus E2P) is shown. Statistical significance compared with the wild type is shown for EPtotal (A) and for E2P/EPtotal (B): *, p < 0.05; ‡, p < 0.01. C, the mutation effects of residues in B are visualized with α-carbon coloring: green, E2P/EPtotal less than 30% (almost no or slight E2P increase); light blue, 30–50% (moderate increase); purple, higher than 50% (marked increase). Error bars, S.D.
FIGURE 5.
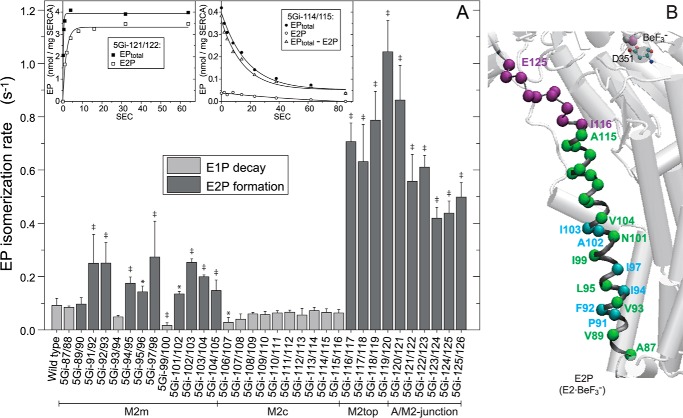
EP isomerization rate. A, for the wild type and mutants that accumulate mostly E1P at steady state (E2P less than 30% of EPtotal; cf. Fig. 4), the E1P to E2P isomerization rate was determined by E1P decay kinetics, which represent the rate-limiting E1P to E2P isomerization (mutant 5Gi-114/115 (right inset) is a typical example). Here, the Ca2+-ATPase was first phosphorylated with [γ-32P]ATP at 0 °C for 1 min as in Fig. 4; phosphorylation was terminated by Ca2+ removal and the addition of an equal volume of a buffer containing 10 mm EGTA, 0.1 m KCl, 7 mm MgCl2, and 50 mm MOPS/Tris (pH 7.0) at 0 °C; and the amounts of EPtotal and E2P were determined at the indicated times. The amount of E1P was calculated by subtracting E2P from EPtotal (EPtotal − E2P). Solid lines show the least squares fit to a single exponential, and the E1P decay rates thus obtained are shown in the main panel (light gray bar). For the mutants that accumulate E2P more than 30% of EPtotal (cf. Fig. 4), the EP isomerization rate was determined as the apparent rate of E2P formation from E1P to reach steady state as follows (mutant 5Gi-121/122 (left inset) is a typical example). Here, the Ca2+-ATPase was phosphorylated for the indicated periods after ATP addition, and the amounts of EPtotal and E2P were determined; otherwise, conditions were as described above. The formation of EP (EPtotal, representing E1PCa2 formation from E1Ca2) was very fast (reaching a steady state within ∼1 s) and was followed by E2P formation from E1PCa2. Solid lines show the least squares fit to a single exponential, and the apparent rates of E2P formation are shown in the main panel (dark gray bar). Statistical significance compared with the wild type is shown: *, p < 0.05; ‡, p < 0.01. B, the mutation effects of residues in A are visualized with α-carbon coloring: green, transition rate less than 0.15 s−1 (almost no effect or only a slight effect); light blue, 0.15–0.3 s−1 (moderate acceleration); purple, higher than 0.3 s−1 (marked acceleration). Error bars, S.D.
FIGURE 6.
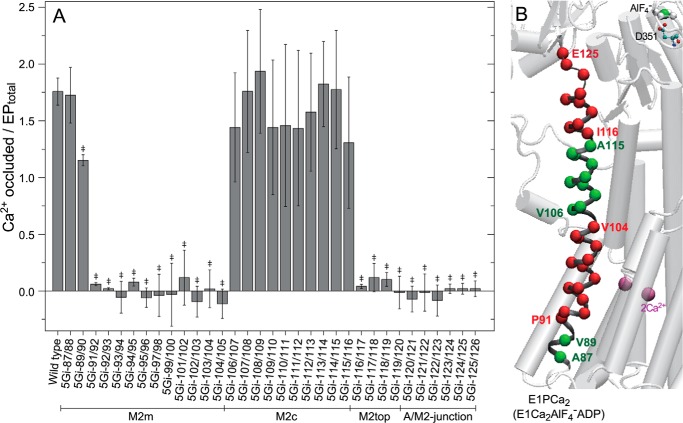
Ca2+ occlusion in EP. A, phosphorylation was performed with ATP in 10 μm 45Ca2+; otherwise conditions were as in Fig. 4. The amount of Ca2+ occluded was determined as described under “Experimental Procedures” and is shown as the value relative to EPtotal (mean ± S.D. (n = 8–18)). Statistical significance compared with the wild type is shown: *, p < 0.05; ‡, p < 0.01. B, the mutation effects of residues in A are visualized with α-carbon coloring; green, Ca2+ occluded/EPtotal above 1.0; red, below 0.15. Error bars, S.D.
FIGURE 7.
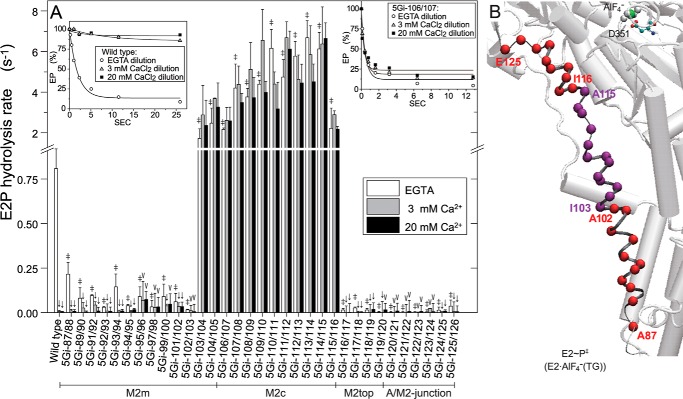
E2P hydrolysis and luminal Ca2+-induced inhibition. A, microsomes expressing wild type or mutant were phosphorylated with 32Pi at 25 °C for 10 min in 5 μl of a mixture containing 1–5 μg of microsomal protein, 0.1 mm 32Pi, 1 μm A23187, 0.2 mm EGTA, 7 mm MgCl2, 50 mm MOPS/Tris (pH 7.0), and 35% (v/v) Me2SO. The mixture was then cooled and diluted at 0 °C by the addition of 95 μl of a mixture containing 2.1 mm non-radioactive Pi, 105 mm KCl, 7 mm MgCl2, 50 mm MOPS/Tris (pH 7.0), and 3 mm EGTA (open bar) or 3.2 mm (gray bar) and 21.1 mm (closed bar) CaCl2 in place of EGTA, and E2P hydrolysis was followed (see typical examples with wild type and 5Gi-106/107 in the inset). The amounts of E2P formed with 32Pi at zero time are normalized to 100%. Solid lines show the least squares fit to a single exponential, and the rates thus obtained are shown in the main panel. In the absence of Ca2+, statistical significance of the mutant rate compared with the wild-type rate is shown above an open bar: *, p < 0.05; ‡, p < 0.01. In each of the mutants and the wild type, statistical significance of the rate in 3 and 20 mm Ca2+ compared with that in the absence of Ca2+ is shown above a gray bar and closed bar: V, p < 0.05; ↓, p < 0.01. B, the marked retardation and acceleration in the absence of Ca2+ (open bars in A) are visualized with α-carbon coloring, red and purple, respectively. Error bars, S.D.
FIGURE 8.
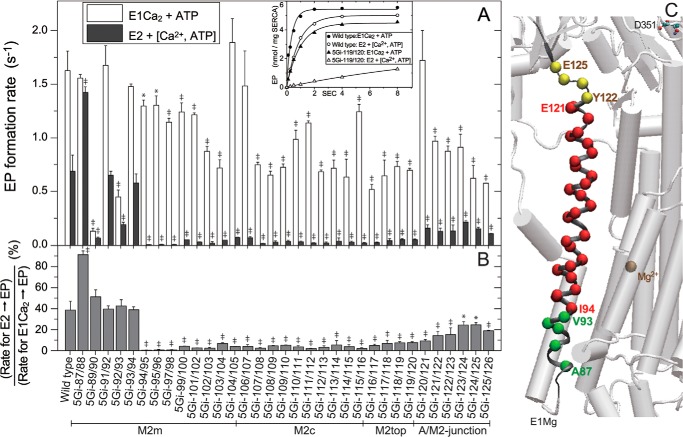
EP formation from E2 and E1Ca2 states. A, microsomes expressing wild type or mutant were preincubated for 20 min at 25 °C in 50 μl of a mixture containing 1–5 μg of microsomal protein, 1 μm A23187, 0.1 m KCl, 7 mm MgCl2, 50 mm MOPS/Tris (pH 7.0), and 1 mm EGTA with and without 1.2 mm CaCl2 (to form the Ca2+-bound (open bar) and unbound (closed bar) states, respectively). After cooling, an equal volume of a phosphorylation mixture containing 10 μm [γ-32P]ATP and 1 mm EGTA with 1.2 or 2.4 mm CaCl2 (to give 0.2 mm Ca2+ for both Ca2+-bound and Ca2+-unbound states) (otherwise as above) was added at 0 °C, and the EP formation time course was followed. In the inset, typical examples with the wild type and mutant 5Gi-119/120 are shown. Solid lines show the least squares fit to a single exponential, and the rates thus determined are shown in the main panel. The Ca2+-unbound state was denoted as E2 for simplicity, and the ratio of the two rates is shown in B. In A and B, statistical significance compared with the respective wild-type value is shown: *, p < 0.05; ‡, p < 0.01. C, the observed effects on the rate-limiting process E2 → E1 in B are visualized with α-carbon coloring; green, no effect or acceleration (ratio higher than 35%); yellow, retardation (ratio 30–15%); red, marked retardation (ratio lower than 15%). Error bars, S.D.
FIGURE 9.
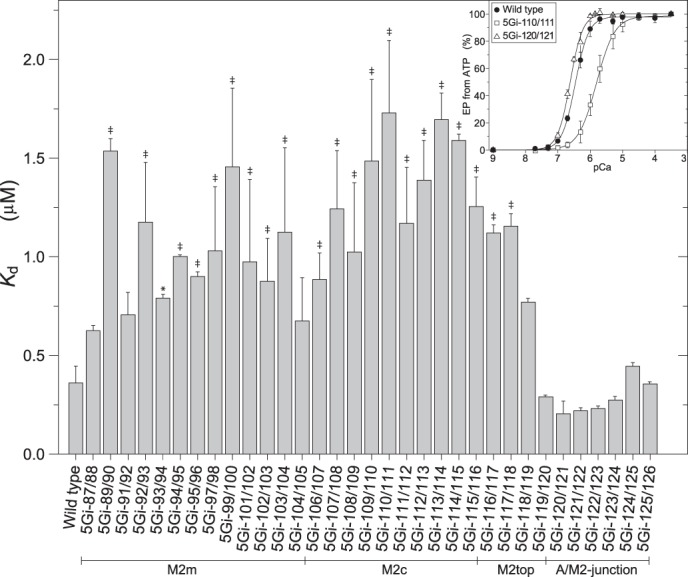
Ca2+ affinity determined with EP formation. The microsomes expressing wild type or mutant were preincubated for 20 min at 25 °C in 45 μl of a mixture containing 1–5 μg of microsomal protein, 2 mm EGTA, 1 μm A23187, 0.1 m KCl, 7 mm MgCl2, 50 mm MOPS/Tris (pH 7.0), and various concentrations of CaCl2 to give the desired Ca2+ concentrations. After cooling, the Ca2+-ATPase was phosphorylated with 10 μm [γ-32P]ATP for 15 s at 0 °C, and the amount of EP formed was determined. In the inset, the typical Ca2+ dependence of EP formation was shown for the wild type and the two mutants including 5Gi-110/111, which gave the highest Kd value. The Kd value and Hill coefficient were estimated by least squares fit to the Hill equation (solid line). The Hill coefficient obtained was ∼2 (actually 1.6–2) in the wild type and all of the mutants. Statistical significance compared with the wild type is shown: *, p < 0.05; ‡, p < 0.01. Error bars, S.D.
Ca2+ Occlusion in EP
Microsomes were phosphorylated for 1 min at 0 °C in a mixture containing 1–5 μg of microsomal protein, 5 μm ATP, 0.1 m KCl, 7 mm MgCl2, 10 μm 45CaCl2, 1 μm A23187, and 50 mm MOPS/Tris (pH 7.0) and immediately filtered through a 0.45-μm nitrocellulose membrane filter (Millipore). The filter was washed extensively with a washing solution (1 mm EGTA, 0.1 m KCl, 7 mm MgCl2, and 20 mm MOPS/Tris (pH 7.0)), and 45Ca2+ remaining on the filter was quantified as described (24). The amount of Ca2+ occluded at the transport sites of EP in the expressed SERCA1a was obtained by subtracting the amount of nonspecific Ca2+-binding determined in the presence of 1 μm TG, with conditions otherwise as above. The amount of EP formed was determined with nonradioactive Ca2+ and [γ-32P]ATP under otherwise the same conditions as above by membrane filtration, and the radioactivity remaining on the filter was quantified.
Miscellaneous
Protein concentration was determined by the method of Lowry et al. (32) with bovine serum albumin as a standard. Data were analyzed by nonlinear regression using the program Origin (MicroCal Software, Inc., Northampton, MA). Three-dimensional models of the enzyme were reproduced by the program VMD (33). The data represent the mean ± S.D. for 2–6 independent experiments (or 8–18 experiments in Fig. 6). Statistical analysis was performed by one-way analysis of variance with Dunnett's post hoc test using SPSS software version 22.
RESULTS
Protein Expression Level
For understanding possible structural roles of each of the M2 regions and the functional significance of its helix structure and changes during the transport cycle (unwinding/elongation) (Fig. 1), we introduced 5Gis throughout M2 and performed functional analyses. We first determined the expression levels of the wild type and mutants in the microsomes prepared from COS-1 cells (Fig. 2). The expression level of wild-type SERCA1a in the microsomes is ∼2% of total microsomal protein. Those of the 5Gi mutants are comparable, although a few show a level that is somewhat reduced but still high enough to perform all functional analyses.
FIGURE 2.
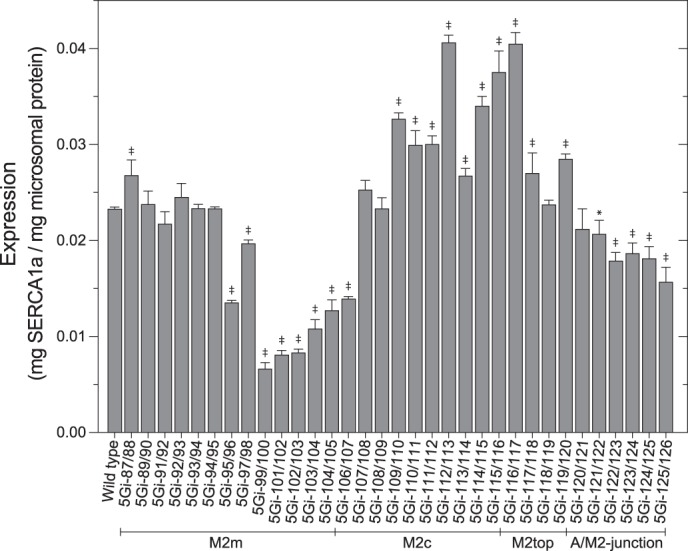
Expression levels. The expression levels of wild-type and 5Gi mutant SERCA1a in the microsomes prepared from COS-1 cells were determined and shown as values relative to the total amount of protein in the microsomes. Statistical significance compared with the wild type is shown as follows: *, p < 0.05; ‡, p < 0.01. Error bars, S.D.
ATP Hydrolysis, Ca2+ Transport, and Their Coupling
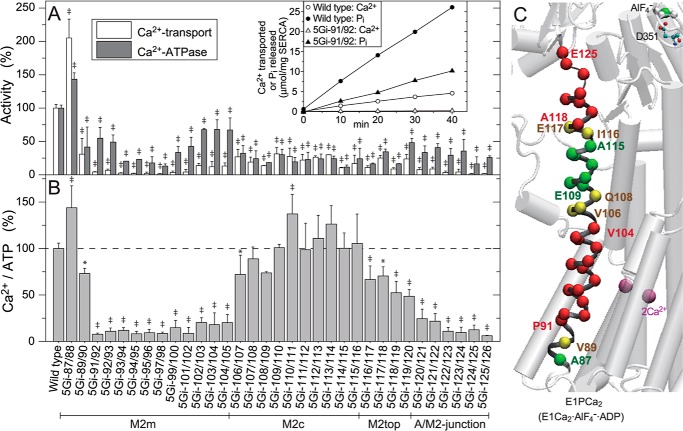
First, we explored possible effects of 5Gi mutations on the overall transport cycle. Fig. 3A shows the specific Ca2+-ATPase and oxalate-dependent Ca2+ transport activities of SERCA1a mutants and wild type at 10 μm Ca2+ in the presence of 5 mm oxalate. Here, the activities were determined during the linear part of Pi liberation and Ca2+ transport (inset) and defined as the fraction that is sensitive to inhibition by 1 μm TG, a highly specific and subnanomolar affinity SERCA inhibitor (34). We first confirmed that the mutants all retain TG sensitivity by observing that TG (1 μm) completely inhibits EP formation from [γ-32P]ATP in 10 μm Ca2+, conditions essentially the same as the activity measurements. We found that TG reduces the EP value in all cases to a background radioactivity level as in the wild type (i.e. less than 1% of the maximum EP level). The background radioactivity level is actually the same as that obtained in the absence of Ca2+ without TG.
FIGURE 3.
Ca2+-ATPase and oxalate-dependent Ca2+ transport activities. A, the specific activities of the expressed SERCA1a 5Gi mutants were determined and shown as values relative to the respective wild-type activities (ATP hydrolysis, 0.594 ± 0.028 μmol of Pi/min/mg of SERCA1a protein (n = 5); oxalate-dependent Ca2+ transport, 0.116 ± 0.006 μmol Ca2+/min/mg SERCA1a protein (n = 5); very similar to the values obtained by our group and other groups under optimum conditions with the microsomes prepared from the COS cells (e.g. see Refs. 29, 47–49)). Typical time courses of Pi liberation and Ca2+ accumulation in the wild type and mutant 5Gi-91/92 are shown in the inset. B, the coupling ratio (i.e. Ca2+ transport activity per Ca2+-ATPase activity (Ca2+/ATP)), is shown as a percentage of the wild-type ratio. In A and B, statistical significance compared with the respective wild-type value is shown; *, p < 0.05; ‡, p < 0.01. C, the mutational effects of residues in B are visualized with α-carbon coloring on M2; green, Ca2+/ATP higher than 80% of the wild type (coupled transport); yellow, 80 to 60% (slightly uncoupled); red, less than 60% (severely uncoupled). Error bars, S.D.
Most insertions reduce both activities (Fig. 3A). Importantly, some mutations at specific regions decrease Ca2+ transport/ATPase activity ratios (Ca2+/ATP, Fig. 3B). The insertions in M2m and those in the A/M2-junction cause severe uncoupling (i.e. almost no Ca2+ transport despite fair ATP hydrolysis). This contrasts with mutations at M2c, which result in normal coupling. At M2top (aa 116–119), uncoupling increases with proximity of the 5Gi insertions to the A/M2-junction.
EP Formation from ATP and E1P → E2P Isomerization
We then analyzed each of the steps and intermediates in the Ca2+ transport cycle. In Figs. 4–7, we assessed possible effects of 5Gi mutations on the properties of the phosphorylated intermediates E1P (occludes Ca2+ at the transport sites) and E2P (releases Ca2+ into the lumen). We first determined in Fig. 4 the total amount of EP (EPtotal, sum of E1P and E2P) and the E2P fraction at steady state. The analysis was made in the presence of K+, which strongly accelerates hydrolysis of E2P and therefore suppresses its accumulation in the wild type (35). The 5Gi insertions at aa 103–115 in M2m to M2c markedly decrease EPtotal (Fig. 4A). The decrease seems to correlate well with Ca2+ insensitivity of the EP hydrolysis rate in these mutants (see Fig. 7). It is also possible that a very rapid E2P hydrolysis and a very slow E2 → E1 transition in these mutants (cf. Figs. 7 and 8) may contribute to the decrease in EPtotal.
Otherwise, 5Gi mutants in M2c are largely wild type-like; E2P accumulation, the E1P to E2P isomerization rate (Figs. 4B and 5), and coupled Ca2+ transport are unremarkable. At M2m, E2P accumulation is considerably higher in some 5Gi mutants (5Gi-91/92, 5Gi-92/93, 5Gi-97/98, and 5Gi-101/102 to 5Gi-104/105) (Fig. 4B); EP isomerization is slightly faster than in the wild type (Fig. 5); and coupling in Ca2+ transport is substantially reduced as noted above.
At the M2top and A/M2-junction (aa 116–119 and 120–126), almost all EPtotal is E2P in the 5Gi mutants despite the presence of K+ (Fig. 4). In these mutants, EP isomerization is markedly accelerated (Fig. 5), and E2P hydrolysis is strongly retarded (as shown in Fig. 7), consistent with the dominant E2P accumulation. Ca2+ transport is substantially uncoupled from ATPase activity as noted above.
Ca2+ Occlusion in EP
In Fig. 6, the amount of 45Ca2+ occluded in EP was determined after EP formation under otherwise the same conditions as in Fig. 4. In the wild type, approximately two Ca2+ ions were occluded in EPtotal (comprising mostly E1P; Fig. 4B), in agreement with established mechanisms. 5Gi mutants at the luminal end of M2m (5Gi-87/88 and 5Gi-89/90) and those at the M2c region (aa 106–115) occluded approximately two Ca2+ in E1P (cf. Fig. 4B), which fits with their coupled Ca2+ transport although turnover is severely inhibited.
In contrast, in 5Gi mutants at M2m aa 91–105, all of which show severe uncoupling (cf. Fig. 3B), no Ca2+ is occluded despite reasonable E1P accumulation. Bound Ca2+ must escape from the E1P state, probably to the cytoplasmic side, to account for the uncoupling. For 5Gi mutants at M2top to the A/M2-junction region (aa 116–126), we also did not observe Ca2+ occlusion, but in this case, it is rather due to the dominant E2P accumulation and very rapid EP isomerization (Figs. 4 and 5). Nevertheless, in the uncoupled mutants, especially at the A/M2-junction, the Ca2+ must escape from E1P or during EP isomerization to the cytoplasmic side, showing the critical importance of this junctional region to keep the gate closed. The increased severity of uncoupling as the 5Gi insertions approach the A/M2-junction emphasizes its importance in coupling. In summary, 5Gi insertions in the central section of M2 have little effect on cytoplasmic gating, whereas those on either side block gate closure, although mutations at M2top (i.e. at the border region between M2c and A/M2-junction) exhibit mixed properties.
E2P Hydrolysis
Then we assessed possible effects of 5Gi mutations on the E2P hydrolysis rate and luminal Ca2+-induced back-inhibition of hydrolysis that reflect luminal gate closure during hydrolysis. The closure prevents luminal Ca2+ access to the transport sites and leakage. Here we determined the E2P hydrolysis rate directly by first phosphorylating the enzyme with 32Pi in the absence of Ca2+ and K+ and the presence of 35% (v/v) Me2SO, which strongly favors E2P formation in the reverse reaction (36), and then diluting the phosphorylated protein with a large volume of nonradioactive Pi and K+ without Ca2+ (open bars in Fig. 7). In regions M2m (aa 87–102), M2top (aa 116–119), and the A/M2-junction (aa 120–126), the 5Gi insertions strongly retard E2P hydrolysis. In contrast, at the top of M2m (aa 103–105) and the entire M2c region (aa 106–115), the insertions stimulate hydrolysis 3–10-fold.
Importantly, those mutants showing marked acceleration of E2P hydrolysis are insensitive to luminal Ca2+-induced back-inhibition. Here, the E2P hydrolysis rate was determined in the presence of 3 (gray bars) or 20 mm (black bars) Ca2+ and ionophore A23187. In the wild type, E2P hydrolysis is completely blocked by 3 mm Ca2+ due to Ca2+ binding to the open luminally oriented transport sites (open luminal gate) in E2P, in agreement with previous findings. Thus, accessibility to the Ca2+ sites from the luminal side in E2P, reflecting open gate status, can be assessed by the back-inhibition (22, 24, 37–42). All of the mutants with accelerated E2P hydrolysis are resistant against inhibition by Ca2+ even at 20 mm. The luminal gate is tightly closed, preventing access of Ca2+ to its binding site, or Ca2+ binding is possibly no longer coupled to a large change in the rate of hydrolysis. The results, either way, indicate the importance of the M2c region for coupling catalysis and luminal gate closure during E2P hydrolysis. Notable also, 5Gi mutants at aa 95–101 with retarded hydrolysis exhibit partial resistance to inhibition by luminal Ca2+ although less than those at aa 103–115.
E2 → E1 Transition
After E2P hydrolysis, the enzyme in the inactive E2 state is reactivated for the next transport cycle by two Ca2+ binding from the cytoplasmic side to the high affinity transport sites forming E1Ca2. In this activation, the E2 state is isomerized first to a transient E1 state (ready to accept Ca2+) with an open cytoplasmic gate and a high Ca2+ affinity (E2 → E1 transition; Fig. 1). Here we measured possible effects of 5Gi mutations on the transition itself (Fig. 8) as well as the affinity of the Ca2+ binding sites (Fig. 9).
The rate of the transition can be quantified by measuring the rate of phosphoenzyme formation following the addition of Ca2+ plus ATP to Ca2+-deprived Ca2+-ATPase. The assay takes advantage of the fact that subsequent steps (Ca2+ binding, ATP binding, and phosphorylation) are relatively fast. The transition is pH-sensitive, and we have found that pH 7.0 is ideal for studying the effect of mutations because, even in wild-type, at lower pH, the rate is rather slow, and at higher values, it approaches that of the subsequent steps, notably the rate of phosphorylation of Ca2+-bound Ca2+-ATPase (data at pH 7.0 shown in Fig. 8; other data not shown).
First, the rate of phosphorylation of Ca2+-bound Ca2+-ATPase E1Ca2 is only marginally affected by the mutations, although the change 5Gi-89/90 is not without consequences. The transition itself is markedly slowed by 5Gi insertions in most of M2 aa 94–119 (from the upper half of M2m to M2top).
5Gi insertions higher up at the A/M2-junction (aa 120–126) are less inhibitory, and effects diminish closer to the A domain. At the luminal end of M2, mutations are without effect, except for 5Gi-89/90 and 5Gi-87/88, which have unexpected and contrary effects. In general then, most mutations in M2 affect the transition.
Possible changes in Ca2+-binding properties were assessed by measuring the Ca2+ dependence of phosphorylation. Apparent Kd values increase somewhat (up to 5-fold) (Fig. 9) yet still remain in the high affinity (1–1.5 μm) range. The Hill coefficients hover around the usual 2. Evidently, M2 has little to do with cytoplasmic Ca2+ binding itself, consistent with the fact that the Ca2+ binding sites consist of M4, M5, M6, and M8 (Fig. 1).
DISCUSSION
We find that almost the entire M2 section plays a crucial role in coupling movements of the A domain and catalysis with gating at the transport sites. Although 5Gi insertions in border regions of the M2 sections mostly exhibit mixed kinetic properties, in general, two main regions can be distinguished: namely that in the middle (M2c), where the long M2 helix breaks during E2P hydrolysis, and that on either side (M2m, M2top, and A/M2-junction). Our results show that the former controls luminal gating, whereas the latter controls cytoplasm gating. In addition, insertions in part of M2m (aa 94–103) have mixed kinetic effects, probably reflecting its structural role in the M1/M2 V-shaped body and involvement in gating on both sides of the membrane with long range effects on the catalytic site (9, 11). The results are best interpreted with reference to Fig. 10.
FIGURE 10.
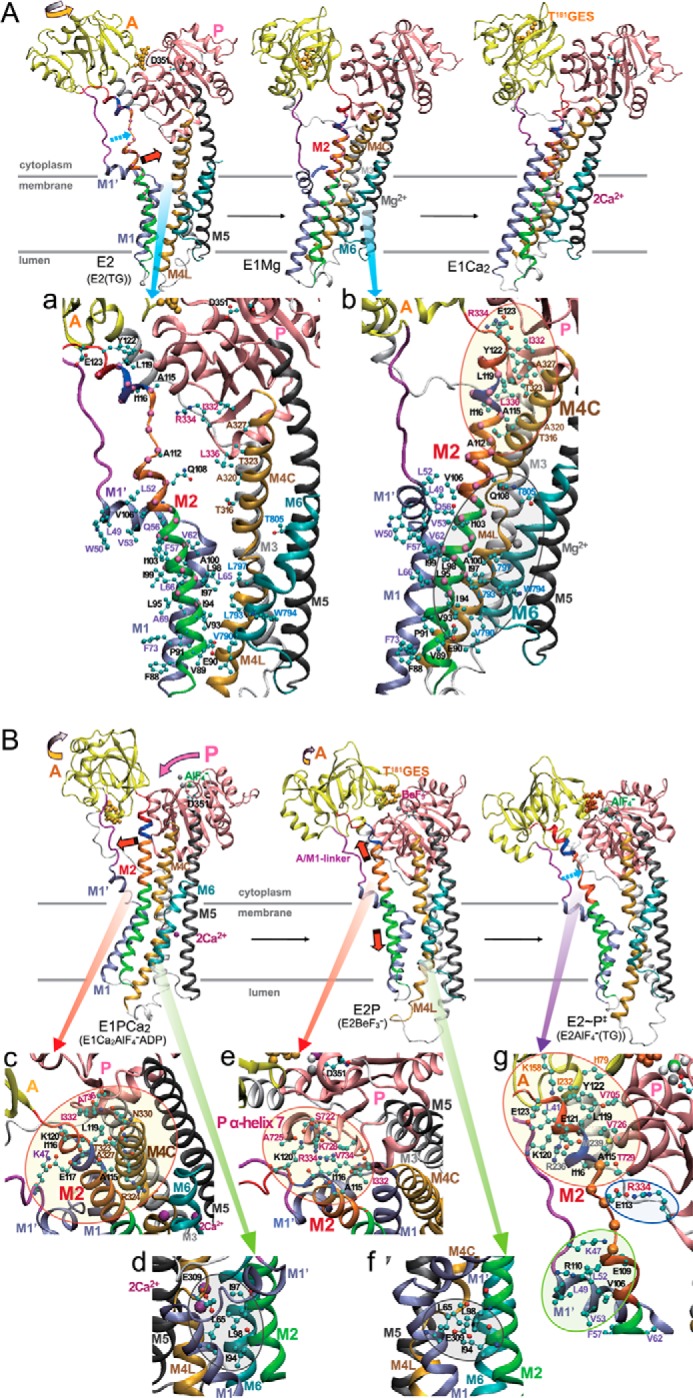
Detailed inspection of structure and interactions of M2 in crystal structures. The structural changes are modeled as in Fig. 1A. The N domain and M7–M10 helices are not depicted for simplicity. The red (A and B), ice blue (A), yellow (A and B), and pink (B) arrows indicate the approximate motions of M2, M1′, A domain, and P domain, respectively. The broken light blue arrow (A and B) indicates the unwound part of M2. The TGES184 loop is depicted with orange van der Waals spheres. Interactions involving M2 regions are shown in transparent circles in enlarged views. See “Discussion” for the details and the roles of M2 regions.
Cytoplasmic Gating in E2 → E1
Opening of the cytoplasm gate takes place during the E2 → E1 transition. Our results show that 5Gi insertions along most of M2 (aa 94–119) markedly retard this transition, indicating the critical importance of the helix structure for a rapid transition. Consistently, the relevant crystal structures show that the unwound Asn111–Asn115 part of M2c in E2 is rewound in E1Mg2+, a change associated with the ∼110° A domain rotation (14), and M2 becomes a contiguous helix in E1Mg2+, as in E1Ca2. In the critical region aa 94–119, the lower half (aa 94–111) and the upper half (aa 111–119) change from broken and disengaged entities in E2 to making strong helix-helix contacts with M6 and M4C in E1, respectively (gray circle and yellow circle in panel b in Fig. 10A). These helix-helix interactions probably must stabilize the E1 structure, facilitating the E2 → E1 transition and opening of the cytoplasmic gate.
Cytoplasmic Gating in E1P and Its Isomerization
Once the two Ca2+ bind to the transport sites from the cytoplasmic side, closing of the gate to occlude the Ca2+ is effected by phosphorylation to E1P (9, 43, 44). Two sets of mutations, those in M2m and those in the M2top∼A/M2-junction, but not in the middle at M2c, uncouple the pump and fail to occlude Ca2+, indicating the importance of these regions in stabilizing the closed cytoplasmic gate.
The immediate gating residue is Glu309, and Leu65 in M1 fastens it down as demonstrated previously (9, 43, 44). As seen (gray circle in panel d in Fig. 10B), the region around Leu98 in M2m is in close contact with Leu65 by hydrophobic interactions producing the M1/M2 V-shaped body and also directly with Glu309. The disruption of the hydrophobic Leu98 region probably allowed greater freedom of movement of Glu309, thereby permitting the Ca2+ to escape. It is also possible that luminal gate opening is also impaired because EP isomerization and opening depends on the motion of the M1/M2 V-shaped body, which is formed by the interactions of the hydrophobic Leu98 region with M1 (11).
In mutants at the A/M2-junction and M2top, we did not observe Ca2+ occlusion because of the low level of E1P (Figs. 5 and 6), but it is evident from the lack of transport that Ca2+ escaped from the transport sites either in E1P or during the isomerization to E2P. A properly stabilized M2 and A domain must be critical for maintaining a closed cytoplasmic gate. Interestingly, the severe uncoupling is accompanied by acceleration of EP isomerization. It is as if freedom from coupling rechannels the energy into a faster transition. The extensive slack caused by the 5Gi insertions evidently uncoupled and accelerated E1P → E2P. In the change, E1Ca2·AlF4−·ADP → E2·BeF3−, the A/M2-junction∼M2top loop region does indeed seem to be strained, because, for example, the distance between Glu117-αC and Glu125-αC increases from 14.3 Å in E1Ca2·AlF4−·ADP (PDB code 1T5T) to 15.7 or 17.3 Å in E2·BeF3− (PDB code 2ZBE or 3B9B), thus by 1.4 or 3.0 Å.
The closer the M2top mutations get to the A/M2-junction the more severe the uncoupling, suggesting that M2top stabilizes the junction and a closed Glu309 gate. The M2top mutations also strongly accelerate EP isomerization; therefore, in the wild type, there must be some structural restriction here. Indeed, in the crystal structure of E1P (E1Ca2·AlF4−·ADP), M2top interacts with the cytoplasmic half of M4 (M4C, yellow circle in panel c in Fig. 10B), and in E2P (E2·BeF3−), it interacts with the bottom of the P domain and α-helix 7 (yellow circle in panel e in Fig. 10B).
A mechanistic scenario for the EP isomerization and gating with respect to the A/M-junction∼M2top may be as follows. During the E1P → E2P isomerization, the A domain rotates and pulls on A/M2-junction∼M2top, straining it to detach from M4C. The P domain/M4/M5 entity is now able to incline toward the underside of the A domain to produce new interactions with M2top (Fig. 10B). In these coupled motions, the M1/M2 V-shaped body and M4/M5 probably move coordinately, keeping the Glu309 gate closed. Kinetically, coupling and proper Ca2+ handling have an energy cost: the rate-limiting slow EP isomerization. Ca2+ deocclusion and release from E2PCa2 involves further inclination of the A and P domains due to strain in the A/M1′-linker, with the A domain lodging above the P domain in E2PCa2, and the luminal gate opens to release Ca2+ (24, 25). Thus, the A domain's M2 link and A/M1′-linker have distinct functions; the former keeps the cytoplasmic gate closed, and the latter is needed for opening the luminal gate, both regions coupling A domain motions with gating.
The importance of an intact A/M2-junction∼M2top interaction is further underpinned by the fact that mutations in the M2c region do not have the same deleterious effects (uncoupling with accelerated EP isomerization) because the interactions of M2top with the M4C/P-domain and of M2m (M1/M2 V-shaped body) to fix the Glu309 gate are normal in these mutants. Also, M2c does not interact strongly with other parts both in E1P and E2P and does not change structure (is not strained) during the EP isomerization. The mutations here are silent. Also, as noted above, the A domain motion driving Ca2+ release into the lumen after the EP isomerization is controlled to a significant extent by the A/M1′-linker, another cytoplasmic link (24, 25), and evidently not by M2c.
Luminal Gating
Opening of the luminal gate and Ca2+ release is effected during E1P → E2P, and the latter Ca2+-free state becomes susceptible to Ca2+ binding from the lumen at high Ca2+ concentrations (back-inhibition). The gate closes during E2P hydrolysis E2P → E2∼P‡ with most of Ca2+-binding residues protonated, according to both biochemical evidence (7) and relevant crystal structures (9, 11, 12).
We find that E2P hydrolysis is markedly accelerated by 5Gi insertions at aa 103–115 in the M2c region, in sharp contrast to the marked retardation by those at adjacent regions aa 87–102 on M2m and aa 116–125 on M2top∼A/M2-junction (Fig. 7). Significantly, acceleration is accompanied by the almost complete resistance against inhibition by luminal Ca2+ even up to 20 mm. Most of these mutants (aa 106–115) are well coupled in terms of Ca2+ transport/ATP hydrolysis ratios. Therefore, Ca2+ must be released to the lumen, but the binding sites are unavailable for Ca2+ rebinding from the lumen due to the rapid E2P hydrolysis and closure of the luminal gate. Alternatively, luminal Ca2+ binding is no longer coupled to a large change in the rate of hydrolysis.
The results indicate that a proper unwinding/elongation on M2c with properly controlled E2P hydrolysis may be critical for coupling the change in E2P → E2∼P‡ at the catalytic site with the luminal gate closure. The 5Gi insertions exaggerated both coupled structural events. Physiologically, the setting of the luminal Ca2+ concentration is governed by the Ca2+-induced back-inhibition of E2P hydrolysis (22, 24, 37–42, 45). In the wild type, the regionally limited partial unwinding/elongation in M2c appears critical for the set point, but it comes with an energy cost: slow but properly controlled gate closing coupled to E2P hydrolysis.
Then, in the structural change mimicking E2P → E2∼P‡ (Fig. 10B), a part of helical M2c, Asn111–Ala115, unwinds and extends 7 Å, which is due to strain exerted through a 25° rotation of the A domain upon water attack at the active site to effect hydrolysis (11). Thereby, the lower part of M2 moves downward 6 Å, inclines, and presses the M1/M2 V-shaped rigid body on M3 and M4 to close the luminal gate (11). In E2∼P‡, the interactions between M2c and the rest of the protein are rather weak, whereas those between the regions on either side and protein are helix to helix, extensive, and therefore fixed (yellow and green circles in panel g in Fig. 10B). Thus, it appears that M2 is literally pulled apart at M2c. Evidently, the 5Gi mutations in this weak region facilitate and exaggerate (possibly causing elongation of up to ∼17 Å) these processes, resulting in an activation of hydrolysis and fast and tight closure of the transport sites (or uncoupling). Consistently, mutations that disrupt the strong helix to helix interactions at the bottom of M2c (aa 103–110) with the M1′ helix alongside resulted in accelerated and luminal Ca2+-resistant E2P hydrolysis.
In contrast, mutations higher up, in the M2top∼A/M2-junction, impede hydrolysis and closure, probably by affecting interactions with the A and P domains and the Tyr122-hydrophobic cluster, which was previously demonstrated to be critical for proper catalytic site formation in E2P with hydrolytic ability (yellow circle in panel g in Fig. 10B) (21, 22, 46). Mutations lower down, in aa 87–102 of M2m, disrupt arrangement of the transmembrane helices and probably cause a long range effect on the A and P domain interaction and catalytic site, thus retarding E2P hydrolysis. Note that mutants at the region aa 95–101 showed some resistance against luminal Ca2+-induced back-inhibition. This region forms the M1/M2 V-shaped body, and the downward movement of M2 with inclination of the body is critical for the luminal gate closure (9, 11). The 5Gi elongation in this region probably exaggerated such motions and tightened gate closure.
The long M2 helix and probably the A domain's motion are common structural features in P-type ion-pumping ATPases (16–20). The strategy employed here of systematically introducing 5Gi insertions along M2 to disrupt the helix and relieve strain may be helpful for exploring the role of M2 in coupling A domain movements with gating and catalysis in other P-type ATPases.
Acknowledgments
We thank Dr. David H. MacLennan (University of Toronto) for the generous gift of SERCA1a cDNA and Dr. Randal J. Kaufman (Genetics Institute, Cambridge, MA) for the generous gift of the expression vector pMT2. We are also grateful to Dr. Chikashi Toyoshima (University of Tokyo) for helpful discussions. We thank Dr. Yasuaki Saijo (Asahikawa Medical University) for assistance in statistical analysis and Dr. David B. McIntosh for reviewing and improving the manuscript.
This work was supported by a Grant-in-Aid for Scientific Research C (to T. D.) and B (to H. S.) from the Ministry of Education, Culture, Sports, Science, and Technology of Japan.
- SERCA1a
- adult fast twitch skeletal muscle sarcoplasmic reticulum Ca2+-ATPase
- A
- N, and P domain, actuator, nucleotide binding, and phosphorylation domain, respectively
- EP
- phosphoenzyme
- E1P
- ADP-sensitive phosphoenzyme
- E2P
- ADP-insensitive phosphoenzyme
- E2∼P‡
- transition state of ADP-insensitive phosphoenzyme hydrolysis
- E1PCa2
- ADP-sensitive phosphoenzyme with occluded Ca2+
- E2PCa2
- ADP-insensitive phosphoenzyme with occluded Ca2+
- TG
- thapsigargin
- aa
- amino acid(s)
- PDB
- Protein Data Bank
- 5Gi
- insertion of five glycine residues.
REFERENCES
- 1. Toyoshima C. (2008) Structural aspects of ion pumping by Ca2+-ATPase of sarcoplasmic reticulum. Arch. Biochem. Biophys. 476, 3–11 [DOI] [PubMed] [Google Scholar]
- 2. Toyoshima C. (2009) How Ca2+-ATPase pumps ions across the sarcoplasmic reticulum membrane. Biochim. Biophys. Acta 1793, 941–946 [DOI] [PubMed] [Google Scholar]
- 3. Møller J. V., Olesen C., Winther A.-M. L., Nissen P. (2010) The sarcoplasmic Ca2+-ATPase: design of a perfect chemi-osmotic pump. Q. Rev. Biophys. 43, 501–566 [DOI] [PubMed] [Google Scholar]
- 4. Toyoshima C., Nakasako M., Nomura H., Ogawa H. (2000) Crystal structure of the calcium pump of sarcoplasmic reticulum at 2.6 Å resolution. Nature 405, 647–655 [DOI] [PubMed] [Google Scholar]
- 5. Danko S., Yamasaki K., Daiho T., Suzuki H., Toyoshima C. (2001) Organization of cytoplasmic domains of sarcoplasmic reticulum Ca2+-ATPase in E1P and E1ATP states: a limited proteolysis study. FEBS Lett. 505, 129–135 [DOI] [PubMed] [Google Scholar]
- 6. Toyoshima C., Nomura H. (2002) Structural changes in the calcium pump accompanying the dissociation of calcium. Nature 418, 605–611 [DOI] [PubMed] [Google Scholar]
- 7. Danko S., Yamasaki K., Daiho T., Suzuki H. (2004) Distinct natures of beryllium fluoride-bound, aluminum fluoride-bound, and magnesium fluoride-bound stable analogues of an ADP-insensitive phosphoenzyme intermediate of sarcoplasmic reticulum Ca2+-ATPase. J. Biol. Chem. 279, 14991–14998 [DOI] [PubMed] [Google Scholar]
- 8. Toyoshima C., Mizutani T. (2004) Crystal structure of the calcium pump with a bound ATP analogue. Nature 430, 529–535 [DOI] [PubMed] [Google Scholar]
- 9. Toyoshima C., Nomura H., Tsuda T. (2004) Lumenal gating mechanism revealed in calcium pump crystal structures with phosphate analogues. Nature 432, 361–368 [DOI] [PubMed] [Google Scholar]
- 10. Sørensen T. L.-M., Møller J. V., Nissen P. (2004) Phosphoryl transfer and calcium ion occlusion in the calcium pump. Science 304, 1672–1675 [DOI] [PubMed] [Google Scholar]
- 11. Toyoshima C., Norimatsu Y., Iwasawa S., Tsuda T., Ogawa H. (2007) How processing of aspartylphosphate is coupled to lumenal gating of the ion pathway in the calcium pump. Proc. Natl. Acad. Sci. U.S.A. 104, 19831–19836 [DOI] [PMC free article] [PubMed] [Google Scholar]
- 12. Olesen C., Picard M., Winther A. M., Gyrup C., Morth J. P., Oxvig C., Møller J. V., Nissen P. (2007) The structural basis of calcium transport by the calcium pump. Nature 450, 1036–1042 [DOI] [PubMed] [Google Scholar]
- 13. Danko S., Daiho T., Yamasaki K., Liu X., Suzuki H. (2009) Formation of the stable structural analog of ADP-sensitive phosphoenzyme of Ca2+-ATPase with occluded Ca2+ by beryllium fluoride. J. Biol. Chem. 284, 22722–22735 [DOI] [PMC free article] [PubMed] [Google Scholar]
- 14. Toyoshima C., Iwasawa S., Ogawa H., Hirata A., Tsueda J., Inesi G. (2013) Crystal structures of the calcium pump and sarcolipin in the Mg2+-bound E1 state. Nature 495, 260–264 [DOI] [PubMed] [Google Scholar]
- 15. Winther A. M., Bublitz M., Karlsen J. L., Møller J. V., Hansen J. B., Nissen P., Buch-Pedersen M. J. (2013) The sarcolipin-bound calcium pump stabilizes calcium sites exposed to the cytoplasm. Nature 495, 265–269 [DOI] [PubMed] [Google Scholar]
- 16. Toyoshima C., Inesi G. (2004) Structural basis of ion pumping by Ca2+-ATPase of the sarcoplasmic reticulum. Annu. Rev. Biochem. 73, 269–292 [DOI] [PubMed] [Google Scholar]
- 17. Kanai R., Ogawa H., Vilsen B., Cornelius F., Toyoshima C. (2013) Crystal structure of a Na+-bound Na+,K+-ATPase preceding the E1P state. Nature 502, 201–206 [DOI] [PubMed] [Google Scholar]
- 18. Shinoda T., Ogawa H., Cornelius F., Toyoshima C. (2009) Crystal structure of the sodium-potassium pump at 2.4 Å resolution. Nature 459, 446–450 [DOI] [PubMed] [Google Scholar]
- 19. Abe K., Tani K., Fujiyoshi Y. (2011) Conformational rearrangement of gastric H+,K+-ATPase induced by an acid suppressant. Nat. Commun. 2, 155. [DOI] [PMC free article] [PubMed] [Google Scholar]
- 20. Bublitz M., Poulsen H., Morth J. P., Nissen P. (2010) In and out of the cation pumps: P-type ATPase structure revisited. Curr. Opin. Struct. Biol. 20, 431–439 [DOI] [PubMed] [Google Scholar]
- 21. Wang G., Yamasaki K., Daiho T., Suzuki H. (2005) Critical hydrophobic interactions between phosphorylation and actuator domains of Ca2+-ATPase for hydrolysis of phosphorylated intermediate. J. Biol. Chem. 280, 26508–26516 [DOI] [PubMed] [Google Scholar]
- 22. Yamasaki K., Wang G., Daiho T., Danko S., Suzuki H. (2008) Roles of Tyr122-hydrophobic cluster and K+ binding in Ca2+-releasing process of ADP-insensitive phosphoenzyme of sarcoplasmic reticulum Ca2+-ATPase. J. Biol. Chem. 283, 29144–29155 [DOI] [PMC free article] [PubMed] [Google Scholar]
- 23. Daiho T., Yamasaki K., Wang G., Danko S., Iizuka H., Suzuki H. (2003) Deletions of any single residues in Glu40–Ser48 loop connecting A domain and the first transmembrane helix of sarcoplasmic reticulum Ca2+-ATPase result in almost complete inhibition of conformational transition and hydrolysis of phosphoenzyme intermediate. J. Biol. Chem. 278, 39197–39204 [DOI] [PubMed] [Google Scholar]
- 24. Daiho T., Yamasaki K., Danko S., Suzuki H. (2007) Critical role of Glu40–Ser48 loop linking actuator domain and first transmembrane helix of Ca2+-ATPase in Ca2+ deocclusion and release from ADP-insensitive phosphoenzyme. J. Biol. Chem. 282, 34429–34447 [DOI] [PubMed] [Google Scholar]
- 25. Daiho T., Danko S., Yamasaki K., Suzuki H. (2010) Stable structural analog of Ca2+-ATPase ADP-insensitive phosphoenzyme with occluded Ca2+ formed by elongation of A-domain/M1′-linker and beryllium fluoride binding. J. Biol. Chem. 285, 24538–24547 [DOI] [PMC free article] [PubMed] [Google Scholar]
- 26. Kaufman R. J., Davies M. V., Pathak V. K., Hershey J. W. (1989) The phosphorylation state of eucaryotic initiation factor 2 alters translational efficiency of specific mRNAs. Mol. Cell Biol. 9, 946–958 [DOI] [PMC free article] [PubMed] [Google Scholar]
- 27. Maruyama K., MacLennan D. H. (1988) Mutation of aspartic acid-351, lysine-352, and lysine-515 alters the Ca2+ transport activity of the Ca2+-ATPase expressed in COS-1 cells. Proc. Natl. Acad. Sci. U.S.A. 85, 3314–3318 [DOI] [PMC free article] [PubMed] [Google Scholar]
- 28. Daiho T., Yamasaki K., Suzuki H., Saino T., Kanazawa T. (1999) Deletions or specific substitutions of a few residues in the NH2-terminal region (Ala3 to Thr9) of sarcoplasmic reticulum Ca2+-ATPase cause inactivation and rapid degradation of the enzyme expressed in COS-1 cells. J. Biol. Chem. 274, 23910–23915 [DOI] [PubMed] [Google Scholar]
- 29. Daiho T., Yamasaki K., Saino T., Kamidochi M., Satoh K., Iizuka H., Suzuki H. (2001) Mutations of either or both Cys876 and Cys888 residues of sarcoplasmic reticulum Ca2+-ATPase result in a complete loss of Ca2+ transport activity without a loss of Ca2+-dependent ATPase activity: Role of the Cys876-Cys888 Disulfide Bond. J. Biol. Chem. 276, 32771–32778 [DOI] [PubMed] [Google Scholar]
- 30. Weber K., Osborn M. (1969) The reliability of molecular weight determinations by dodecyl sulfate-polyacrylamide gel electrophoresis. J. Biol. Chem. 244, 4406–4412 [PubMed] [Google Scholar]
- 31. Daiho T., Suzuki H., Yamasaki K., Saino T., Kanazawa T. (1999) Mutations of Arg198 in sarcoplasmic reticulum Ca2+-ATPase cause inhibition of hydrolysis of the phosphoenzyme intermediate formed from inorganic phosphate. FEBS Lett. 444, 54–58 [DOI] [PubMed] [Google Scholar]
- 32. Lowry O. H., Rosebrough N. J., Farr A. L., Randall R. J. (1951) Protein measurement with the folin phenol reagent. J. Biol. Chem. 193, 265–275 [PubMed] [Google Scholar]
- 33. Humphrey W., Dalke A., Schulten K. (1996) VMD: visual molecular dynamics. J. Mol. Graph. 14, 33–38, 27–28 [DOI] [PubMed] [Google Scholar]
- 34. Sagara Y., Inesi G. (1991) Inhibition of the sarcoplasmic reticulum Ca2+ transport ATPase by thapsigargin at subnanomolar concentrations. J. Biol. Chem. 266, 13503–13506 [PubMed] [Google Scholar]
- 35. Shigekawa M., Dougherty J. P. (1978) Reaction mechanism of Ca2+-dependent ATP hydrolysis by skeletal muscle sarcoplasmic reticulum in the absence of added alkali metal salts. II. Kinetic properties of the phosphoenzyme formed at the steady state in high Mg2+ and low Ca2+ concentrations. J. Biol. Chem. 253, 1451–1457 [PubMed] [Google Scholar]
- 36. de Meis L., Martins O. B., Alves E. W. (1980) Role of water, hydrogen ion, and temperature on the synthesis of adenosine triphosphate by the sarcoplasmic reticulum adenosine triphosphatase in the absence of a calcium ion gradient. Biochemistry 19, 4252–4261 [DOI] [PubMed] [Google Scholar]
- 37. Sato K., Yamasaki K., Daiho T., Miyauchi Y., Takahashi H., Ishida-Yamamoto A., Nakamura S., Iizuka H., Suzuki H. (2004) Distinct types of abnormality in kinetic properties of three Darier disease-causing sarco(endo)plasmic reticulum Ca2+-ATPase mutants that exhibit normal expression and high Ca2+ transport activity. J. Biol. Chem. 279, 35595–35603 [DOI] [PubMed] [Google Scholar]
- 38. de Meis L., Inesi G. (1982) ATP synthesis by sarcoplasmic reticulum ATPase following Ca2+, PH, temperature, and water activity jumps. J. Biol. Chem. 257, 1289–1294 [PubMed] [Google Scholar]
- 39. Nakamura Y. (1984) Two alternate kinetic routes for the decomposition of the phosphorylated intermediate of sarcoplasmic reticulum Ca2+-ATPase. J. Biol. Chem. 259, 8183–8189 [PubMed] [Google Scholar]
- 40. Nakamura Y., Kurzmack M., Inesi G. (1986) Kinetic effects of calcium and ADP on the phosphorylated intermediate of sarcoplasmic reticulum ATPase. J. Biol. Chem. 261, 3090–3097 [PubMed] [Google Scholar]
- 41. Prager R., Punzengruber C., Kolassa N., Winkler F., Suko J. (1979) Ionized and bound calcium inside isolated sarcoplasmic reticulum of skeletal muscle and its significance in phosphorylation of adenosine triphosphatase by orthophosphate. Eur. J. Biochem. 97, 239–250 [DOI] [PubMed] [Google Scholar]
- 42. Hanel A. M., Jencks W. P. (1991) Dissociation of calcium from the phosphorylated calcium-transporting adenosine triphosphatase of sarcoplasmic reticulum: kinetic equivalence of the calcium ions bound to the phosphorylated enzyme. Biochemistry 30, 11320–11330 [DOI] [PubMed] [Google Scholar]
- 43. Einholm A. P., Vilsen B., Andersen J. P. (2004) Importance of transmembrane segment M1 of the sarcoplasmic reticulum Ca2+-ATPase in Ca2+ occlusion and phosphoenzyme processing. J. Biol. Chem. 279, 15888–15896 [DOI] [PubMed] [Google Scholar]
- 44. Inesi G., Ma H., Lewis D., Xu C. (2004) Ca2+ occlusion and gating function of Glu309 in the ADP-fluoroaluminate analog of the Ca2+-ATPase phosphoenzyme intermediate. J. Biol. Chem. 279, 31629–31637 [DOI] [PubMed] [Google Scholar]
- 45. Meldolesi J., Pozzan T. (1998) The endoplasmic reticulum Ca2+ store: a view from the lumen. Trends Biochem. Sci. 23, 10–14 [DOI] [PubMed] [Google Scholar]
- 46. Yamasaki K., Daiho T., Danko S., Suzuki H. (2004) Multiple and distinct effects of mutations of Tyr122, Glu123, Arg324, and Arg334 involved in interactions between the top part of second and fourth transmembrane helices in sarcoplasmic reticulum Ca2+-ATPase. J. Biol. Chem. 279, 2202–2210 [DOI] [PubMed] [Google Scholar]
- 47. Lytton J., Westlin M., Hanley M. R. (1991) Thapsigargin inhibits the sarcoplasmic or endoplasmic reticulum Ca-ATPase family of calcium pumps. J. Biol. Chem. 266, 17067–17071 [PubMed] [Google Scholar]
- 48. Garnett C., Sumbilla C., Belda F. F., Chen L., Inesi G. (1996) Energy transduction and kinetic regulation by the peptide segment connecting phosphorylation and cation binding domains in transport ATPases. Biochemistry 35, 11019–11025 [DOI] [PubMed] [Google Scholar]
- 49. Xu C., Prasad A. M., Inesi G., Toyoshima C. (2008) Critical role of Val-304 in conformational transitions that allow Ca2+ occlusion and phosphoenzyme turnover in the Ca2+ transport ATPase. J. Biol. Chem. 283, 3297–3304 [DOI] [PubMed] [Google Scholar]


