

Background: Alginate epimerases consist of catalytic and noncatalytic domains of yet unknown function.
Results: The noncatalytic domains of AlgE4 and AlgE6 possess different alginate binding behavior despite highly similar structures.
Conclusion: Noncatalytic subunits of AlgE6 and AlgE4 influence the product specificity of the catalytic domain.
Significance: This work opens a new route to designing alginate epimerases producing tailored alginates.
Keywords: Calcium-binding Protein, Carbohydrate-binding Protein, Nuclear Magnetic Resonance (NMR), Protein Chemistry, Protein Engineering, Alginate, Alginate C-5 Epimerase, ITC, R-module, SAXS
Abstract
The bacterium Azotobacter vinelandii produces a family of seven secreted and calcium-dependent mannuronan C-5 epimerases (AlgE1–7). These epimerases are responsible for the epimerization of β-d-mannuronic acid (M) to α-l-guluronic acid (G) in alginate polymers. The epimerases display a modular structure composed of one or two catalytic A-modules and from one to seven R-modules having an activating effect on the A-module. In this study, we have determined the NMR structure of the three individual R-modules from AlgE6 (AR1R2R3) and the overall structure of both AlgE4 (AR) and AlgE6 using small angle x-ray scattering. Furthermore, the alginate binding ability of the R-modules of AlgE4 and AlgE6 has been studied with NMR and isothermal titration calorimetry. The AlgE6 R-modules fold into an elongated parallel β-roll with a shallow, positively charged groove across the module. Small angle x-ray scattering analyses of AlgE4 and AlgE6 show an overall elongated shape with some degree of flexibility between the modules for both enzymes. Titration of the R-modules with defined alginate oligomers shows strong interaction between AlgE4R and both oligo-M and MG, whereas no interaction was detected between these oligomers and the individual R-modules from AlgE6. A combination of all three R-modules from AlgE6 shows weak interaction with long M-oligomers. Exchanging the R-modules between AlgE4 and AlgE6 resulted in a novel epimerase called AlgE64 with increased G-block forming ability compared with AlgE6.
Introduction
Alginates are unbranched biopolymers consisting of β-d-mannuronic (M)4 acid and its C-5 epimer α-l-guluronic (G) acid (1, 2). The physical and chemical properties of alginate are influenced by the relative amount of M and G as well as the distribution of the two monomers in the polymer chain (3). Along the alginate chain, the G and M residues are arranged in a pattern showing homopolymeric regions of G residues (G-blocks) and homopolymeric regions of M residues (M-blocks) interspersed by regions in which the two groups coexist in a strictly alternating sequence (MG-blocks). The wide variability of the composition and sequential structure of alginate is a key functional attribute of the polysaccharide. Although the intrinsic inflexibility of the alginate chain increases in the order MG < MM < GG (4), the selectivity for binding of cations and gel-forming properties is mainly linked to the G-blocks (3, 5, 6). Recently, it has been shown that G-blocks larger than 100 consecutive residues are essential for forming stable calcium gels (7).
Alginate is produced as poly-M and then certain M residues are converted to G by epimerases acting on the polymer level. The alginate-producing bacterium Azotobacter vinelandii has one periplasmic epimerase, which incorporates single G residues into the alginate during secretion of the polymer (8). In addition, A. vinelandii produces seven extracellular C-5 alginate epimerases called AlgE1–7 (9, 10). Each of the epimerases convert mannuronic acid to guluronic acid in different patterns, and additionally, AlgE7 also shows lyase activity (11, 12). The seven epimerases consist of two types of structural modules designated A- and R-modules (9, 10). The smallest of these epimerases is AlgE4, which consists of one A- and one R-module and incorporates MG-blocks into the alginate sequence. The atomic resolution structures of the A-module (13) and R-module (14, 15) of AlgE4 have been determined. It has also been shown that both modules bind to alginate (15, 16). The second smallest alginate epimerase is AlgE6, consisting of one A-module followed by three R-modules (AR1R2R3). The A-modules and R-modules of AlgE4 and AlgE6 share a high sequence identity and similarity (10) but produce alginates with very different M and G distribution and content. While AlgE4 produces MG-blocks into the alginate sequence, AlgE6 produces G-blocks as end products. Only the A-modules are catalytically active (16), whereas the role of the R-module is more enigmatic. R-modules alone show no catalytic activity on alginates; nevertheless, if one R-module is bound after an A-module, the epimerization rate is increased 10-fold (16). Epimerization of alginate by AlgE4 occurs by a processive mode of action meaning that the enzyme is sliding along the alginate polymer and where both the A-module and the R-module bind to the alginate molecule (17–19). Therefore, it was suggested that the R-module helps to orient the alginate in the active site and to keep AlgE4 tightly bound to the polymer during epimerization. The role of the R-modules in G-block-producing epimerases is not clear; however, recent results obtained with a library of epimerases with mutated A-modules have indicated that R-modules can influence the epimerization pattern (20). These mutant enzymes were constructed with the R-module from AlgE4 to stimulate the activity. Aiming at generating even more potent G-block-forming epimerases, the A-modules of the high G-block-forming epimerase mutants were combined with the three R-modules from AlgE6 (20). Surprisingly, this resulted in mutant epimerases with very similar G-block-forming abilities as AlgE6. Moreover, the mode of action for AlgE6 is not as clear as for the processive AlgE4. To be able to epimerize two or more mannuronic acids in a row, the AlgE6 would have to turn 180° around the polymer chain between each epimerization step. A processive mode of action would therefore only be possible if one AlgE6 enzyme slides along the alginate polymer incorporating MG-blocks, while another AlgE6 enzyme epimerizes the newly formed MG-block to a G-block.
To understand the role of multiple R-modules in G-block-producing epimerases and moreover to understand what causes the differences between the R-modules of AlgE4 and AlgE6, we have determined the atomic resolution structures of the three R-modules of AlgE6 by NMR. Additionally, the binding of AlgE4 and AlgE6 R-modules to alginate oligomers with different composition was investigated using NMR spectroscopy and isothermal titration calorimetry (ITC). It is known that AlgE4R binds to alginate, but more detailed binding studies should reveal possible preferences of the R-modules for certain types of alginate. The A- and R-modules have defined elongated structures, but initial tests showed flexibility in the structure between the two modules (21). The overall structures of AlgE4, AlgE6, and the different A- and R-modules were determined by using small angle x-ray scattering (SAXS), also providing information on the orientation of the modules toward each other.
EXPERIMENTAL PROCEDURES
Cloning, Expression, and Purification of the R-modules
Plasmids and bacterial strains used in this study are summarized in Table 1. All plasmids, except pAT116 and pAT117, have a T7/lac promoter and ampicillin resistance gene and were transformed into Escherichia coli strain ER2566 for protein expression.
TABLE 1.
Plasmids and bacterial strains used in this study
| Plasmid | Description | Refs. |
|---|---|---|
| pTYB12 | IMPACT-CN fusion vector containing an N-terminal chitin-binding tag | New England Biolabs |
| pTYB4 | IMPACT-CN fusion vector containing a C-terminal chitin-binding tag | New England Biolabs |
| pFA8 | Derivative of pTYB12 in which the DNA sequence of AlgE6R1 was inserted as a BsmI-XmaI fragment | 23 |
| pFA12 | Derivative of pTYB12 in which the DNA sequence of AlgE6R2 was inserted as a BsmI-XmaI fragment | 24 |
| pFA13 | Derivative of pTYB12 in which the DNA sequence of AlgE6R3 was inserted as a BsmI-XmaI fragment | 25 |
| pTrc99A | Expression vector | 56 |
| pMV3 | Pm/XylS expression vector containing a mutation in Pm leading to increased expression levels | 57 |
| pAT116 | A synthetic DNA sequence encoding the A-module from AlgE4 combined with the R-modules from AlgE6 (AlgE4A(R1R2R3)AlgE6)was inserted into pTrc99A as an XmaI-EcoRI fragment | This study |
| pAT117 | A synthetic DNA sequence encoding the A-module from AlgE6 combined with the R-module from AlgE4 (AlgE6ARAlgE4) was inserted into pMV3 as an NdeI-NotI fragment | This study and 22 |
| pAT118 | A synthetic DNA sequence encoding the R-modules from AlgE6 (R1R2R3) was inserted into pTYB12 as an EcoRI-NruI fragment | This study |
| pBS32 | Derivative of pTYB4 in which the DNA sequence of AlgE4 was inserted as a NcoI-XmaI fragment | This study |
| pFA1 | Derivative of pTYB11 opened with SapI and treated with PeaR7I before insertion of the DNA sequence of AlgE4R | 58 |
| pTB26 | Derivative of pTYB4 in which the DNA sequence of AlgE4A was inserted as an NcoI-XmaI fragment | 13 |
| pMD4 | Derivative of pTYB12 in which the DNA sequence of ORF-9. | 53 |
| Bacterial strains | ||
| DH5α | E. coli DH1 derivative with deoR, nupG, Φ80dlacZΔM15 and Δ(lacZY-argF)U169 | 59 |
| ER2566 | F−λ−fhuA2 [Ion] ompT lac::T7gene1 gal SulA11 Δ(mcrC-mrr)114::IS10 R(mcr-73::miniTn10-TetS)2R(zgb-210::Tn10) (TetS) endA1 [dcm] | New England Biolabs |
| XL10-Gold | endA1 glnV44 recA1 thi-1 gyrA96 relA1 lac Hte Δ(mcrA)183 Δ(mcrCB-hsdSMR-mrr)173 tetR F'[proAB lacIqZΔM15 Tn10(TetR Amy CmR)] | Stratagene |
| RV308 | lacIq-, su-, ΔlacX74, gal IS II::OP308, strA | ATCC31608 |
The composition of expression media was as follows: 1 liter of LB medium contained 10 g of tryptone, 5 g of yeast extract, and 5 g of NaCl. The pH was adjusted to 7.2 with 4 m NaOH, and the medium was sterilized by autoclaving. For 1 liter of M9 medium, 7.2 g of Na2HPO4·2H2O, 3 g of KH2PO4, 0.5 g of NaCl, and 1g of (NH4)2SO4 were dissolved in 1 liter of H2O. The pH was adjusted to 7.4, and the medium was autoclaved. Before the expression, 2 ml of 1 m MgSO4, 20 ml of trace metal solution, and 2 g of glucose dissolved in 10 ml of H2O were sterilized by filtration and added to the medium. Trace metal solution for M9 medium contained 0.1 g/liter ZnSO4, 0.8 g/liter MnSO4, 0.5 g/liter FeSO4, 0.1 g/liter CuSO4 and 1 g/liter CaCl2. For production of 15N- and 15N,13C-labeled proteins, M9 medium was prepared with 1 g/liter (15NH4)2SO4 and 2 g/liter d-[U-13C]glucose. The 2H,15N-labeled proteins were expressed in 1 liter of M9 medium prepared with 99% D2O and supplemented with 1 g/liter (15NH4)2SO4 and 2 g/liter d-[U-2H]glucose.
Independent of which medium was used, all cells were grown at 37 °C to A600 nm ∼0.8. The cell culture was incubated on ice for 5 min. Expression was induced by addition of isopropyl 1-thio-β-d-galactopyranoside (final concentration 1 mm), and then the culture was incubated at 15 °C for 16–20 h. pAT116 and pAT117 was transformed to E. coli strains XL10-gold and RV308, respectively, and recombinant protein production was performed as described previously (20, 22). The cells were harvested by centrifugation and resuspended in 20 mm HEPES, pH 6.9, 800 mm NaCl, 5 mm CaCl2, and 0.1% Triton X-100. The cell pellet was stored at −20 °C if purification was not performed immediately. Expression of AlgE6R1, AlgE6R2, and AlgE6R3 for structure determination was described recently (23–25). AlgE4 was expressed as uniformly deuterated and 15N-labeled proteins. AlgE6R1R2R3 and ORF-9 were expressed using the same protocol as for AlgE6R1 (23). For the SAXS measurements, no isotope labeling was required, and protein expression was thus conducted in LB medium. The cells were sonicated, and the crude cell extracts were loaded on a chitin column (NEB6651, New England Biolabs). The column was washed with 20 mm HEPES, pH 6.9, 800 mm NaCl, and 5 mm CaCl2 using at least 10 column volumes. The proteins were cleaved from the chitin-binding tag by loading washing buffer containing 50 mm DTT on the column and letting it react for 40 h at room temperature. The purified proteins were eluted from the column and dialyzed using 20 mm HEPES, pH 6.9, and 25 mm CaCl2. If the proteins were not used immediately, they were freeze-dried and stored at −20 °C. Protein used for SAXS were further purified by size exclusion chromatography to remove any aggregates. Production, purification, and refolding of 2H,15N-AlgE4 and 2H,15N-AlgE4A were performed as described previously (21).
Size Exclusion Chromatography
The samples for SAXS were concentrated to less than 0.5 ml, or proteins that had been freeze-dried were dissolved in less than 0.5 ml of MilliQ water. The protein solutions were loaded on Superdex 200 10/300 GL (AlgE6 and AlgE4) or Superdex 75 HT 10/30 (AlgE6R1, AlgE6R2, AlgE6R3, AlgE4R, and AlgE4A), respectively. The samples were eluted from the column with 5 mm HEPES, pH 6.9, 50 mm NaCl, 10 mm CaCl2, and 0.5 m glycine. The monomeric fractions were concentrated to less than 0.5 ml and dialyzed using 20 mm HEPES, pH 6.9, 125 mm NaCl, 25 mm CaCl2, and 0.5 m glycine.
NMR Spectra
All NMR spectra were measured on a Bruker Avance 600 spectrometer equipped with a 5-mm Z-gradient TCI (H/C/N) cryogenic probe and on a Bruker DRX 600 spectrometer equipped with a 5-mm xyz gradient TXI (H/C/N) probe. All measurements were performed at 25 °C.
For the NMR structure, calculations of uniformly 15N- and 13C-labeled proteins were produced. Cells containing the plasmid pFA8, pFA12, or pFA13 were grown in M9 medium containing 15N- and 13C-labeled nitrogen and carbon sources as described recently (23–25). For the structural calculations, three different types of NOESY spectra were used as follows: a three-dimensional 15N-edited NOESY (mixing time of 80 ms) recorded on a sample dissolved in 95% H2O, 5% D2O; a three-dimensional 13C-edited NOESY (mixing time of 80 ms) on a sample dissolved in 99% D2O; and a two-dimensional NOESY (mixing time of 70 ms) spectrum recorded on an unlabeled sample dissolved in 99% D2O.
Structural Calculations
NOE cross-peaks were assigned and integrated manually using the program NEASY (26). The structural calculations were performed by the program CYANA (27). For the first structural calculations, torsion angle constraints obtained from the program TALOS (28) were used. After obtaining more refined structures of AlgE6R1, AlgE6R2, and AlgE6R3, the TALOS constraints were excluded from the calculations. Structural calculations started from 100 random conformations, and the 20 final conformations with the lowest target function were selected. Ca2+ ions were incorporated in the structural calculation as described previously (15). Refinement of structures was performed by the program YASARA (29) in two steps as follows: first, in vacuo using the NOVA force field, and second, in explicit water using the YASARA force field.
Protein Alignment and Surface Calculation
The amino acid sequences of AlgE4R, AlgE6R1, AlgE6R2, and AlgE6R3 were aligned by ClustalW2 (30) at the European Bioinformatics Institute. Pairwise structural alignment of the β-rolls or core proteins was performed in PyMOL (31). For simplicity reasons, numbering in the alignment of the β-roll (Fig. 1) is defined from the first identical amino acid (Gly-1 in AlgE4R(Gly-387); Gly-2 in AlgE6R1(Gly-383); and Gly-11 in both AlgE6R2(Gly-544) and AlgE6R3(Gly-705)). The core-R-modules are defined from the first identical amino acid until the C-terminal end of AlgE6R1 and AlgE6R2 or the amino acid that is in the same position when the four structures are aligned (Thr-150 in AlgE4R and Ala-161 in AlgE6R3). The structures were aligned pairwise, and the root mean square deviation of the backbone atoms (N, Cα, and C′) was calculated.
FIGURE 1.
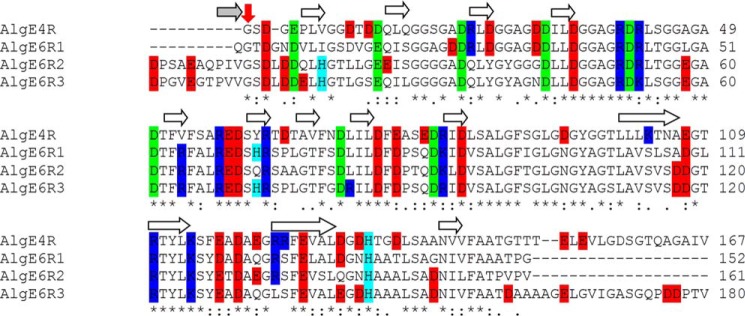
Alignment of the R-modules of AlgE6 and AlgE4. Positively (Lys and Arg) and negatively (Glu and Asp) charged residues are colored in blue and red, respectively. His residues are labeled in cyan. Asp and Glu residues that point into the β-roll for calcium coordination are marked in green. For the electrostatic surface potential calculation these amino acids were artificially protonated. To ease the comparison of the R-modules the alignment of the β-roll is defined from the first identical amino acid (Gly-1 in AlgE4R(Gly-387), Gly-2 in AlgE6R1(Gly-383), and Gly-11 in both AlgE6R2(Gly-544) and AlgE6R3(Gly-705)) (indicated by a red arrow). * indicates residues that are identical in all four R-modules; : denotes conserved amino acids, and · shows semi-conserved amino acids (explanation for the symbols can be found at ClustalW2) (30). The white arrows indicate β-strands in the R-modules, and gray indicates that β-strand only occurs in AlgE6R2 and AlgE6R3.
The electrostatic surface potential on the surface of the different R-modules was visualized by the APBS Plugin written by M. Lerner (32). Ca2+ ions could not be incorporated, and therefore aspartic acid and glutamic acid residues pointing into the β-roll were artificially protonated (Fig. 1). PDB files were transformed to pqr files by pdb2pqr (33), and these pqr files were used as input files for the APBS calculation.
Line Width
A Lorentzian line shape function was fitted to traces taken through 10 different peaks of each module of AlgE4 with the line width as variable parameter. Peaks used for the R-module were assigned as N/HN Asp-14, Leu-16, Gly-21, Gly-46, Thr-51, Phe-52, Glu-76, Asp-83, Ala-118 and Ala-131. For the A-module, there was not any assignment available. Therefore, the 15N-HSQC spectrum of AlgE4 was overlaid with a spectrum of the A-module. 10 peaks definitively belonging to the A-module were picked from both spectra, and the line width was determined using Equation 1,
 |
where w is the line width at half height in Hz; x is point in Hz, and t is center of the Lorentzian curve in Hz.
Alginate Oligomers
Poly-M (intrinsic viscosity (η) = 940 ml/g) was produced from an AlgG negative strain of Pseudomonas fluorescens (34) (produced in-house). Alginate with completely alternating structure (poly-MG) was obtained by using recombinantly produced AlgE4 purified from Hansenula polymorpha (SINTEF, Trondheim, Norway). The poly-M and poly-MG oligomers were produced as described previously (35, 36).
Alginate Binding by NMR
Binding of alginate oligomers to AlgE4R, AlgE6R1, AlgE6R2, and AlgE6R3 was investigated by NMR at 25 °C. The titration of alginate to the protein was done as described previously (15). For NMR measurements, 15N-labeled material was produced as described above. The protein concentrations used were between 0.2 and 0.5 mm. Protein concentration was determined by measuring A280 nm using a Nanodrop ND-1000 spectrophotometer and calculated by using the theoretical extinction coefficient obtained from the ProtParam software (37). R-module titrations were achieved by adding small aliquots of alginate oligomers in high concentrations (highest stock concentration 135.6 mm for M3) until no changes in the chemical shift were observed in the 15N-HSQC. By using concentrated stock solutions, the volume increase in the sample was kept at a minimum.
The chemical shift changes of N and HN atoms from the backbone of the R-module upon titration are given as an absolute change in chemical shift by Equation 2,
 |
where Δδabs is absolute change in chemical shift (Hz); ΔδH is chemical shift change of the amide proton (Hz); ΔδN is change in chemical shift of the amide nitrogen atom (Hz), and x is the constant to achieve equal contribution from changes in N and HN shifts. The constant was set to 5.
The absolute change in chemical shift was plotted versus residue. Residues that experience a Δδabs >100 Hz were considered to be affected by binding. Approximately seven of the strongest shifting peaks were used to calculate dissociation constants by fitting the experimental data to Equation 3,
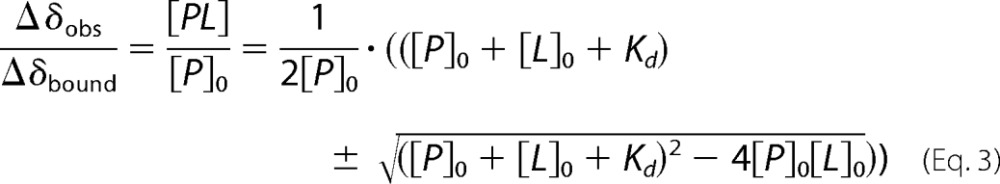 |
where Δδobs is the observed chemical shift changes at a certain point in titration (Hz); Δδbound is chemical shift changes of the atom in the protein at full ligand binding (Hz); [PL] is the protein-ligand complex concentration (mol/liter); [P]0 is the total protein concentration (free and bound) (mol/liter); [L]0 is the total ligand concentration (free and bound) (mol/liter), and Kd is the dissociation constant (mol/liter).
Dissociation Constant Determination by ITC
Calorimetric measurements were carried out with a MicroCal VP-ITC microcalorimeter at 25 °C, and the calorimeter was controlled by VPViewer 2000 Version 1.4.8® (MicroCal). For the R-module from AlgE4, the alginate oligomers were dissolved in 20 mm HEPES, pH 6.9, and 50 mm CaCl2 was added to a 0.04 mm R-module solution in 20 mm HEPES, pH 6.9, with 50 mm CaCl2, and the energy release/consumption was measured. For the R-modules from AlgE6, the alginate oligomers were dissolved in 20 mm HEPES, pH 6.9, 25 mm CaCl2, and, 40 mm NaCl were added to a 0.04 mm R-module solution in 20 mm HEPES, pH 6.9, with 25 mm CaCl2, and 40 mm NaCl. For the titration of AlgE6R1R2R3 and ORF-9, alginate oligomers dissolved in 20 mm HEPES, pH 6.9, 20 mm CaCl2, and 40 mm NaCl were added to a 0.04 mm protein solution in 20 mm HEPES, pH 6.9, with 20 mm CaCl2, and 40 mm NaCl. The heat of dilution for the alginate oligomers in the buffer was recorded separately and subtracted from the titration data prior to analysis. The data were fitted using a nonlinear least squares algorithm using a one- or two-site binding model by the Origin 7.0® software. This yields the stoichiometry (N), the equilibrium association constant (Ka; liter/mol) and the enthalpy change (ΔHr, J/mol) of the reaction. The changes in reaction free energy (ΔGr, J/mol), and entropy (ΔSr, J/mol·K), as well as the Kd were calculated using Equation 4,
SAXS Measurement
The small angle x-ray scattering measurements were performed on the laboratory-based instrument at Aarhus University, Denmark (38). It uses a rotating anode as source, multilayer mirrors, and is a two-pinhole setup where the second pinhole, situated immediately before the sample, is a home-built scatterless pinhole. The instrument has a flux of 3 × 10⁸ counts s−1. The sample to detector distance was set to 640 cm, giving a q range of 0.01–0.345 Å−1, where q is the length of the scattering vector defined as q = 4πsin(θ)/λ, where λ is the x-ray wavelength at 1.54 Å, and 2θ is the scattering angle between the incident and scattered beam. The instrument uses a two-dimensional position sensitive gas detector (HiSTAR), and the recorded data are corrected for variation in detector sensitivity and distortion according to standard procedures (38). The data were collected with the sample in a reusable quartz capillary, and all measurements were carried out at 4 °C. The scattering patterns were collected for between 3 and 4 h, depending on protein concentration. The protein concentrations were between 1 and 2 mg/ml. Additionally, scattering patterns of the buffers were collected for all samples and used for background subtraction. Conversion of the data to absolute scale by use of water as a primary standard was performed using the SUPERSAXS program package. The final intensity is displayed as a function of the modulus of the scattering vector q.
SAXS Analysis and Modeling
An indirect Fourier transformation (IFT) was used to obtain the pair distance distribution function, p(r) function. This was done using the program WIFT (39). From the IFT, several parameters were obtained as follows: the maximum distance within the particle, Dmax; the radius of gyration, Rg; and the forward scattering I(q = 0). Using the forward scattering, the molecular mass was determined for the molecule in solution as shown in Equation 5,
where c is the protein concentration, and Δρm is the scattering length density difference per unit mass for which a standard value of 2.0 × 1010 cm/g was used.
The scattering data of the single modules were compared with atomic resolution structures either by use of the known PDB files (AlgE4A, AlgE4R, AlgE6R1, AlgE6R2, and AlgE6R3) or as no PDB file of AlgE6A was available, a homology model was generated by SwissModel (40). The theoretical scattering for these structures in solution is computed using spherical harmonics, and a hydration layer on the molecule is taken into account using the program CRYSOL (41). The discrepancy between the experimental scattering data and the computed scattering pattern was optimized, and the values are reported.
Flexible structures are analyzed using the Ensemble Optimization Method (42), where the flexibility is modeled by representing the scattering data as an ensemble of protein conformations. The structures constituting the ensemble are selected by a genetic algorithm from a large pool (10,000 conformations) of randomly generated structures. The structures are selected to minimize the discrepancy between the average scattering profile of the ensemble and the experimental scattering data.
Scattering from the full-length proteins were modeled using rigid-body optimization of models for the modules. The relative position of the individual modules was optimized to ensure the best agreement with the experimental scattering data. The optimization was performed using a simulated annealing protocol, where interconnection between the modules was imposed and steric clashes were avoided. The interconnection, i.e. the linker region, was determined from the amino acid sequence. For AlgE4, the linker sequence (GATPQQPST) was inserted between Pro-377 and Thr-386. For AlgE6, the linker sequences were defined as follows: 375GTVSAPPQ382, 530ATPGD534, and 683ADNILFATPVPVD695. Between the R-modules of AlgE6, the aforementioned linker residues were deleted from the atomic resolution structures and re-inserted as amino acids with physical size of 3.5 Å each. This procedure was implemented in the program BUNCH (43). The models obtained were not unique, due to the randomness involved in the search. Therefore, a minimum of 10 runs were performed, and the individual models were aligned, compared, and filtered using the programs SUPCOMP and DAMAVER (44). In comparing the models, a similar measure of the models was obtained, called normalized spatial discrepancy (NSD), and the most representative model from the set of the models was provided.
RESULTS
Sequence Alignment of the R-modules of AlgE4 and AlgE6 Reveal Properties Important for Enzyme-Substrate Interactions
The sequences of the three R-modules from AlgE6 were aligned with the R-module of AlgE4 for determining differences in the primary structure. The last R-module of each extracellular alginate epimerase from A. vinelandii has an unstructured peptide of ∼20 amino acids that might be essential for secretion via an ATP-binding cassette transporter to the extracellular environment (45). But for the following comparison, this tail was not included. The amino acid identity between the four R-modules is relatively high i.e. 75 out of 150 amino acids or 50% identity (Fig. 1). In addition, many of the amino acid differences can be classified as conserved or semi-conserved, and the differences were not equally distributed throughout the sequences. Of the first 18 amino acids (where all four sequences are aligned), only four were identical. Identity increases to 10 for the next 18 amino acids. Nearly all the amino acids were conserved, except for two regions of five amino acids for the remaining alignment. As the epimerase substrate alginate is a polyanionic polymer, positive amino acids can be anticipated to be important for the substrate interaction. Overall, AlgE4R has 11 positive amino acids in total, whereas AlgE6R1 has 10, and both AlgE6R2 and R3 have nine positive amino acids. The alignment shows that AlgE4R has two additional positively charged amino acids, Lys-103 and Arg-124 (numbering based on AlgE4R), which both are serines in the R-modules from AlgE6. Furthermore, AlgE4R also has Arg-24, which is only found in R1 of AlgE6. AlgE6R3 has an additional arginine at amino acid position 71 compared with the other R-modules. Histidine 133 is conserved throughout the R-modules, and additional histidines are found at position 62 in AlgE6R1, eight in AlgE6R2, and 8 and 62 in AlgE6R3. These can potentially also interact with alginate.
If only the three R-modules of AlgE6 are compared, 67% of all amino acids were identical, and only on four positions all three of the R-modules have different amino acids (Fig. 1). After the first 36 amino acids (in AlgE6R1) or 45 amino acids (in AlgE6R2 and AlgE6R3), respectively, nearly every amino acid was identical. Moreover, AlgE6R2 and AlgE6R3 have an N-terminal nonapeptide constituting a proline-rich linker between the R-modules of AlgE6.
Overall Structure of Individual R-modules from AlgE4 and AlgE6 Are Very Similar
The structures of the three R-modules of AlgE6 were determined by NMR on the basis of NOE upper distance limits and torsion angle constraints obtained by the TALOS+ software (46). The experimental data and structural statistics for the three structures are summarized in Table 2. The overall three-dimensional structural fold of the three R-modules of AlgE6 are very similar to each other and to AlgE4R (Fig. 2). The geometrical constraints and coordinate files were deposited in the Protein Data bank under the accession code 2ML1 (AlgE6R1), 2ML2 (AlgE6R2), and 2ML3 (AlgE6R3).
TABLE 2.
Summary of the results of the structure calculations of the three R-module structures
The structure of each module was calculated with and without Ca2+ ion incorporation. All root mean square deviations were calculated in MolMol (61).
| AlgE6R1 |
AlgE6R2 |
AlgE6R3 |
||||
|---|---|---|---|---|---|---|
| Without Ca2+ ions | With Ca2+ ions | Without Ca2+ ions | With Ca2+ ions | Without Ca2+ ions | With Ca2+ ions | |
| Total no. of NOE constraints | 1517 | 3554 | 3535 | 3579 | 2057 | 2146 |
| Intra | 650 | 2181 | 2316 | 2316 | 865 | 889 |
| Short | 476 | 782 | 760 | 760 | 589 | 606 |
| Medium | 42 | 112 | 106 | 106 | 118 | 98 |
| Long | 349 | 479 | 353 | 397 | 485 | 553 |
| Cyana target function value (Å) | 2.81 ± 1.18 | 2.55 ± 0.92 | 1.17 ± 0.30 | 2.65 ± 0.4 | 2.70 ± 0.86 | 1.17 ± 0.42 |
| Distance constraint violation ( >10 structures) | < 0.1 | < 0.1 | < 0.2 | < 0.2 | < 0.1 | < 0.1 |
| Root mean square deviations | ||||||
| N, Cα, C′ (core R-module)a | 1.651 | 2.397 | 2.256 | 1.967 | 1.769 | 1.864 |
| N, Cα, C′ (secondary structure elements)b | 0.671 | 1.178 | 1.191 | 1.038 | 0.954 | 0.941 |
| Heavy atoms (core R-module)a | 1.945 | 2.840 | 2.732 | 2.455 | 2.015 | 2.077 |
| Heavy atoms (secondary structure elements)b | 1.163 | 1.933 | 1.649 | 1.521 | 1.379 | 1.354 |
a Core R-modules are from the first identical amino acid (Gly-1 in AlgE4R, Gly-3 in AlgE6R1, Gly-11, in AlgE6R2, and Gly-11 in AlgE6R3 see also supplemental Fig. S1) until the C-terminal end of AlgE6R1 and AlgE6R2 or the amino acid that is in the same position when the four structures are aligned (Thr-150 in AlgE4R and Ala-162 in AlgE6R3).
FIGURE 2.
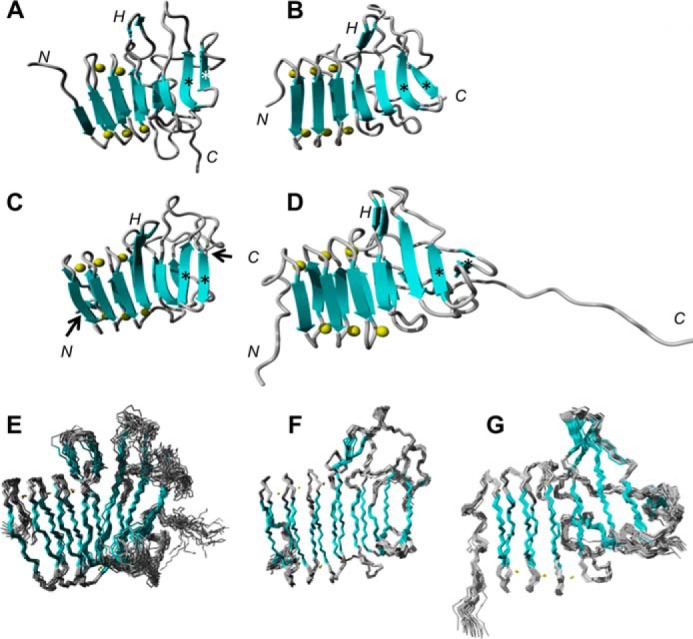
Structure overview of AlgE4R and the R-modules of AlgE6. A, AlgE4R; B, AlgE6R1 (structural family, E); C, AlgE6R2 (structural family, F); D, AlgE6R3 (structural family, G); where highly disordered residues 170–181 of AlgE6R3 are not shown. The β-strands are indicated by cyan arrows; calcium ions are indicated by yellow sphere; N, N-term; C, C-term; H, hairpin; *, antiparallel β-strands. Overall, the structures of the R-modules are very similar to each other, and they have the general structure as described in the following. The structured N-terminal end of the R-modules are formed by a β-roll defined by three amino acids forming a short β-strand and six amino acids forming a loop to the next short β-strand followed by six amino acids forming the next loop, resulting in an 18-amino acid β-roll unit. This structure is repeated three times making up three turns of the β-roll and then a loop forms an anti-parallelβ-hairpin. The polypeptide chain folds back and makes a new turn elongating the β-roll. Hereafter, a longer loop is bulging out, followed by a less well defined region. The structure ends with two antiparallel β-strands. The last β-strand links them to one of the parallel β-sheets making up the β-roll. The β-strand is situated in between the roll and the anti-parallel β-sheet, being parallel to the first and antiparallel to the latter.
The first 54 amino acid residues of AlgE6R1 or 63 AlgE6R2 and AlgE6R3, respectively, form a right-handed parallel β-roll where each complete turn consists of 18 amino acids or two RTX motifs (Repeat in ToXin) (47). The sequence of the RTX motif consists of the nonapeptide GGXGXDZUZ, where the glycine and aspartic acid residues are highly conserved. U is always a large hydrophobic amino acid, mainly leucine and sometimes replaced by isoleucine, valine, or phenylalanine. X can be any amino acid but mostly one with a short side chain, and Z is an amino acid with a long side chain. The first six amino acids form a tight loop that also binds Ca2+, whereas the last three amino acids form a short β-strand. The compact structure of the β-roll is opened by the sequence FRF (53–55 in AlgE6R1, 63–65 in AlgE6R2, and AlgE6R3) followed by an anti-parallel hairpin structure. The chain folds back and makes a new but less defined turn extending the β-roll. The next 10 amino acids are less well defined followed by three long antiparallel β-strands (Fig. 2). The last β-strand is also parallel to the penultimate β-strand of the β-roll. There is an additional long loop, and the last β-strand completes the β-roll. The last 21 amino acids of AlgE6R3 are unstructured and, as commented earlier, can be essential sequence for secretion (45).
Overall, the R-modules from AlgE6 consist of the same secondary structural elements and overall architecture also exhibited by the structure of AlgE4 R-module. The major differences between all the R-modules are in the orientation of the hairpin structure and the orientation of the antiparallel β-strands relative to the β-roll (Fig. 2).
Charge Distribution on the Surface of the R-modules
As pointed out above, it is likely that the positively charged amino acids in the R-modules are important for interaction with the polyanionic alginate polymer. The electrostatic surfaces of the R-modules have been calculated and are visualized in Fig. 3. In general, the front side of the R-modules all display positively charged regions along a shallow groove perpendicular to the β-strands and as shown previously for AlgE4R (see below and Ref. 15), this surface is able to bind pentameric mannuronate. The electrostatic surface of AlgE6R1 is similar to the surface of AlgE4R, but with a less pronounced positive potential. AlgE6R2 and AlgE6R3 do not show as an extended and clear charge separation as AlgE6R1 and AlgE4R. The charges on the surface of AlgE6R2 are more spread and less concentrated than in AlgE4R. AlgE6R3 has a groove on the front side that shows a strong positive potential. This groove is made up by Arg-40, Lys-42, Arg-71, and Arg-110, where all except Arg-71 are conserved throughout the R-modules. AlgE6R1 and AlgE6R2 have a leucine in this position. Except for this dense and positively charged spot on AlgE6R3, the rest of the electrostatic surface has far less patches with positive potential than the other R-modules.
FIGURE 3.
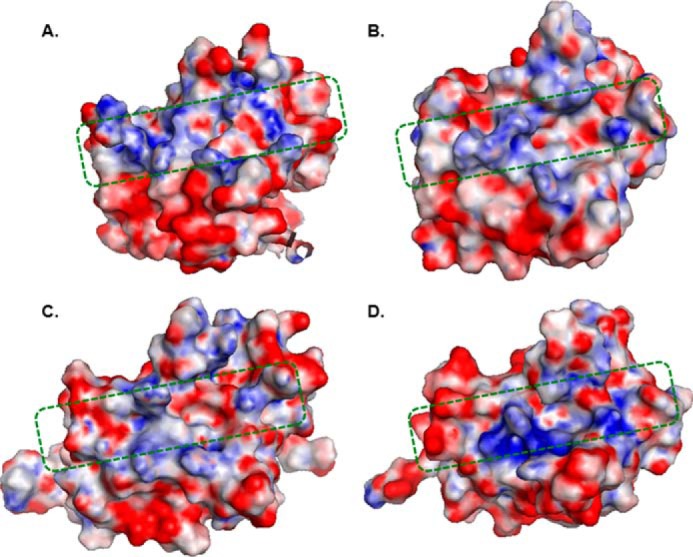
Electrostatic surface potential of R-modules. A, AlgE4R; B, AlgE6R1; C, AlgE6R2; D, AlgE6R3. Red and blue denote the regions of negative (i.e. less than −3 kT/|e|) and positive (i.e. more than +3 kT/|e|) potentials on the protein surface, respectively. Asp and Glu residues involved in calcium binding were artificially protonated before surface electrostatics calculation (see Fig. 1). Electrostatic potential distribution calculations were performed with APBS at pH 7.0 with an ionic strength of 0.4 m (32). The area within the green dotted square indicated the shallow substrate binding groove. Visualization of the potential plotted on the solvent-accessible surface was made with PyMOL version 0.99 (31).
Module Orientation and Overall Shape of AlgE4 and AlgE6
Small-angle x-ray scattering data (Fig. 4) were collected for the R- and A-modules separately and for full-length AlgE4 and AlgE6. These data were subsequently analyzed using the model independent IFT method (48), which can provide information on the overall size and shape of alginate epimerases. This method results in paired distance distribution functions, p(r) function and the maximum distance of the molecule, Dmax. Furthermore, data on the radius of gyration, Rg, and forward scattering, I(q = 0), were obtained, facilitating determination of the molecular weight. All four R-modules are spherical in shape, as seen from the bell-shaped p(r) function and have a maximum distance between 45 and 50 Å (Table 3 and Fig. 4, A and B). Several of the p(r) functions obtained for the R-modules had the Dmax/2 shifted to the left suggesting that the shape could be described as being ellipsoid rather than fully spherical. The molecular weight determined using the forward scattering (Table 3) corresponds to monomeric molecules for the R-domains, and this is also similar for AlgE4A, AlgE4, and AlgE6. The AlgE4A domain has a slightly elongated shape with a maximum distance of 65 Å (Fig. 4B). The slight elongation was seen from the position of the maximum of the curve that shifted slightly to the left of Dmax/2. The whole AlgE4 has a maximum distance of 100 Å, and the shape of the p(r) function corresponds to that of an elongated particle, seen from the significant shift of the maximum to the left (Fig. 4B). For AlgE6, the scattering indicates an elongated shape with a maximum distance of 180 Å (Table 3 and Fig. 4B). The shape of the p(r) function for AlgE6 also corresponds to an elongated shape based on the shift of the maximum to the left (Table 3 and Fig. 4D). The Rg values obtained from the IFT analysis agree with those obtained using the Guinier approximation (Table 3 and supplemental Fig. S1).
FIGURE 4.

Domain orientation. A, small angle x-ray scattering data for AlgE4R (open black circles), AlgE4A (open red circles), AlgE4 (open blue circles), AlgE6R1 (open magenta circles), AlgE6R2 (open green circles), AlgE6R31 (open orange circles), and AlgE6 (open wine red circles) in addition to their IFT fits (full lines). All data plotted as open gray circles in A and C are not included in the fitting procedures. B, p(r)-functions obtained form the IFT analysis. Color code are the same as in A. C, scattering data for all molecules with model fits. Color codes are the same as in A. The data for AlgE4R (PDB code 2AGM), AlgE4A (PDB code 2PYH), AlgE6R1 (PDB code 2ML1), and AlgE6R2 (PDB code 2ML2) are fitted using CRYSOL. The data for AlgE4 and AlgE6 are fitted using BUNCH. For AlgE6R3, three different model fits are shown: CRYSOL (dashed orange line), CRYSOL with added blob scattering (dashed gray line), and EOM (full orange line). The data in A and C are rescaled to improve visibility of all data. The data are scaled in the following manner: AlgE4R factor 100; AlgE4A factor 101; AlgE4 factor 102; AlgE6R1 factor 103; AlgE6R2 factor 104; AlgE6R3 factor 105; and AlgE6 factor 106. D, best AlgE4 model in red overlay with the remaining nine models (gray semitransparent surface). E, distribution of the Rg value from the EOM ensemble before optimization of the ensemble (blue area) and after (red area). The models are shown as an inset where the main part of AlgE6R3 is red and the flexible tail is blue. F, Kratky plot (I(q)q2 versus q) of AlgE6R3. G, best AlgE6 model in red overlay with the remaining nine models (gray semitransparent surface). The models are overlaid to obtain the best overall superposition of the entire model. This is done using the programs SUPCOMB and DAMAVER.
TABLE 3.
Results obtained from the SAXS data by performing an IFT analysis
Molecular weight was calculated from I(q = 0). The calculated molecular weights were determined by use of ProtParam (60).
| Protein | Rg (IFT analysis) | Rg (Guinier analysis) | Dmax | MrI(0) | Mr |
|---|---|---|---|---|---|
| Å | Å | Å | kDa | kDa | |
| AlgE4 | 31.3 ± 1 | 31.1 ± 1 | 100 ± 10 | 53 ± 6 | 57.7 |
| AlgE4A | 22.0 ± 1 | 20.1 ± 1 | 65 ± 10 | 44 ± 5 | 39.9 |
| AlgE4R | 18.7 ± 1 | 19.4 ± 1 | 50 ± 5 | 17 ± 2 | 17.0 |
| AlgE6 | 55.4 ± 1 | 51.8 ± 1 | 180 ± 10 | 100 ± 10 | 90.2 |
| AlgE6R1 | 15.6 ± 1 | 16.3 ± 1 | 45 ± 5 | 16 ± 1.5 | 15.5 |
| AlgE6R2 | 16.0 ± 1 | 16.5 ± 1 | 47 ± 5 | 20 ± 2 | 16.5 |
| AlgE6R3 | 16.6 ± 1 | 16.8 ± 1 | 50 ± 5 | 21 ± 3 | 18.2 |
To further investigate the solution structure of the A- and R-modules of AlgE4, a priori information was utilized. Atomic resolution structures are known for the two modules, and these were used to calculate the theoretical scattering pattern. We compared these to the experimentally obtained scattering data using the program CRYSOL (Fig. 4C) (41). The theoretical pattern agrees nicely with the scattering data, with reduced χ2 values of 1.91 for the R-module and 1.94 for the A-module.
The solution structure of full-length AlgE4 was determined from the SAXS data by rigid body modeling using the module structures with atomic resolution. These were connected by dummy residues to mimic the linkers between the different modules. The optimization of the modules relative to each other was performed using the program BUNCH (43), which uses a simulated annealing procedure where steric clashes are avoided and the modules are interconnected. Multiple BUNCH runs were performed, and only one population of structures was found with an NSD of 1.11. The models were compared and averaged using the program package DAMAVER (44). Here, the most representative model was also determined and defined as the model having the highest degree of similarities to all the other models. This model yields a good fit with a reduced χ2 of 1.23 (Fig. 4C). Modeling of the entire AlgE4 (Fig. 4D) shows an elongated overall shape that is also in good agreement with the p(r) function.
SAXS data collected for full-length AlgE6 and its individual R-modules were used for modeling the whole AlgE6. From the initial data analysis, the molecular weights and the Dmax values suggest the presence of monomeric proteins in all solutions (Table 3). However, for the R modules, data below q = 0.02 Å−1 was discarded due to the upturn of the data by the presence of large aggregates in the solution, which was not possible to remove in the purification process. However, this does not significantly affect the scattering from the single molecules because the large structures are much larger than the single molecules and one also still observes a clear Guinier region for the single molecules (Fig. 4A and supplemental Fig. S1). To further investigate the solution structures of the individual modules, the theoretical scattering patterns from the available models with atomic resolution, for the A- and R-modules, is calculated using the program CRYSOL (Fig. 4C) (41). From the computation (Fig. 4C), it is evident that the AlgE6R1 and AlgE6R2 modules have a shape in solution similar to that of their models with atomic resolution. The corresponding reduced χ2 values obtained were 1.73 and 4.60. However, for the AlgE6R3 module a clear difference was found between the theoretical scattering pattern and the experimental data with a reduced χ2 value of 37.1 (Fig. 4C). The poor quality of the fit originates from the large discrepancy between data and fit at high q above 0.15 Å−1, where the model underestimates the data.
This additional intensity could possibly originate from fluctuation scattering, which is observed for flexible protein structures. The presence of flexibility in the protein is also supported by plotting the scattering data in a Kratky plot (Fig. 4F), where an upturn is seen at high q values indicative of flexibility. To investigate this possible explanation, the additional intensity contribution was described by the scattering from a Gaussian chain (49), which increased the fit quality substantially from χ2 37.1 to 2.05 (Fig. 4C). Thus, some flexibility should be present in the structure that agrees well with the fact that the R3-module has a 20-residue long flexible tail. To investigate the flexibility of the AlgE6R3 module further, the ensemble optimization method (EOM) (42) was applied. In EOM, a large ensemble of structures were generated, and a subset of these were selected by a generic algorithm to best fit the scattering data. With this method, a good agreement between the model and the scattering data was obtained with a reduced χ2 of 0.95 (Fig. 4C). It is clear from the Rg distribution of the ensemble before optimization compared with the Rg distribution of the ensemble after optimization (Fig. 4E) that the tail is not stretched away from the main body of AlgE6R3, rather it is found close to this, which is perhaps better visualized in the models (Fig. 4E, inset).
Investigation of the full-length AlgE6 (Fig. 4G) in solution was performed by rigid body modeling of the SAXS data, as was also done for full-length AlgE4. In addition to the exploration of the module structures with atomic resolution, the 20-residue flexible tail of the AlgE6R3 module was included as dummy residues. The optimization of the modules relative to each other and comparison of multiple runs were performed in the same manner as for AlgE4. Only one population of structures was found with an NSD of 1.08, and the most representative model yields a good fit with a reduced χ2 value of 1.58 (Fig. 4C). A comparison of the SAXS data with a model for AlgE6 in a fully stretched state was also done by calculating the theoretical scattering by CRYSOL of such a model. From the fit quality, it is evident that this structure cannot describe the experimental scattering data satisfactorily, yielding a reduced χ2 value of 20.6 (data not shown).
Line Width
Dynamic behavior of molecules was also reflected in NMR data, like in the line width and intensity of the peaks. The slower the molecule reorients in solution the broader peaks are observed the spectrum, which is also known as line broadening. The line widths of 10 peaks belonging to the A-module or to the R-module, respectively, in a uniformed 2H,15N-AlgE4 (21) were measured. For comparison, the line width of the same 10 peaks of the A-module was measured in U-2H,15N-AlgE4A. The average line width of the peaks from the R-module in AlgE4 is 12.58 ± 1.82 Hz and is significantly narrower than from the A-module in AlgE4 (16.67 ± 3.06 Hz), supporting the hypothesis that the modules have a flexible linker between them. Another indication of a flexible linker between the A- and the R-module in the whole AlgE4 is the intensity of the peaks. The volume and height of a peak from the R-module is bigger than from the A-module, also indicating that the A- and R-modules relax with different rates (Fig. 5). In silico analysis of the linker region between the A- and R-modules of AlgE4 predicted no secondary structure elements (50, 51), and the linker region is relatively proline-rich (GEPGATPQQPST).
FIGURE 5.

Dynamic behavior of the A and R-module. Left, transverse relaxation optimized spectroscopy (TROSY)HSQC of [U-2H,15N]AlgE4. Right, cross-section through a representative peak from the A module (left) and R module (right), respectively. The peak belonging to the R-module is approximately three to four times higher than the peak from the A-module and is significantly narrower. This shows that the two modules have some degree of conformational freedom. Neither SDS-PAGE nor MS-data (data not shown) show any degradation of AlgE4 into the A- and R-module in the NMR sample used.
Alginate Binding Studies
Previously, it has been shown that both the A- and R-modules of AlgE4 bind oligomeric mannuronate (13, 15, 52). In this study, this was investigated in more detail, performing binding studies between AlgE4R and alginates that varied in length and M/G composition by NMR and ITC. Chemical shift perturbations of individual amino acids obtain for AlgE4R during interaction with different alginate oligomers using NMR are shown in Fig. 6A. Here, amino acids that are significantly affected by interaction with a given alginate oligomer (M3–M6, MG4, and MG7) are indicated along the amino acid sequences of the R-module. Most of these amino acids are located in three clusters for AlgE4R. The first cluster covers residues 38–43, and the second cluster covers residues 61–71. The last cluster is located between amino acids 101 and 136; however, not all amino acids are affected. The length and type of alginate oligomer have little influence on which of the amino acids that is most affected by interaction. The surface area of AlgE4R that is affected by interaction with alginate oligomers is visualized in Fig. 6B. Most of the amino acids that experience major shift changes are clustered on the front side of AlgE4R at the antiparallel β-hairpin and the long antiparallel β-strands.
FIGURE 6.
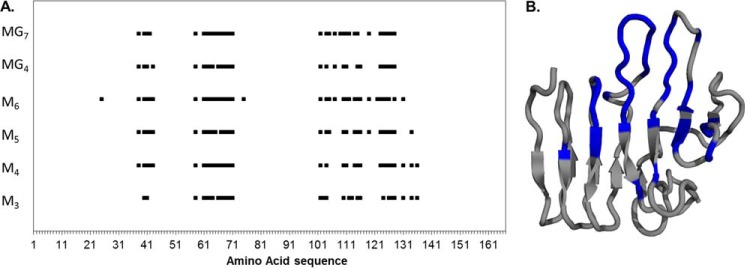
Chemical shift perturbation patterns of alginate oligomer binding on the AlgE4R module measured by NMR. A, amino acids residues that experience a chemical shift change |Δδbound| of >100 Hz are plotted as a dot along the primary amino acid sequence for the alginate oligomers that were used in the experiments. When more than one amino acid in a row experiences chemical shift changes, it results in bar, where the length is proportional to the affected area. The alginate oligomer type and length has hardly any influence on the location of the perturbation. B, amino acid residues with a chemical shift change |Δδbound| of >100 Hz for the interaction with hexameric M are highlighted in blue on the backbone ribbon structure of the AlgE4R-module.
Besides the chemical shift perturbation data obtained by NMR, the affinity of different alginate oligomers for AlgE4R was determined by ITC. The dissociation constants and thermodynamic data are summarized in Table 4 and shown in Fig. 7. Both NMR and ITC data are similar and show that the dissociation constant decreases with increasing length of the alginate oligomer. For M8 and higher, the ITC data suggested a binding ratio of 1:2, where two AlgE4R can bind to one oligomer chain. Because of high dissociation constants for the interaction between AlgE4R and MG oligomers, the ITC measurements could not be performed under optimal conditions, which inevitably lead to high uncertainty in the obtained results. However, the data clearly shows that the R-module of AlgE4 has higher affinity for poly-M than for poly-MG with the same degree of polymerization. Titration of AlgE4R with poly-G oligomers did not reveal any measurable interaction. The thermodynamic parameters (Table 4) for the AlgE4-alginate oligomer interaction clearly show an enthalpy-driven association with an entropy penalty from binding the oligomer.
TABLE 4.
Dissociation constants and other thermodynamic data for the R-module from AlgE4 determined at 25 °C
Calculations from NMR data were done assuming a 1:1 (n = 1) complex. Nearly all the ITC data could be fitted to n = 1. M8 and M9 could not be fitted with one binding event.
| Ligand | NMR, Kd | ITC |
||||
|---|---|---|---|---|---|---|
| n | Kd | ΔH | −ΔS·T | ΔG | ||
| μm | μm | kJ/mol | kJ/mol | kJ/mol | ||
| M3 | 883 ± 98.1 | Fixed to 1 | 323 ± 3.8 | −33.8 ± 0.2 | −13.9 | −19.9 ± 1.4 |
| M4 | 191 ± 27.2 | Fixed to 1 | 26 ± 2.0 | −45.4 ± 1.4 | −19.3 | −26.1 ± 2.4 |
| M5 | 2.72 ± 1.91 | Fixed to 1 | 3.75 ± 0.06 | −41.9 ± 0.2 | −10.9 | −31.0 ± 1.1 |
| M6 | 0.41 ± 0.30 | Fixed to 1 | 1.03 ± 0.25 | −46.8 ± 1.7 | −12.6 | −34.2 ± 2.1 |
| M7 | Fixed to 1 | 0.46 ± 0.02 | −45.0 ± 0.2 | −8.8 | −36.2 ± 0.9 | |
| M8 −1a | 0.499 ± 0.016 | 0.36 ± 0.02 | −44.1 ± 3.1 | −7.4 | −36.7 ± 3.2 | |
| M8 −2a | 0.465 ± 0.017 | 0.09 ± 0.01 | −83.2 ± 2.2 | −42.8 | −40.4 ± 4.8 | |
| M9 −1a | 0.418 ± 0.018 | 0.57 ± 0.03 | −11.6 ± 6.3 | 24.0 | −35.6 ± 6.7 | |
| M9 −2a | 0.601 ± 0.02 | 0.15 ± 0.02 | −91.8 ± 1.8 | −52.9 | −38.9 ± 5.6 | |
| MG4 | 156 ± 23.4 | Fixed to 1 | 2040 ± 110 | −47.8 ± 1.55 | −32.4 | −15.4 ± 3.6 |
| MG5 | Fixed to 1 | 4115 ± 239 | −230 ± 12.8 | −216.1 | −13.9 ± 25.2 | |
| MG6 | Fixed to 1 | 1204 ± 67 | −98.5 ± 2.99 | −81.9 | −16.6 ± 8.7 | |
| MG7 | 314 ± 75.2 | |||||
| MG8 | Fixed to 1 | 1330 ± 132 | −210 ± 20.1 | −652.1 | −15.9 ± 27.9 | |
a Data were obtained by calculating two binding events.
FIGURE 7.

Results for interaction between R-modules and alginate obtained with ITC and NMR. The graph shows Kd obtained from the ITC (A) and NMR (B) measurements. In general, MG oligomers have higher dissociation constants than poly-M at the same degree of polymerization. NMR data fit well to the data obtained by ITC. Kd depends strongly on the degree of polymerization.
Oligo-M, MG, and G alginates were tested with each individual R-module of AlgE6 by either NMR or ITC. These data revealed that none of the single R-modules of AlgE6 binds to any alginate. This was very surprising because the sequence and structural identity between AlgE4R and the R-modules of AlgE6 are very high. As a consequence of these results, a new construct containing all three R-modules (R1R2R3) from AlgE6 was made. ITC titration of R1R2R3 with M oligomers shows a weak interaction with M10 that grew stronger with increased oligomer length (Fig. 7A and Table 4). Similar ITC results have been obtained for ORF-9, which is a protein of unknown function from A. vinelandii consisting of seven R-modules (Fig. 7A) (53). As it is difficult to prepare pure homo-oligomers with a degree of polymerization above ≈12, the obtained ITC values should be viewed as a general trend for the interaction between protein and alginate. The thermograms for titration of MG13–14 with R1R2R3 showed only a vague indication of an interaction, and therefore, further attempts were not undertaken. Similar to AlgE4R, the thermodynamic parameters for the interaction of R1R2R3 with alginate oligomers indicate an enthalpy-driven association with an entropy penalty.
Construction of New Alginate Epimerases
Based on both ITC and NMR data, it can be concluded that the R-module of AlgE4 has stronger interactions with poly-M and poly-MG than the AlgE6 R-modules. This means that the average contact time per productive binding between enzyme and substrate increases as AlgE4R could stabilize the enzyme-substrate complex. In principle, this would lead to a higher number of sugar units epimerized per enzyme-substrate contact given the assumption that the reaction rate for one epimerization is similar for both AlgE4 and AlgE6. This hypothesis was tested by swapping of the R-modules between AlgE4 and AlgE6. In principle, this should for the combination of the AlgE6 A-module with the AlgE4 R-module (referred to as AlgE64) result in an enzyme that is able to introduce more G-blocks than AlgE6 as the interaction time per productive binding should increase due to the higher alginate affinity of AlgE4R. For an enzyme composed of the A-module from AlgE4 and the R-modules from AlgE6 (AlgE46), the result should be production of MG-blocks (as for AlgE4) but with a lower overall G-content than AlgE4. The extra length of the R-modules in AlgE46 might require a longer stretch of the substrate to make productive binding. The alginate block composition of poly-M epimerized with AlgE4, AlgE46, AlgE6, and AlgE64 are given in Table 5. Indeed, the end point epimerization results demonstrate clearly that AlgE64 leads to introduction of a higher level of G-blocks than AlgE6 and that AlgE46 gives alternating MG structures but with a lower total G-content.
TABLE 5.
Distribution of M and G units obtained from end point epimerization of poly-M
Monomers, diads, triads, and average G-block lengths were calculated based on 1H NMR spectra obtained from poly-M epimerized with AlgE46 or AlgE64.
| FG | FM | FGG | FMG/GM | FMM | FMGG/GGM | FMGM | FGGG | NG>1 | |
|---|---|---|---|---|---|---|---|---|---|
| AlgE4 | 0.46 | 0.54 | 0 | 0.46 | 0.08 | 0 | 0.46 | 0 | 0 |
| AlgE46 | 0.41 | 0.59 | 0 | 0.41 | 0.17 | 0 | 0.41 | 0 | 0 |
| AlgE6 | 0.62 | 0.38 | 0.52 | 0.11 | 0.272 | 0.03 | 0.09 | 0.52 | 12.0 |
| AlgE64 | 0.82 | 0.18 | 0.75 | 0.08 | 0.10 | 0.06 | 0.07 | 0.69 | 16.0 |
DISCUSSION
Structure and Shape
The overall structures for the R-modules of AlgE4 and AlgE6 are nearly identical, being a result of the high primary sequence identity for the four R-modules. There is also a high sequence and structure similarity between the initial β-roll of the R-modules and the RTX domain of the metalloproteases from Pseudomonas aeruginosa (PDB code 1KAP) and Serratia marcescens (PDB code 1SAT), which coordinate one Ca2+ ion between two neighboring loops in the β-roll (54, 55). It has been shown by radioactive assay with 45Ca (16) that the R-modules bind Ca2+ ions. We incorporated the geometry from these Ca2+-binding motifs into the structural calculations as described for AlgE4R (15). Introducing the Ca2+ ions into the R-modules of AlgE6 structures assuming they are bound in the same way as in AlgE4R did not change the structures or introduce additional violations (distance constraints and van der Waals repulsions) for the calculated structures. This indicates that binding of Ca2+ ions in these sites of R-modules is indeed possible.
The SAXS measurements allow for extracting low resolution structure data for AlgE4 and AlgE6, these being the first structural models of full-length extracellular alginate epimerases. Based on a rigid body model, full-length AlgE4 seems to have an elongated shape, where the R-module continues as an extension of the A-module. The model also shows that certain molecular flexibility is possible between the A- and R-modules of AlgE4. This correlates well with NMR data of the full-length AlgE4 showing that the average line width of the A-module is 16.67 ± 3.06 Hz, whereas the corresponding values for the R-module is 12.58 ± 1.82 Hz, thus suggesting some degree of orientational flexibility between the two modules. The rigid body model of AlgE6 showed that the modules have a defined orientation relative to each other, and to some extent R-modules continue as a prolongation of the A-module. Interestingly, the model indicated that the three R-modules do not have a linear orientation but form a bend. Again, the model seems to suggest some orientational flexibility between the modules. The sequences between the R-modules show a high content of prolines, which is known to break secondary structural elements and thus introduce flexibility. It is likely that this flexibility is needed for transport and substrate-product interaction. In total, the results from SAXS and NMR data suggest that the epimerases adopt an overall elongated shape with some flexibility between the individual modules.
Alginate Binding
The R-module of AlgE4 shows a clear preference for poly-M alginate over MG alginate and displays a well defined binding groove (Fig. 6 and 7). Poly-G alginate was not tested, as it could not be dissolved in the buffer conditions used for AlgE4R. The protein needs Ca2+ to retain its fold; however, poly-G alginate also binds Ca2+ leading to alginate gel formation. Attempts to perform ITC measurement in Ca2+-free buffer failed, which is probably due to the structural instability of the R-module from AlgE4 in the absence of Ca2+ (15). The highest binding energies were measured with M5 and longer oligomers (Fig. 6 and 7). M5 has approximately the same length as the maximal distance between the basic amino acids of AlgE4R (Arg-24 and Lys-103, Fig. 8). Most of the amino acids that are affected by the alginate binding are in the groove with an electropositive surface potential (Fig. 3), and it seems that alginate binds over the entire length of AlgE4R. The fact that M3 to M5 lead to chemical shift perturbations over nearly the same surface area of the R-module, whereas the dissociation constant of the binding decreases by 10-fold with increasing numbers of M subunits, suggests that there is a multiple number of binding sites available and that short alginate oligomers cannot cover all binding sites simultaneously but can freely move between different binding subsites in the alginate binding groove. The longer M8 and M9 show two distinct binding events. It is assumed that at a low alginate concentration, two R-modules bind to one alginate chain. At a higher alginate concentration, each R-module binds to one alginate chain. The ITC experimental data, NMR titration, and structural data clearly show a single binding location in the alginate binding groove. The ITC thermograph for poly-MG shows binding of alginate; however, the software was not able to fit the obtained data due to the low amounts of heat generated by this weak binding. To get better ITC results, the protein concentration should be 50–200-fold higher, which is not possible. The NMR data also show a weak binding for poly-MG and the obtained binding constant also indicates that ITC titrations are at its limit for poly-MG.
FIGURE 8.

Charged amino acids on the assumed alginate-binding surface. A, AlgE4R; B, AlgE6R1; C, AlgE6R2; and D, AlgE6R3. Each R-module has 5–7 basic amino acids (in blue) and 5–7 acidic amino acids (in red) within the assumed alginate binding region of the surface. AlgE4R has the more basic amino acid residues evenly distributed over the assumed alginate-binding surface than the R-modules of AlgE6.
In contrast to the results obtained for AlgE4R, none of the individual R-modules of AlgE6 showed detectable interaction to any alginate oligomer. Weak interaction was measured for the three AlgE6 R1R2R3 modules together with poly-M from M10 to M20, and an interaction with poly-MG was also detected. It is surprising that the affinity for R1R2R3 of AlgE6 is found to be much lower than AlgE4R as the amino acid sequence and also the amount and distribution of charged and polar amino acids are very similar in the assumed binding site (Figs. 1 and 3). Similar results were obtained with the protein ORF-9 (53), which consists entirely of seven R-modules and shows comparable affinity for alginate oligomers as R1R2R3. It should be noted that the R-modules in ORF-9 are more similar to the R-modules of AlgE6 than to AlgE4. The results presented here show that minor differences in the alginate binding groove have a huge impact on the affinity for alginate.
Alginate-binding Site
To explain the different alginate binding behavior of the four R-modules despite their structural similarity and sequence homology, a more detailed assessment of the charge distribution is required. In particular, the R-modules of AlgE6 are very similar to each other in the amino acid sequence but vary a bit in their charge distribution on the surface (Fig. 8). The putative alginate-binding site of AlgE4R contains eight basic amino acids. Of these eight amino acids, three are not conserved in all four R-modules (Arg-24, Lys-103, and Arg-124). Lys-103, one of the nonconserved basic amino acids in AlgE4R, is relatively far away from any other positively charged amino acid (∼9 Å from Arg-110 and Lys-114). However, Arg-124 and Arg-24 (the other two nonconversed basic amino acids) are close to other basic amino acids. Arg-24 is close to Arg-40 and Arg-42, whereas Arg-124 is surrounded by Arg-62 and Lys-114. Arg-24 introduces a positive surface potential on a spot, where AlgE6R2 and AlgE6R3 have a negative surface potential. Arg-124 forms a kind of bridge between Arg-62 and Lys-114, but the positive charge is shielded by negatively charged side chains of the surrounding amino acids (Glu-64, Asp-94, Glu-117, Asp-119, Glu-121, and Glu-126).
All R-modules of AlgE6 have one additional arginine located between two phenylalanines that open the β-roll (FRF(53–55) in AlgE6R1 and residues 63–65 in AlgE6R2 and AlgE6R3). These extra arginines are, however, on the opposite side of the proteins relative to where the binding site is located in AlgE4R. Besides this arginine, AlgE6R1 has one extra arginine (Arg-26) that is at the same position as Arg-24 in AlgE4R. Arg-26 is flanked by two aspartic acids (Asp-24 and Arg-28). The charge distribution is very similar to AlgE4R, although AlgE6R1 does not have such a strong negatively charged groove on the bottom because both nonconserved positions contain amidic instead of acidic amino acids. In the case of AlgE6R2, the charges are more equally distributed, and there are no areas on the electrostatic surface that have a strongly positive or strongly negative potential. Although AlgE6R2 and AlgE6R3 have very similar sequences, the electrostatic surfaces are very different. Most pronounced is the electropositive area on the front side of AlgE6R3. It consists of the four basic amino acids, Arg-51, Lys-53, Arg-82, and Arg-121. Arg-82 is the only residue that is not conserved in all four R-modules. In the other modules, there is a leucine at this position. The distance between Arg-82 and Arg-51 is about 4.5 Å, and Arg-82 and Lys-53 are about 8 Å away from each other. In particular, the distance between Arg-51 and Arg-82 is extremely close considering that both are positively charged. Additionally, Arg-121 is also relatively close to Arg-82 with 8 Å. In the other R-modules, Arg-121 is far distanced from any other basic amino acid.
Besides the basic residues, the acidic and polar amino acids also have to be considered. Many of the acidic and polar amino acids on the front side of the R-modules are also conserved (in AlgE4 they are Asp-74, Glu-107, Asp-119, Glu-126, and Ser-44, and Tyr-96, Asn-105, and Tyr-112). Both groups of amino acids can bind alginate through hydrogen bonds and probably stabilizing the proteins by avoiding electrostatic repulsion of the basic residues that might otherwise cause labile protein structures. A recent study shows that the presence of a negative charge at the substrate binding groove had a significant effect on the ability of an epimerase to move in a well defined manner (20). This points out that if the binding groove only had basic residues, the alginate polymer would not be able to dissociate from the enzyme surface and/or the epimerase could not move along the alginate polymer chain.
Roles of the R-module(s)
It has previously been shown that although the R-modules show no epimerization activity, they are able to enhance the activity of the A-module (10–16). Swapping the R-modules between AlgE4 and AlgE6 shows that they also have a strong influence on the epimerization pattern of the epimerase, which was also observed in a mutant epimerase (20). Improving the alginate binding ability of AlgE6A by introducing the AlgE4R module, creating the AlgE64 epimerase mutant, leads to increased G-block formation. However, it is also possible that there is an upper limit for improving the binding ability and thereby the G-block forming capability. If the interaction between enzyme and substrate becomes too strong, it will reduce the catalytic rate of the epimerase.
In the case of AlgE4, the R-module binds to the poly-M and poly-MG oligomers with different affinity. It can be assumed that the charged and polar amino acids contribute strongly in directing the binding and orientation of the alginate on the epimerase surface both before and after each epimerization reaction. The attraction and repulsion between charges can help to move the whole epimerase on the alginate polymer forward in a processive mode of action. The R-module is following after the A-module meaning that in the beginning the R-module may bind to poly-M alginate, but after some epimerization steps, the R-module comes into contact with the MG-blocks that are produced. The R-module does not bind that well to the alginate anymore and the whole AlgE4 detaches. This model fits well with experimental data obtained by Campa et al. (35), which observed that AlgE4 makes ∼10 epimerization steps for each association event with the alginate polymer.
Concluding Remarks
In this study, we have determined the three-dimensional solution structure of the three individual R-modules from AlgE6 with NMR spectroscopy. In general, they all contain β-sheets folded into an elongated roll with a positively charged groove along the long axis of the protein on one side. Calcium ions can be incorporated into the loops of the β-roll without an increase in the target function for the structure calculation. SAXS analyses of AlgE4 and AlgE6 show that both enzymes display an elongated shape with some flexibility between the individual modules. This was supported by analysis of line width based on the selected resonances in the15N-TROSY spectrum obtained of the A- and R-module for intact AlgE4. AlgE4R binds alginate, whereas the individual R-modules from AlgE6 are not able to interact with alginate. Swapping the R-modules between AlgE4 and AlgE6 resulted in a novel epimerase called AlgE64 displaying better G-block forming abilities than AlgE6. This property seems to be correlated with the better alginate binding ability of the AlgE4R module than for the AlgE6R modules. Furthermore, AlgE4R has a higher affinity for poly-M than poly-MG oligomers, which correlates well with the mode of action and degree of processivity of AlgE4. Altogether, the R-modules influence and modulate the epimerase interaction with alginates and the epimerization pattern.
Supplementary Material
Acknowledgments
The 800 MHz spectra were obtained using the Bruker Avance spectrometer of the Danish Instrument Center for NMR Spectroscopy of Biological Macromolecules. We grateful to Marianne Ø. Dalheim for allowing us to use some of the data on ORF-9. The NMR laboratory at Aalborg University is supported by the Obel and SparNord foundations.

This article contains supplemental Fig. S1.
The atomic coordinates and structure factors (codes 2ML1, 2ML2, and 2ML3) have been deposited in the Protein Data Bank (http://wwpdb.org/).
- M
- β-d-mannuronic acid
- G
- α-l-guluronic acid
- SAXS
- small angle x-ray scattering
- ITC
- isothermal titration calorimetry
- PDB
- Protein Data Bank
- IFT
- indirect Fourier transformation
- NSD
- normalized spatial discrepancy
- EOM
- ensemble optimization method.
REFERENCES
- 1. Fischer F. G., Dorfel H. (1955) Polyuronic acids in brown algae. Hoppe Seyler's Z. Physiol. Chem. 302, 186–203 [PubMed] [Google Scholar]
- 2. Hirst E. L., Jones J. K., Jones W. O. (1939) Polyuronic acids in brown algae. J. Chem. Soc. 1880, 1939 [Google Scholar]
- 3. Haug A., Myklestad S., Larsen B., Smidsrød O. (1967) Correlation between chemical structure and physical properties of alginates. Acta Chem. Scand. 21, 768–778 [Google Scholar]
- 4. Smidsrød O. (1973) The relative extension of alginates having different chemical composition. Carbohydr. Res. 27, 107–118 [Google Scholar]
- 5. Smidsrod O., Haug A. (1972) Dependence upon the gel-sol state of the ion-exchange properties of alginates. Acta Chem. Scand. 26, 2063–2074 [DOI] [PubMed] [Google Scholar]
- 6. Donati I., Holtan S., Mørch Y. A., Borgogna M., Dentini M., Skjåk-Braek G. (2005) New hypothesis on the role of alternating sequences in calcium-alginate gels. Biomacromolecules 6, 1031–1040 [DOI] [PubMed] [Google Scholar]
- 7. Aarstad O., Strand B. L., Klepp-Andersen L. M., Skjåk-Bræk G. (2013) Analysis of G-block distributions and their impact on gel properties of in vitro epimerized mannuronan. Biomacromolecules 14, 3409–3416 [DOI] [PubMed] [Google Scholar]
- 8. Pindar D. F., Bucke C. (1975) The biosynthesis of alginic acid by Azotobacter vinelandii. Biochem. J. 152, 617–622 [DOI] [PMC free article] [PubMed] [Google Scholar]
- 9. Ertesvåg H., Høidal H. K., Hals I. K., Rian A., Doseth B., Valla S. (1995) A family of modular type mannuronan C-5-epimerase genes controls alginate structure in Azotobacter vinelandii. Mol. Microbiol. 16, 719–731 [DOI] [PubMed] [Google Scholar]
- 10. Svanem B. I., Skjåk-Braek G., Ertesvåg H., Valla S. (1999) Cloning and expression of three new Azotobacter vinelandii genes closely related to a previously described gene family encoding mannuronan C-5-epimerases. J. Bacteriol. 181, 68–77 [DOI] [PMC free article] [PubMed] [Google Scholar]
- 11. Ertesvåg H., Skjåk-Bræk G. (1999) in Carbohydrate Biotechnology Protocols (Bucke C., ed) pp. 71–78, Humana Press Inc., Totowa, NJ [Google Scholar]
- 12. Svanem B. I., Strand W. I., Ertesvag H., Skjåk-Braek G., Hartmann M., Barbeyron T., Valla S. (2001) The catalytic activities of the bifunctional Azotobacter vinelandii mannuronan C-5-epimerase and alginate lyase AlgE7 probably originate from the same active site in the enzyme. J. Biol. Chem. 276, 31542–31550 [DOI] [PubMed] [Google Scholar]
- 13. Rozeboom H. J., Bjerkan T. M., Kalk K. H., Ertesvåg H., Holtan S., Aachmann F. L., Valla S., Dijkstra B. W. (2008) Structural and mutational characterization of the catalytic A-module of the mannuronan C-5-epimerase AlgE4 from Azotobacter vinelandii. J. Biol. Chem. 283, 23819–23828 [DOI] [PMC free article] [PubMed] [Google Scholar]
- 14. Aachmann F. L., Svanem B. I., Valla S., Petersen S. B., Wimmer R. (2005) NMR assignment of the R-module from Azotobacter vinelandii mannuronan C5-epimerase AlgE4. J. Biomol. NMR 31, 259–260 [DOI] [PubMed] [Google Scholar]
- 15. Aachmann F. L., Svanem B. I., Güntert P., Petersen S. B., Valla S., Wimmer R. (2006) NMR structure of the R-module: a parallel β-roll subunit from an Azotobacter vinelandii mannuronan C-5 epimerase. J. Biol. Chem. 281, 7350–7356 [DOI] [PubMed] [Google Scholar]
- 16. Ertesvåg H., Valla S. (1999) The A modules of the Azotobacter vinelandii mannuronan-C-5-epimerase AlgE1 are sufficient for both epimerization and binding of Ca2+. J. Bacteriol. 181, 3033–3038 [DOI] [PMC free article] [PubMed] [Google Scholar]
- 17. Høidal H. K., Ertesvåg H., Skjåk-Braek G., Stokke B. T., Valla S. (1999) The recombinant Azotobacter vinelandii mannuronan C-5-epimerase AlgE4 epimerizes alginate by a nonrandom attack mechanism. J. Biol. Chem. 274, 12316–12322 [DOI] [PubMed] [Google Scholar]
- 18. Hartmann M., Holm O. B., Johansen G. A., Skjåk-Braek G., Stokke B. T. (2002) Mode of action of recombinant Azotobacter vinelandii mannuronan C-5 epimerases AlgE2 and AlgE4. Biopolymers 63, 77–88 [DOI] [PubMed] [Google Scholar]
- 19. Campa C., Holtan S., Nilsen N., Bjerkan T. M., Stokke B. T., Skjåk-Braek G. (2004) Biochemical analysis of the processive mechanism for epimerization of alginate by mannuronan C-5 epimerase AlgE4. Biochem. J. 381, 155–164 [DOI] [PMC free article] [PubMed] [Google Scholar]
- 20. Tøndervik A., Klinkenberg G., Aachmann F. L., Svanem B. I., Ertesvåg H., Ellingsen T. E., Valla S., Skjåk-Bræk G., Sletta H. (2013) Mannuronan C-5 epimerases suited for tailoring of specific alginate structures obtained by high-throughput screening of an epimerase mutant library. Biomacromolecules 14, 2657–2666 [DOI] [PubMed] [Google Scholar]
- 21. Buchinger E., Aachmann F. L., Aranko A. S., Valla S., Skjåk-Braek G., Iwaï H., Wimmer R. (2010) Use of protein trans-splicing to produce active and segmentally 2H,15N-labeled mannuronan C5-epimerase AlgE4. Protein Sci. 19, 1534–1543 [DOI] [PMC free article] [PubMed] [Google Scholar]
- 22. Tøndervik A., Klinkenberg G., Aarstad O. A., Drabløs F., Ertesvåg H., Ellingsen T. E., Skjåk-Bræk G., Valla S., Sletta H. (2010) Isolation of mutant alginate lyases with cleavage specificity for di-guluronic acid linkages. J. Biol. Chem. 285, 35284–35292 [DOI] [PMC free article] [PubMed] [Google Scholar]
- 23. Aachmann F. L., Skjåk-Braek G. (2008) 1H, 15N, 13C resonance assignment of the AlgE6R1 subunit from the Azotobacter vinelandii mannuronan C5-epimerase. Biomol NMR Assign. 2, 123–125 [DOI] [PubMed] [Google Scholar]
- 24. Andreassen T., Buchinger E., Skjåk-Bræk G., Valla S., Aachmann F. L. (2011) 1H, 13C and 15N resonances of the AlgE6R2 subunit from Azotobacter vinelandii mannuronan C5-epimerase. Biomol. NMR Assign. 5, 147–149 [DOI] [PMC free article] [PubMed] [Google Scholar]
- 25. Buchinger E., Skjåk-Bræk G., Valla S., Wimmer R., Aachmann F. L. (2011) NMR assignments of 1H, 13C and 15N resonances of the C-terminal subunit from Azotobacter vinelandii mannuronan C5-epimerase 6 (AlgE6R3). Biomol. NMR Assign. 5, 27–29 [DOI] [PMC free article] [PubMed] [Google Scholar]
- 26. Keller R. L. (2004) Optimizing the Process of Nuclear Magnetic Resonance Spectrum Analysis and Computer-aided Resonance Assignment. Ph.D. thesis, ETH, Zurich [Google Scholar]
- 27. Güntert P., Mumenthaler C., Wüthrich K. (1997) Torsion angle dynamics for NMR structure calculation with the new program DYANA. J. Mol. Biol. 273, 283–298 [DOI] [PubMed] [Google Scholar]
- 28. Cornilescu G., Delaglio F., Bax A. (1999) Protein backbone angle restraints from searching a database for chemical shift and sequence homology. J. Biomol. NMR 13, 289–302 [DOI] [PubMed] [Google Scholar]
- 29. Krieger E., Koraimann G., Vriend G. (2002) Increasing the precision of comparative models with YASARA NOVA–a self-parameterizing force field. Proteins 47, 393–402 [DOI] [PubMed] [Google Scholar]
- 30. Larkin M. A., Blackshields G., Brown N. P., Chenna R., McGettigan P. A., McWilliam H., Valentin F., Wallace I. M., Wilm A., Lopez R., Thompson J. D., Gibson T. J., Higgins D. G. (2007) Clustal W and Clustal X version 2.0. Bioinformatics 23, 2947–2948 [DOI] [PubMed] [Google Scholar]
- 31. Schrödinger LLC. (2010) The PyMOL Molecular Graphics System, Version 1.3r1, Schrödinger, LLC, New York [Google Scholar]
- 32. Baker N. A., Sept D., Joseph S., Holst M. J., McCammon J. A. (2001) Electrostatics of nanosystems: application to microtubules and the ribosome. Proc. Natl. Acad. Sci. U.S.A. 98, 10037–10041 [DOI] [PMC free article] [PubMed] [Google Scholar]
- 33. Li H., Robertson A. D., Jensen J. H. (2005) Very fast empirical prediction and rationalization of protein pKa values. Proteins 61, 704–721 [DOI] [PubMed] [Google Scholar]
- 34. Gimmestad M., Sletta H., Ertesvåg H., Bakkevig K., Jain S., Suh S. J., Skjåk-Braek G., Ellingsen T. E., Ohman D. E., Valla S. (2003) The Pseudomonas fluorescens AlgG protein, but not its mannuronan C-5-epimerase activity, is needed for alginate polymer formation. J. Bacteriol. 185, 3515–3523 [DOI] [PMC free article] [PubMed] [Google Scholar]
- 35. Campa C., Oust A., Skjåk-Braek G., Paulsen B. S., Paoletti S., Christensen B. E., Ballance S. (2004) Determination of average degree of polymerisation and distribution of oligosaccharides in a partially acid-hydrolysed homopolysaccharide: a comparison of four experimental methods applied to mannuronan. J. Chromatogr. A 1026, 271–281 [DOI] [PubMed] [Google Scholar]
- 36. Ballance S., Holtan S., Aarstad O. A., Sikorski P., Skjåk-Braek G., Christensen B. E. (2005) Application of high-performance anion-exchange chromatography with pulsed amperometric detection and statistical analysis to study oligosaccharide distributions–a complementary method to investigate the structure and some properties of alginates. J. Chromatogr. A 1093, 59–68 [DOI] [PubMed] [Google Scholar]
- 37. Wilkins M. R., Gasteiger E., Bairoch A., Sanchez J. C., Williams K. L., Appel R. D., Hochstrasser D. F. (1999) Protein identification and analysis tools in the ExPASy server. Methods Mol. Biol. 112, 531–552 [DOI] [PubMed] [Google Scholar]
- 38. Pedersen J. (2004) A flux- and background-optimized version of the NanoSTAR small-angle x-ray scattering camera for solution scattering. J. Appl. Crystallogr. 37, 369–380 [Google Scholar]
- 39. Pedersen J. S., Hansen S., Bauer R. (1994) The aggregation behavior of zinc-free insulin studied by small-angle neutron scattering. Eur. Biophys. J. 22, 379–389 [DOI] [PubMed] [Google Scholar]
- 40. Arnold K., Bordoli L., Kopp J., Schwede T. (2006) The SWISS-MODEL workspace: a web-based environment for protein structure homology modelling. Bioinformatics 22, 195–201 [DOI] [PubMed] [Google Scholar]
- 41. Svergun D., Barberato C., Koch M. H. (1995) CRYSOL–a program to evaluate x-ray solution scattering of biological macromolecules from atomic coordinates. J. Appl. Crystallogr. 28, 768–773 [Google Scholar]
- 42. Bernadó P., Mylonas E., Petoukhov M. V., Blackledge M., Svergun D. I. (2007) Structural characterization of flexible proteins using small-angle x-ray scattering. J. Am. Chem. Soc. 129, 5656–5664 [DOI] [PubMed] [Google Scholar]
- 43. Petoukhov M. V., Svergun D. I. (2005) Global rigid body modeling of macromolecular complexes against small-angle scattering data. Biophys. J. 89, 1237–1250 [DOI] [PMC free article] [PubMed] [Google Scholar]
- 44. Kozin M. B., Svergun D. I. (2001) Automated matching of high- and low-resolution structural models. J. Appl. Crystallogr. 34, 33–41 [Google Scholar]
- 45. Gimmestad M., Steigedal M., Ertesvåg H., Moreno S., Christensen B. E., Espín G., Valla S. (2006) Identification and characterization of an Azotobacter vinelandii type I secretion system responsible for export of the AlgE-type mannuronan C-5-epimerases. J. Bacteriol. 188, 5551–5560 [DOI] [PMC free article] [PubMed] [Google Scholar]
- 46. Shen Y., Delaglio F., Cornilescu G., Bax A. (2009) TALOS+: a hybrid method for predicting protein backbone torsion angles from NMR chemical shifts. J. Biomol. NMR 44, 213–223 [DOI] [PMC free article] [PubMed] [Google Scholar]
- 47. Delepelaire P. (2004) Type I secretion in Gram-negative bacteria. Biochim. Biophys. Acta 1694, 149–161 [DOI] [PubMed] [Google Scholar]
- 48. Glatter O. (1977) A new method for the evaluation of small-angle scattering data. J. Appl. Crystallogr. 10, 415–421 [Google Scholar]
- 49. Debye P. (1947) Molecular-weight determination by light scattering. J. Phys. Colloid. Chem. 51, 18–32 [DOI] [PubMed] [Google Scholar]
- 50. Bryson K., McGuffin L. J., Marsden R. L., Ward J. J., Sodhi J. S., Jones D. T. (2005) Protein structure prediction servers at University College London. Nucleic Acids Res. 33, W36–W38 [DOI] [PMC free article] [PubMed] [Google Scholar]
- 51. Jones D. T. (1999) Protein secondary structure prediction based on position-specific scoring matrices. J. Mol. Biol. 292, 195–202 [DOI] [PubMed] [Google Scholar]
- 52. Sletmoen M., Skjåk-Braek G., Stokke B. T. (2005) Mapping enzymatic functionalities of mannuronan C-5 epimerases and their modular units by dynamic force spectroscopy. Carbohydr. Res. 340, 2782–2795 [DOI] [PubMed] [Google Scholar]
- 53. Dalheim M. Ø. (2010) Functional Study of Its Effect(s) on Alginate Epimerisation. M.Sc thesis, Norwegian University of Science and Technology, Trondheim [Google Scholar]
- 54. Baumann U., Wu S., Flaherty K. M., McKay D. B. (1993) Three-dimensional structure of the alkaline protease of Pseudomonas aeruginosa: a two-domain protein with a calcium binding parallel β-roll motif. EMBO J. 12, 3357–3364 [DOI] [PMC free article] [PubMed] [Google Scholar]
- 55. Baumann U. (1994) Crystal structure of the 50-kDa metalloprotease from Serratia marcescens. J. Mol. Biol. 242, 244–251 [DOI] [PubMed] [Google Scholar]
- 56. Amann E., Ochs B., Abel K. J. (1988) Tightly regulated Tac promoter vectors useful for the expression of unfused and fused proteins in Escherichia coli. Gene 69, 301–315 [DOI] [PubMed] [Google Scholar]
- 57. Bakke I., Berg L., Aune T. E., Brautaset T., Sletta H., Tøndervik A., Valla S. (2009) Random mutagenesis of the Pm promoter as a powerful strategy for improvement of recombinant-gene expression. Appl. Environ. Microbiol. 75, 2002–2011 [DOI] [PMC free article] [PubMed] [Google Scholar]
- 58. Aachmann F. L., Svanem B. I., Valla S., Petersen S. B., Wimmer R. (2005) NMR assignment of the R-module from Azotobacter vinelandii mannuronan C5-epimerase AlgE4. J. Biomol. NMR 31, 259. [DOI] [PubMed] [Google Scholar]
- 59. Hanahan D., Meselson M. (1983) Plasmid screening at high colony density. Methods Enzymol. 100, 333–342 [DOI] [PubMed] [Google Scholar]
- 60. Gasteiger E., Hoogland C., Gattiker A., Duvaud S., Wilkins M. R., Appel R. D., Bairoch A., Walker J. M. (2005) in The Proteomics Protocols Handbook (Walker J. M., ed) pp. 571–607, Humana Press Inc., Totowa, NJ [Google Scholar]
- 61. Koradi R., Billeter M., Wüthrich K. (1996) MOLMOL: a program for display and analysis of macromolecular structures. J. Mol. Graph. 14, 51–55 [DOI] [PubMed] [Google Scholar]
Associated Data
This section collects any data citations, data availability statements, or supplementary materials included in this article.