

Background: Inactivation of Krüppel-like factor 2 (KLF2) in myeloid cells induces activation of proinflammatory mediators.
Results: Macrophage KLF2 deficiency increases chemokine expression and modulates microRNA levels.
Conclusion: KLF2 suppresses expression of proinflammatory chemokines Ccl2 and Cxcl1 via modulation of miR-124a and miR-150 levels in myeloid cells.
Significance: The anti-inflammatory properties of KLF2 include modification of microRNA expression in macrophages.
Keywords: Chemokine, Inflammation, Kruppel-like Factor 2 (KLF2), Macrophage, MicroRNA (miRNA)
Abstract
Previous studies have shown that the myeloid-specific deficiency of the transcription factor Krüppel-like factor 2 (KLF2) accelerates atherosclerosis in hypercholesterolemic Ldlr−/− mice due to the enhanced adhesion of myeloid cells to activated endothelial cells in the vessel wall. This study revealed elevated basal inflammation with elevated plasma levels of Ccl2, Ccl4, Ccl5, and Ccl11 in the myeloid-specific KLF2 knock-out (myeKlf2−/−) mice. Peritoneal macrophages isolated from myeKlf2−/− mice showed increased mRNA levels of several inflammatory mediators, including Ccl2, Ccl5, Ccl7, Cox-2, Cxcl1, and IL-6. In contrast, the levels of two microRNAs, miR-124a and miR-150, were lower in Klf2−/− macrophages compared with Klf2+/+ macrophages. Additional studies showed a direct inverse relationship between miR-124a levels with Ccl2 expression, with anti-miR-124a increasing Ccl2 mRNA levels in Klf2+/+ macrophages, whereas the restoration of miR-124a levels in Klf2−/− macrophages significantly reduced Ccl2 mRNA expression. Likewise, the inverse relationship was observed between miR-150 levels and Cxcl1 expression in Klf2+/+ and Klf2−/− mice. Moreover, miR150 likely regulates the miR124a expression and thus augments expression of inflammatory mediators in myeKlf2−/− macrophages. This study documented that the transcription factor KLF2 modulates inflammatory chemokine production via regulation of microRNA expression levels in immune cells.
Introduction
Atherosclerosis is the leading cause of morbidity and mortality in the United States (1). The pathogenesis of early atherosclerosis involves the accumulation of lipoprotein aggregates in the subendothelial space (2), recruitment of monocytes, and activation of macrophages in the vessel wall, with subsequent foam cell formation and activation of the underlying smooth muscle cells (3). The recruitment of inflammatory cells to the atherosclerotic lesion areas is guided by chemoattractants and endothelial leukocyte adhesion molecules. The activated macrophages secrete inflammatory chemokines and cytokines that are instrumental mediators of atherosclerotic plaque formation and propagation of vascular inflammatory response (4–6). Importantly, preventing monocyte entry into the vessel wall by blocking chemokines and their receptors has been shown to prevent atherogenesis in mouse models of atherosclerosis (7). Therefore, further understanding of pathways that protect from the development of atherosclerosis may elucidate potential new therapies.
One of the most effective and frequently prescribed medication to reduce the risk of atherosclerosis is statins. Although the major effect of statins is the inhibition of HMG-CoA reductase, thereby reducing endogenous cholesterol biosynthesis to lower plasma LDL-cholesterol levels, statins have also been shown to have additional anti-inflammatory properties independent of lowering cholesterol (8). The anti-inflammatory properties of statins are at least in part mediated through activation of Krüppel-like factor 2 (KLF2),2 a member of the zinc finger family of transcription factors.
In recent years, it has become increasingly clear that KLF2 plays a central role in the regulation of immune cell activation (9–11). Multiple studies by our laboratory and others have demonstrated the importance of KLF2 in the differentiation and function in a variety of cell types, including T cells, monocytes, neutrophils, lung cells, endothelial cells, and adipocytes (11–13). Overexpression of KLF2 induces T cell quiescence (14) and represses proinflammatory activation in monocytes (11). Das et al. (11) have shown that KLF2 overexpression attenuates LPS-mediated induction of the proinflammatory mediators such as Ccl2/Mcp-1, TNF-α, IL-1β, and Cox-2. More recently, we have shown that myeloid-specific inactivation of KLF2 increases atherosclerosis in hypercholesterolemic mice (15). The increased atherosclerosis corresponded to elevated adhesion of the KLF2-deficient macrophages to endothelial cells and their infiltration into atherosclerotic lesion areas. However, the molecular mechanism by which the KLF2 modulates the proinflammatory activation and progression of atherosclerosis remains unclear.
MicroRNAs (miRNAs), a family of small noncoding RNAs (∼22 nucleotides), have recently emerged as powerful post-transcriptional regulators of various biological processes that determine cell fate and signaling events (16, 17). In endothelial cells lining the vessel wall, KLF2 mediates the expression of multiple miRNAs, including miR-143, miR-145, and miR-146a, to promote endothelial and smooth muscle cell communication in protection against atherosclerosis (18). MicroRNAs also play an important role in macrophage biology by regulating their differentiation from precursor cells and modulating the expression of proinflammatory mediators and integrins (19). For example, miR-92a, miR-124a, miR-146a, miR-150, and miR-223 have been shown to be negative regulators of inflammation and myeloid cell proliferation (20–25). However, whether KLF2 also mediates miRNA expression in macrophages and their role in preventing proinflammatory activation remain elusive to date. Here, we identified miRNAs that are regulated by KLF2, and we show that miR-124a and miR-150, in particular, are responsible for mediating KLF2 suppression of Ccl2 and Cxcl1 expression in macrophages.
EXPERIMENTAL PROCEDURES
Animals
The Klf2fl/fl mice were generated and backcrossed to C57BL/6 background as outlined (15). The Klf2fl/fl mice were mated with Ldlr−/− mice (The Jackson Laboratory) and then crossed with transgenic mice expressing Cre recombinase under the control of the LysM promoter (LysM-cre, The Jackson Laboratory) to generate Ldlr−/− mice with or without KLF2 expression in myeloid cells (myeKlf2+/+ and myeKlf2−/− mice, respectively). The Klf2fl/fl mice without the Cre recombinase transgene were used as controls throughout the study. All mice were housed in pathogen-free conditions at the University of Cincinnati in accordance with National Institutes of Health guidelines. All the procedures and animal care were reviewed and approved by the University of Cincinnati Institutional Animal Care and Use Committee.
Chemokine Assay
Plasma was obtained from 2- to 3-month-old female myeKlf2+/+ and myeKlf2−/− mice. Chemokine levels in plasma were analyzed by quantification with the multiplex MCYTOMAG-70K assay (EMD Millipore), according to the manufacturer's instructions.
Peritoneal Macrophage Isolation and Treatment
Thioglycollate-recruited macrophages were isolated by peritoneal lavage 3 days after intraperitoneal injection of 1.5 ml of 3% sterile thioglycollate medium. Briefly, 30 g of dehydrated Brewer thioglycollate medium powder (Sigma) was dissolved in 1000 ml of deionized water and autoclaved. The medium was kept in the dark under sterile conditions at room temperature for at least 3 months before injection into mice. Macrophages from the peritoneal lavage were captured by CD11b microbeads (Miltenyi Biotec) and were treated with 1 μg/ml lipopolysaccharide (LPS) and 20 ng/ml interferon γ (IFNγ) for 24 h prior to analysis.
RNA Isolation and Real Time Quantitative PCR (RT-qPCR)
Total RNA, including miRNAs, was isolated from peritoneal macrophages using the mirVana miRNA isolation kit (Ambion). Expression of mRNA was quantified using gene-specific primers as indicated in Table 1. MicroRNA expression was measured and quantified using the TaqMan microRNA assay (Applied Biosystems) according to the manufacturer's protocol and normalized by U6 snRNA levels. RT-qPCR was performed on an ABI7300 real time PCR system (Applied Biosystems) using TaqMan universal master mix for miRNAs and SYBR Green mix. Relative gene expression was calculated using the ΔΔCt method following the manufacturer's instructions. All reactions were carried out in triplicate.
TABLE 1.
Primer sequences used for quantitative real time PCR analysis of experimental and reference genes
| Gene name | Primer sequence |
|---|---|
| Gapdh | Sense 5′-AGGTCGGTGTGAACGGATTTG-3′ |
| Antisense 5′-TGTAGACCATGTAGTTGAGGTCA-3′ | |
| IL-6 | Sense 5′-TAGTCCTTCCTACCCCAATTTCC-3′ |
| Antisense 5′-TTGGTCCTTAGCCACTCCTTC-3′ | |
| Ccl7 | Sense 5′-GCTGCTTTCAGCATCCAAGTG-3′ |
| Antisense 5′-CCAGGGACACCGACTACTG-3′ | |
| Ccl2 | Sense 5′-TTAAAAACCTGGATCGGAACCAA-3′ |
| Antisense 5′-GCATTAGCTTCAGATTTACGGGT-3′ | |
| Cxcl1 | Sense 5′-CTGGGATTCACCTCAAGAACATC-3′ |
| Antisense 5′-CAGGGTCAAGGCAAGCCTC-3′ | |
| Ccl4 | Sense 5′-TTCCTGCTGTTTCTCTTACACCT-3′ |
| Antisense 5′-CTGTCTGCCTCTTTTGGTCAG-3′ | |
| Ccl5 | Sense 5′-GCTGCTTTGCCTACCTCTCC-3′ |
| Antisense 5′-TCGAGTGACAAACACGACTGC-3′ | |
| Ccl11 | Sense 5′-GAATCACCAACAACAGATGCAC-3′ |
| Antisense 5′ -ATCCTGGACCCACTTCTTCTT-3′ | |
| Cox-2 | Sense 5′-TGAGCAACTATTCCAAACCAGC-3′ |
| Antisense 5′-GCACGTAGTCTTCGATCACTATC-3′ |
Transfection of miRNA Mimics and miRNA Inhibitors in Mouse Macrophages
The miRNA mimics and miRNA inhibitors for miR-124a and miR-150 were obtained from Ambion. Peritoneal macrophages adjusted to 2 × 10⁶ cells/well were transfected with 30 pmol of miRNA mimic or 50 pmol of miRNA inhibitor with Lipofectamine RNAiMAX reagent as instructed by the manufacturer. The transfected cells were incubated at 37 °C in 5% CO2 for 48 h followed by LPS and IFNγ treatment for 24 h. RNA isolated from the transfected cells was tested for appropriate chemokine expression.
ELISA
The culture supernatants from the miRNA mimics and miRNA inhibitor- transfected cells were harvested, centrifuged to remove cellular debris, and stored at −80 °C until assayed by ELISA. Each experimental condition was carried out in triplicate. Chemokine levels in plasma were analyzed by quantification with the Milliplex MCYTOMAG-70K assay (EMD Millipore) according to the manufacturer's instructions.
Chromatin Immunoprecipitation
Chromatin immunoprecipitation (ChIP) for peritoneal macrophages was performed using the agarose ChIP kit (Pierce) with anti-KLF2 (Millipore) antibody. Immunoprecipitated chromatin was purified and analyzed using RT-qPCR. The following primer pairs were used to detect the KLF2-binding sites in the mouse miR-150 promoter region: −550/−388 (5′-AGAGGGCCTGAGTGCAGTT-3′ and 5′-GGTGCTGTAGAGGCCACAAG-3′); −3058/−2835 (5′-AGGCTCCTCGGAGTACAGGT-3′ and 5′-TGGGATGCAGGACTAAGGTC-3′); and −4000/−3800 (5′-GCTCCTCCATCTCCTCACAG-3′ and 5′-CTGTCCTGCCTAGGAGCAAT-3′). RT-qPCR was performed on an ABI7300 real time PCR system (Applied Biosystems) using SYBR Green master mix. Fold enrichment was calculated as the ΔΔCt method and expressed relative to the IgG control.
Statistical Analysis
Statistical analysis was performed with GraphPad InStat program, and values were expressed as mean ± S.D. Multiple comparisons were tested by analysis of variance, with Student Newman-Keuls post hoc analysis. A difference of p ≤ 0.05 was considered statistically significant.
RESULTS
KLF2 Deficiency in Macrophages Increases Plasma Chemokine Levels
We have previously reported that myeloid-specific KLF2 inactivation results in increased adhesion of myeloid cells to endothelial cells and thus promotes atherosclerosis in hypercholesterolemic Ldlr−/− mice fed a high fat diet (15). Because activated monocytes-macrophages may also secrete inflammatory chemokines that cause additional endothelial damage, we measured plasma chemokine levels in myeKlf2−/− mice using multiplex MCYTOMAG-70K assay. The data obtained from this assay showed that levels of the chemokines Ccl2/monocyte chemotactic protein-1, Ccl4/macrophage inflammatory protein-1β, Ccl5/RANTES, and Ccl11/eotaxin were significantly increased in the plasma of myeKlf2−/− mice compared with the myeKlf2+/+ mice (Fig. 1). These data showed an elevated level of basal inflammation in myeloid cells with specific loss of KLF2 expression.
FIGURE 1.

Plasma chemokine levels in myeKlf2+/+ and myeKlf2−/− mice. Levels of each chemokine (indicated on the x axis) in 2–3-month-old female myeKlf2+/+ (filled bars) and myeKlf2−/− (open bars) mice were measured by multiplex assay. The data represent mean ± S.E. from five mice per group. * indicates a statistically significant difference at p < 0.001.
Expression of Proinflammatory Mediators in KLF2-deficient Macrophages
The elevated chemokine levels in plasma of mice with myeloid-specific KLF2 deficiency suggested that KLF2 may directly modulate chemokine expression in myeloid cells. Alternatively, KLF2 expression in myeloid cells may modulate inflammatory chemokine expression in other immune cells indirectly. To test these possibilities, peritoneal macrophages isolated from myeKlf2+/+ and myeKlf2−/− mice were incubated for 24 h with or without LPS + IFNγ to induce differentiation into the more inflammatory M1 phenotype. Real time quantitative-PCR analysis of RNA samples isolated from these macrophages revealed no major differences in chemokine expression, except for Ccl5, under basal unstimulated conditions (Fig. 2A). However, Ccl2, Ccl7/monocyte chemoattractant protein-3, Cxcl1, IL-6, and Cox-2 were significantly increased in peritoneal macrophages isolated from myeKlf2−/− mice compared with those isolated from myeKlf2+/+ mice after stimulation with LPS and IFNγ (Fig. 2B). However, the expression levels of Ccl4 and Ccl11 were found to be similar between myeKlf2+/+ and myeKlf2−/− macrophages (Fig. 2). These studies demonstrated that KLF2 modulates expression of a selective subset of proinflammatory mediators in macrophages and that the proinflammatory response in myeKlf2−/− mice is due to both direct and indirect effects of KLF2 in myeloid cells.
FIGURE 2.

Chemokine and cytokine mRNA levels in control (A) and LPS-treated (B) peritoneal macrophages. Peritoneal macrophages were isolated from myeKlf2+/+ (solid bars) and myeKlf2−/− (open bars) mice, and mRNA levels for each cytokine and chemokine indicated on the x axis were quantified by RT-qPCR after normalization to the expression levels of Gapdh. Expression levels observed with myeKlf2+/+ macrophages were set at 1.0 in each case. The data represent the mean ± S.E. of triplicate experiments. * and ** denote statistically significant differences at p < 0.001 and p < 0.01, respectively.
Role of MicroRNA in Expression of Proinflammatory Mediators in KLF2-deficient Macrophages
The next study examined whether KLF2 also regulates miRNA expression in peritoneal macrophages. Specifically, we performed RT-qPCR to compare the expression levels of miR-150, miR-124a, miR-223, miR-146a, and miR-92a in myeKlf2+/+ and myeKlf2−/− macrophages after activation with LPS and IFNγ. These miRNAs were selected for this study based on their previously demonstrated roles in controlling immune response and macrophage activation (26). The data revealed no significant differences in expression levels of miR-223, miR-146a, and miR-92a between Klf2+/+ and Klf2−/− macrophages. However, expression levels of miR-124a and miR-150 were significantly lower in Klf2−/− macrophages (Fig. 3).
FIGURE 3.

MicroRNA levels in peritoneal macrophages. Peritoneal macrophages isolated from myeKlf2+/+ (solid bars) and myeKlf2−/− (open bars) mice were activated by LPS and IFNγ incubation. Selected miRNA levels were quantified by RT-qPCR after normalization to the levels of U6 snRNA. Expression levels observed with myeKlf2+/+ macrophages were set at 1.0 in each case. The data represent mean ± S.E. of triplicate experiments. * denotes statistical significant difference at p < 0.001.
We next transfected the peritoneal macrophages with microRNA mimics and anti-miR to further understand the relationship between the decreased miR-124a and miR-150 levels and elevated expression of the subsets of inflammatory genes in KLF2-deficient macrophages. Transfection with miRNA mimics dramatically increased the miR-124a and miR-150 levels in myeKlf2−/− macrophages. In contrast, the anti-miR significantly reduced the expression of these miRNAs in myeKlf2+/+ macrophages (Fig. 4, A and B). These data indicate that both miRNA mimic and anti-miRNA are efficiently transfected in peritoneal macrophages.
FIGURE 4.

MicroRNA mimic transfection in peritoneal macrophages. Negative control (NC) miRNA mimics (closed box), miR-124a mimic (open box), and miR-150 mimic (slashed box) were transfected into peritoneal macrophages obtained from myeKlf2−/− mice. miRNA levels were quantified by RT-qPCR 72 h post-transfection. MicroRNA expression was normalized to U6 snRNA, and expression levels observed with the negative control miRNA mimic were set at 1.0 in each case. The data represent mean ± S.E. of triplicate experiments. * denotes statistical significant difference at p < 0.005.
The targets for miR-124a and miR-150 have been described and validated for their participation in inflammatory response regulation (25, 27, 28). Therefore, we performed computational target prediction analysis (miRBase database) to gain additional insights into the relationship between decreased miR-124a and miR-150 levels and elevated expression of the subset of inflammatory genes in KLF2-deficient macrophages. The alignment of miR-124a and miR-150 sequences with the KLF2-regulated inflammatory mediators identified in Fig. 2 revealed Ccl2 may be a target of miR-124a, which is consistent with reports showing miR-124a directly binds to the 3′UTR of Ccl2 mRNA (29). Additionally, the alignment reveals that Cxcl1 and Cox-2 may be targets of miR-150 (Fig. 5).
FIGURE 5.

Alignment of miR-124a and miR-150 sequences with sequences of Ccl2, Cxcl1, and Cox-2 mRNAs. Computational target analysis was performed using the miRBase database to predict the alignment of miR-124a with Ccl2 mRNA sequence (A), and the alignment of miR-150 with mRNA sequences of Cxcl1 (B), and Cox-2 (C).
To demonstrate the functional relationship between the miR-124a and miR-150 and their targets, the miRNA mimic-transfected Klf2+/+ and myeKlf2−/− peritoneal macrophages were treated with LPS and IFNγ 24 h prior to measurement of chemokine mRNA levels. Although the miRNA mimics have minimal effects on chemokine expression by Klf2+/+ macrophages, the miR-124a mimic-transfected myeKlf2−− cells showed decreased expression of Ccl2 compared with negative miR mimic and miR-150 mimic (Fig. 6A). These data indicate that reduced expression of miR-124a is directly responsible for elevated Ccl2 expression levels in Klf2−/− macrophages. Interestingly, the Cxcl1 expression was decreased by Klf2−/− cells transfected with either miR-124a mimic or miR-150 mimic (Fig. 6B). In contrast, Ccl5, Ccl7, IL-6, and Cox-2 expression levels remained unaltered in cells transfected with mimics of miR-124a and miR-150 (Fig. 6, C–F). Collectively, our data indicate that among the proinflammatory mediators tested, Ccl2 is exclusively controlled by miR-124a, and Ccl2 is regulated by both miR-124a and miR-150, whereas the elevated expression levels of Cox-2, Ccl5, IL-6, and Ccl7 in Klf2−/− macrophages are unrelated to reduced levels of miR-124a or miR-150.
FIGURE 6.

Effects of miR-124a and miR-150 mimics on chemokine expression levels in Klf2−/− and Klf2+/+ macrophages. Negative control miRNA mimics, miR-124a mimic, and miR-150 mimic were transfected into peritoneal macrophages obtained from myeKlf2−/− and myeKlf2+/+ mice. The transfected cells were then treated with LPS and IFNγ for 24 h prior to measurement of mRNA levels for Ccl2 (A), Cxcl1 (B), Ccl5 (C), Ccl7 (D), IL-6 (E), and Cox-2 (F). Chemokine mRNA expression of both Klf2−/− and Klf2+/+ macrophages was normalized to Gapdh mRNA levels. The expression levels observed with the negative control miRNA mimic in Klf2−/− macrophages were set at 1.0 in each case. The data represent mean ± S.E. of triplicate experiments. * denotes statistical significant difference at p < 0.001 and ** denotes p < 0.005.
To evaluate whether miRNA mimic-mediated changes in mRNA levels of chemokines led to corresponding changes in protein secretion, we next tested the chemokine secretion in miRNA mimic-transfected Klf2−/− macrophages. Our data revealed that transfection of the miR-124a and miR-150 mimics significantly decreased the secretion of Ccl2 (Fig. 7A), although the chemokine Cxcl1 secretion was inhibited by the miR-150 mimic only (Fig. 7B). These data substantiate that reduced levels of miR-124a and miR-150 are responsible for increased expression of Ccl2 and Cxcl1 in Klf2−/− macrophages
FIGURE 7.

Measurement of chemokine protein secretion levels in culture medium of Klf2−/− macrophages transfected with miR-124 mimic or miR-150 mimic. Negative control miRNA mimics, miR-124a mimic, and miR-150 mimic were transfected into peritoneal macrophages obtained from myeKlf2−/− mice. The transfected cells were then treated with LPS and IFNγ for 24 h prior to measurement of Ccl2 (A) and Cxcl1 (B) secretion. The data represent mean ± S.E. of triplicate experiments. * denotes statistical significant difference at p < 0.001.
To further evaluate a possible direct role of miR-124a and miR-150 in regulating Ccl2 and Cxcl1 expression, we transfected anti-miR-124a (inhibitor) and anti-miR-150 into Klf2+/+ and Klf2−/− peritoneal macrophages and treated the transfected cells with LPS after 48 h. The anti-miR-124a-transfected cells showed an increase in Ccl2 expression compared with negative miR-transfected cells (Fig. 8A). Interestingly, the anti-miR-124a had no influence on Cxcl1 expression in Klf2+/+ macrophages (Fig. 8B). These data demonstrated that although suppressing miR-124a activity is sufficient to increase Ccl2 expression in peritoneal macrophages, the increased expression of Cxcl1 observed in Klf2−/− macrophages requires additional factor(s), possibly miR-150, in addition to the reduced level of miR-124a in this cell type. Indeed, the anti-miR-150-transfected cells showed an increase in both Ccl2 and Cxcl1 expression in Klf2+/+ macrophages compared with negative miR-transfected cells (Fig. 8, A and B). These results demonstrated that Cxcl1 expression is particularly controlled by miR-150 and not miR-124a. However, Ccl2 expression is regulated by both the microRNAs.
FIGURE 8.

Effects of anti-miR-124a and anti-miR-150 on Ccl2 (A) and Cxcl1 (B) mRNA levels in Klf2+/+ and Klf2−/− macrophages. The anti-miRNA control (closed box), anti-miR-124a (open box), and anti-miR-150 (slashed box) were transfected into peritoneal macrophages obtained from Klf2+/+ and Klf2−/− mice. The transfected cells were then treated with LPS and IFNγ for 24 h prior to measurement of mRNA levels for Ccl2 and Cxcl1. Chemokine mRNA expression of both Klf2+/+ and Klf2−/− macrophages was normalized to Gapdh mRNA levels. The expression levels observed with the control anti-miR in Klf2+/+ macrophages were set at 1.0 in each case. The data represent mean ± S.E. of triplicate experiments. * denotes statistical significant difference at p < 0.005 and ** denotes p < 0.05.
Chemokine secretion analysis in anti-miRNA-transfected Klf2+/+ macrophages revealed that transfection of anti-miR124a and anti-miR-150 in Klf2+/+ macrophages significantly increased the secretion of Ccl2 and Cxcl1 (Fig. 9). The apparent discrepancy in the ability of miR-124a mimic to reduce Cxcl1 expression in Klf2−/− macrophages (Fig. 6B), but the anti-miR-124a failed to recapitulate the Klf2−/− phenotype of elevated Cxcl1 levels in Klf2+/+ macrophage (Fig. 8B), suggested that the miR-124a effects on Cxcl1 may be dependent on miR-150 expression levels. This possibility was confirmed by observations that the miR-150 mimic significantly reduced the expression of miR-124a in wild type mouse peritoneal macrophages (Fig. 10A). In contrast, the antimiR-124a did not alter the expression of miR-150 (Fig. 10B). Thus, these data indicate that the reduced expression of miR-124a in KLF2-deficient macrophages may be indirect through the reduction of miR-150.
FIGURE 9.

Measurement of chemokine protein secretion levels in culture medium of Klf2+/+ macrophages transfected with anti-miR-124a or anti-miR-150. The anti-miRNA control, anti-miR-124a, and anti-miR-150 were transfected into peritoneal macrophages obtained from myeKlf2+/+ mice. The transfected cells were then treated with LPS and IFNγ for 24 h prior to measurement of Ccl2 (A) and Cxcl1 (B) secretion. The data represent mean ± S.E. of triplicate experiments. * denotes statistical significant difference at p < 0.001 and ** denotes p < 0.05.
FIGURE 10.
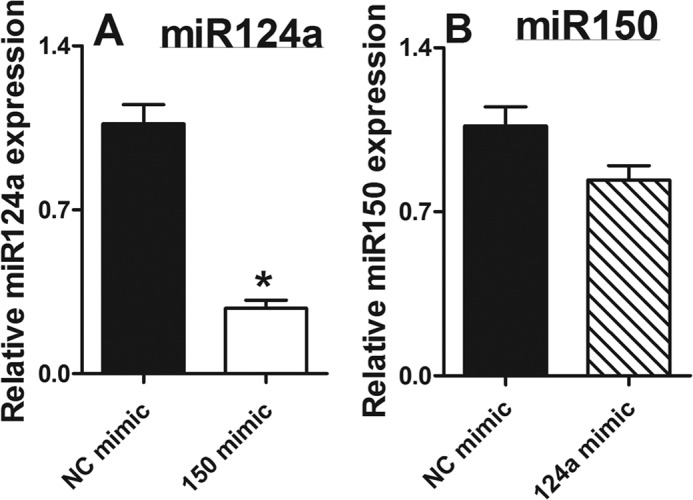
Effects of mimics on microRNA expression in Klf2−/− mice. Negative control miRNA mimics, miR-124a mimic, and miR-150 mimic were transfected into peritoneal macrophages obtained from myeKlf2−/− mice. The expression of miR-124a and miR150 was measured and normalized to the levels of U6 snRNA. The data represent mean ± S.E. of triplicate experiments. * denotes statistical significant difference at p < 0.005.
Determination of KLF2-binding Sites in miR-150 Promoter by ChIP Assay
To investigate the possibility that KLF2 may directly induce miR-150 transcription, we analyzed the promoter of miR-150 in silico using MatInspector (30), and we found several putative KLF-binding sites in evolutionarily conserved regions ∼5 kbp upstream of the transcriptional start site (Fig. 11A). ChIP assay confirmed KLF2 binding to the miR-150 promoter region (−550 to −388 bp upstream of transcriptional start site) that contained the consensus KLF2-binding site, “CACCC” (Fig. 11B). Moreover, this KLF2-binding site is ∼500 bp upstream to the transcriptional start site and is located in the evolutionarily conserved region of the miR-150 promoter. Thus, these ChIP data are consistent with the hypothesis that KLF2 may directly regulate miR-150 expression in myeloid cells. However, these data cannot exclude the possibility that KLF2 may also regulate the expression of other factors involved in miR-150 expression.
FIGURE 11.

Identifying KLF2-binding sites in miR-150 promoter region. A, illustration of the genomic region upstream of miR-150 and its evolutionary conservation across the species compared with human. B, ChIP assays were performed on peritoneal macrophages derived from Klf2+/+ mice. Millipore KLF2 antibody and nonspecific IgG control antibody were used. The mean IgG enrichment was set as 1.0 when compared with enrichment of KLF2. * denotes significant enrichment compared with IgG (p < 0.05).
DISCUSSION
Previous studies have shown that myeloid cell-specific KLF2 inactivation accelerates atherosclerosis in hyperlipidemic Ldlr knock-out mice due to increased adhesion of the KLF2-deficient myeloid cells to activated endothelial cells (15). In this study, we observed elevated inflammation with increased levels of proinflammatory chemokines such as Ccl2, Ccl4, Ccl11, and Ccl5 in the plasma of myeKlf2 knock-out mice compared with that observed in control mice. Analysis of mRNA in peritoneal macrophages of myeKlf2+/+ and myeKlf2−/− mice revealed a direct effect of KLF2 in limiting Ccl2 and Ccl5 expression in response to LPS and IFNγ activation. Additionally, expression levels of Ccl7, Cxcl1, Cox2, and IL-6 mRNA were also found to be elevated in Klf2−/− macrophages compared with Klf2+/+ macrophages. However, Ccl4 and Ccl11 mRNA levels were similar between Klf2+/+ and Klf2−/− macrophages, indicating that KLF2 does not participate in transcription of these genes. Accordingly, the elevated levels of Ccl4 and Ccl11 in the plasma of Klf2−/− mice were not a direct effect of KLF2 inactivation in myeloid cells but likely an indirect effect indicative of overall elevated basal inflammation due to myeloid KLF2 deficiency.
The KLF2 transcription factor has been shown previously to also modulate miRNA expression in several cell types. For example, KLF2 binds to the promoter of the miR-143/145 gene cluster to up-regulate the expression of these vascular protective genes in endothelial cells (18). Additionally, KLF2 also mediates the expression of miR-126 in endothelial and glioma cells (31, 32). In this study, we observed reduced expression of miR-124a and miR-150 in macrophages of myeKlf2−/− mice, thus indicating that KLF2 directly mediates the expression of these two miRNAs in macrophages. Interestingly, Ccl2 was found to be a specific target of miR-124a, and restoration of miR-124a levels in Klf2−/− macrophages significantly reduced Ccl2 mRNA expression. Conversely, the suppression of miR-124a activity in Klf2+/+ macrophages with anti-miR-124a recapitulated the elevated Ccl2 mRNA expression levels observed in Klf2−/− macrophages. These results indicate that the difference in plasma Ccl2 levels between myeKlf2+/+ and myeKlf2−/− mice is due to KLF2-mediated expression of miR-124a and the consequential suppression of Ccl2 expression in Klf2+/+ macrophages.
This study also revealed the efficiency of miR-150 in Klf2−/− macrophages. However, increasing miR-150 levels with miR-150 mimic did not reduce Ccl2 levels in Klf2−/− macrophages (Fig. 6A). Nevertheless, the suppression of miR-150 activity with anti-miR-150 in Klf2+/+ macrophages resulted in increased Ccl2 mRNA expression (Fig. 7B). We interpret these results to indicate that miR-150 modulation of Ccl2 expression is indirect and is likely mediated by miR-150 modulation of miR-124a as shown in Fig. 8A. The relationship between KLF2 and miR-150 in Ccl2 regulation is consistent with reports of correlation between decreased levels of KLF2 with reduced miR-150 and elevated Ccl2 levels in the lungs of hypertensive rats (33).
Our data showed that increasing miR-150 or miR-124a levels with their respective mimics also reduced Cxcl1 expression levels in Klf2−/− macrophages (Fig. 6B). Because miR-124a expression is regulated by miR-150, these results suggest that the reduced Cxcl1 expression observed in Klf2−/− macrophages is mediated via reduced miR-150 and the consequential reduction of miR-124a. However, anti-miR-124a alone failed to increase Cxcl1 mRNA levels in control Klf2+/+ macrophages. These results suggest that reduction of both miR-124a and miR-150 may be necessary for the increased Cxcl1 mRNA levels in Klf2−/− macrophages. In view of our data showing that miR-124a could be regulated by miR-150, and the ChIP data identifying KLF2-binding sites in the promoter region of the miR-150 gene, our results indicate that KLF2 orchestrates an anti-inflammatory role in myeloid cells through miR-150. It is important to note that reduced miR-150 expression has been shown recently to result in enhanced monocyte mobilization from the bone marrow (28). Therefore, the reduced miR-150 expression levels in Klf2−/− myeloid cells may be responsible for the increased monocyte-to-lymphocyte ratio observed in the blood of myeKlf2−/− mice (15). Moreover, the miR-124a- and miR-150-responsive chemokine Cxcl1, previously called the melanoma growth stimulatory activity-α, has neutrophil chemoattractant activity (34). Thus, reduced miR-150 expression in Klf2−/− macrophages may account for the increased neutrophil accumulation in atherosclerotic areas of hypercholesterolemic myeKlf2−/− mice compared with that observed in hypercholesterolemic myeKlf2+/+ mice. These possibilities are beyond the scope of this study and will be explored in future investigations.
Finally, this study adds further evidence for the diversity by which KLF2 regulates biological processes (35). In the immune system, KLF2 limits chronic and acute inflammation by suppressing the induction of proinflammatory cytokine and chemokines (36, 37). The expression of KLF2 in myeloid cells is also important to limit integrin expression and prevent their adhesion to activated endothelial cells on the vessel wall (15). As illustrated by Jain and co-workers (11, 37), one mechanism underlying the anti-inflammatory properties of KLF2 is mediated through inhibition of NF-κB activity. This study revealed that KLF2 may also suppress proinflammatory chemokine expression via modulation of miRNA levels in myeloid cells. The ability of KLF2 to modulate cellular levels of miRNA in immune cells is reminiscent of its role in endothelial cells, where KLF2 mediates miR-143 and miR-145 expression levels (18, 38). Thus, the ability of KLF2 to regulate various biological processes may be related to its ability to directly regulate gene transcription activity as well as indirectly through modulation of cellular miRNA. Because KLF2 and cellular miRNAs are major regulators of biological processes and their functions are highly dependent on the cell type involved (17, 35, 39), additional studies aimed at identifying the relationship between KLF2 expression and miRNA levels in various cell types are clearly warranted.
This work was supported, in whole or in part, by National Institutes of Health Grants HL78806 (to J. B L.) and DK74932 (to D. Y. H.).
- KLF
- Krüppel-like factor
- qPCR
- quantitative PCR.
REFERENCES
- 1. Roger V. L., Go A. S., Lloyd-Jones D. M., Benjamin E. J., Berry J. D., Borden W. B., Bravata D. M., Dai S., Ford E. S., Fox C. S., Fullerton H. J., Gillespie C., Hailpern S. M., Heit J. A., Howard V. J., Kissela B. M., Kittner S. J., Lackland D. T., Lichtman J. H., Lisabeth L. D., Makuc D. M., Marcus G. M., Marelli A., Matchar D. B., Moy C. S., Mozaffarian D., Mussolino M. E., Nichol G., Paynter N. P., Soliman E. Z., Sorlie P. D., Sotoodehnia N., Turan T. N., Virani S. S., Wong N. D., Woo D., Turner M. B. (2012) Heart disease and stroke statistics–2012 update: a report from the American Heart Association. Circulation 125, e2–e220 [DOI] [PMC free article] [PubMed] [Google Scholar]
- 2. Tamminen M., Mottino G., Qiao J. H., Breslow J. L., Frank J. S. (1999) Ultrastructure of early lipid accumulation in ApoE-deficient mice. Arterioscler. Thromb. Vasc. Biol. 19, 847–853 [DOI] [PubMed] [Google Scholar]
- 3. Nakashima Y., Plump A. S., Raines E. W., Breslow J. L., Ross R. (1994) ApoE-deficient mice develop lesions of all phases of atherosclerosis throughout the arterial tree. Arterioscler. Thromb. 14, 133–140 [DOI] [PubMed] [Google Scholar]
- 4. Ross R. (1999) Atherosclerosis–an inflammatory disease. N. Engl. J. Med. 340, 115–126 [DOI] [PubMed] [Google Scholar]
- 5. Zernecke A., Shagdarsuren E., Weber C. (2008) Chemokines in atherosclerosis: an update. Arterioscler. Thromb. Vasc. Biol. 28, 1897–1908 [DOI] [PubMed] [Google Scholar]
- 6. Moore K. J., Tabas I. (2011) Macrophages in the pathogenesis of atherosclerosis. Cell 145, 341–355 [DOI] [PMC free article] [PubMed] [Google Scholar]
- 7. Mestas J., Ley K. (2008) Monocyte-endothelial cell interactions in the development of atherosclerosis. Trends Cardiovasc. Med. 18, 228–232 [DOI] [PMC free article] [PubMed] [Google Scholar]
- 8. Jain M. K., Ridker P. M. (2005) Anti-inflammatory effects of statins: clinical evidence and basic mechanisms. Nat. Rev. Drug Discov. 4, 977–987 [DOI] [PubMed] [Google Scholar]
- 9. Sebzda E., Zou Z., Lee J. S., Wang T., Kahn M. L. (2008) Transcription factor KLF2 regulates the migration of naive T cells by restricting chemokine receptor expression patterns. Nat. Immunol. 9, 292–300 [DOI] [PubMed] [Google Scholar]
- 10. Carlson C. M., Endrizzi B. T., Wu J., Ding X., Weinreich M. A., Walsh E. R., Wani M. A., Lingrel J. B., Hogquist K. A., Jameson S. C. (2006) Kruppel-like factor 2 regulates thymocyte and T-cell migration. Nature 442, 299–302 [DOI] [PubMed] [Google Scholar]
- 11. Das H., Kumar A., Lin Z., Patino W. D., Hwang P. M., Feinberg M. W., Majumder P. K., Jain M. K. (2006) Kruppel-like factor 2 (KLF2) regulates proinflammatory activation of monocytes. Proc. Natl. Acad. Sci. U.S.A. 103, 6653–6658 [DOI] [PMC free article] [PubMed] [Google Scholar]
- 12. Wani M. A., Means R. T., Jr., Lingrel J. B. (1998) Loss of LKLF function results in embryonic lethality in mice. Transgenic Res. 7, 229–238 [DOI] [PubMed] [Google Scholar]
- 13. Wu J., Srinivasan S. V., Neumann J. C., Lingrel J. B. (2005) The KLF2 transcription factor does not affect the formation of preadipocytes but inhibits their differentiation into adipocytes. Biochemistry 44, 11098–11105 [DOI] [PubMed] [Google Scholar]
- 14. Buckley A. F., Kuo C. T., Leiden J. M. (2001) Transcription factor LKLF is sufficient to program T cell quiescence via a c-Myc-dependent pathway. Nat. Immunol. 2, 698–704 [DOI] [PubMed] [Google Scholar]
- 15. Lingrel J. B., Pilcher-Roberts R., Basford J. E., Manoharan P., Neumann J., Konaniah E. S., Srinivasan R., Bogdanov V. Y., Hui D. Y. (2012) Myeloid-specific Kruppel-like factor 2 inactivation increases macrophage and neutrophil adhesion and promotes atherosclerosis. Circ. Res. 110, 1294–1302 [DOI] [PMC free article] [PubMed] [Google Scholar]
- 16. Bartel D. P. (2004) MicroRNAs: genomics, biogenesis, mechanism, and function. Cell 116, 281–297 [DOI] [PubMed] [Google Scholar]
- 17. Bartel D. P. (2009) MicroRNAs: target recognition and regulatory functions. Cell 136, 215–233 [DOI] [PMC free article] [PubMed] [Google Scholar]
- 18. Hergenreider E., Heydt S., Tréguer K., Boettger T., Horrevoets A. J., Zeiher A. M., Scheffer M. P., Frangakis A. S., Yin X., Mayr M., Braun T., Urbich C., Boon R. A., Dimmeler S. (2012) Atheroprotective communication between endothelial cells and smooth muscle cells through miRNAs. Nat. Cell Biol. 14, 249–256 [DOI] [PubMed] [Google Scholar]
- 19. O'Connell R. M., Zhao J. L., Rao D. S. (2011) MicroRNA function in myeloid biology. Blood 118, 2960–2969 [DOI] [PMC free article] [PubMed] [Google Scholar]
- 20. Lai L., Song Y., Liu Y., Chen Q., Han Q., Chen W., Pan T., Zhang Y., Cao X., Wang Q. (2013) MicroRNA-92a negatively regulates Toll-like receptor (TLR)-triggered inflammatory response in macrophages by targeting MKK4 kinase. J. Biol. Chem. 288, 7956–7967 [DOI] [PMC free article] [PubMed] [Google Scholar]
- 21. Boldin M. P., Taganov K. D., Rao D. S., Yang L., Zhao J. L., Kalwani M., Garcia-Flores Y., Luong M., Devrekanli A., Xu J., Sun G., Tay J., Linsley P. S., Baltimore D. (2011) miR-146a is a significant brake on autoimmunity, myeloproliferation, and cancer in mice. J. Exp. Med. 208, 1189–1201 [DOI] [PMC free article] [PubMed] [Google Scholar]
- 22. Zhuang G., Meng C., Guo X., Cheruku P. S., Shi L., Xu H., Li H., Wang G., Evans A. R., Safe S., Wu C., Zhou B. (2012) A novel regulator of macrophage activation: miR-223 in obesity-associated adipose tissue inflammation. Circulation 125, 2892–2903 [DOI] [PubMed] [Google Scholar]
- 23. Merkerova M., Belickova M., Bruchova H. (2008) Differential expression of microRNAs in hematopoietic cell lineages. Eur. J. Haematol. 81, 304–310 [DOI] [PubMed] [Google Scholar]
- 24. Zhang Y., Liu D., Chen X., Li J., Li L., Bian Z., Sun F., Lu J., Yin Y., Cai X., Sun Q., Wang K., Ba Y., Wang Q., Wang D., Yang J., Liu P., Xu T., Yan Q., Zhang J., Zen K., Zhang C. Y. (2010) Secreted monocytic miR-150 enhances targeted endothelial cell migration. Mol. Cell 39, 133–144 [DOI] [PubMed] [Google Scholar]
- 25. Nakamachi Y., Kawano S., Takenokuchi M., Nishimura K., Sakai Y., Chin T., Saura R., Kurosaka M., Kumagai S. (2009) MicroRNA-124a is a key regulator of proliferation and monocyte chemoattractant protein 1 secretion in fibroblast-like synoviocytes from patients with rheumatoid arthritis. Arthritis Rheum. 60, 1294–1304 [DOI] [PubMed] [Google Scholar]
- 26. Kawano S., Nakamachi Y. (2011) miR-124a as a key regulator of proliferation and MCP-1 secretion in synoviocytes from patients with rheumatoid arthritis. Ann. Rheum. Dis. 70, suppl. 1, i88–91 [DOI] [PubMed] [Google Scholar]
- 27. Lindenblatt C., Schulze-Osthoff K., Totzke G. (2009) IκBζ expression is regulated by miR-124a. Cell Cycle 8, 2019–2023 [DOI] [PubMed] [Google Scholar]
- 28. Tano N., Kim H. W., Ashraf M. (2011) microRNA-150 regulates mobilization and migration of bone marrow-derived mononuclear cells by targeting Cscr4. PLoS One 6, e23114. [DOI] [PMC free article] [PubMed] [Google Scholar]
- 29. Kawano S., Nakamachi Y. (2011) miR-124a as a key regulator of proliferation and MCP-1 secretion in synoviocytes from patients with rheumatoid arthritis. Ann. Rheum. Dis. 70, i88–i91 [DOI] [PubMed] [Google Scholar]
- 30. Cartharius K., Frech K., Grote K., Klocke B., Haltmeier M., Klingenhoff A., Frisch M., Bayerlein M., Werner T. (2005) MatInspector and beyond: promoter analysis based on transcription factor binding sites. Bioinformatics 21, 2933–2942 [DOI] [PubMed] [Google Scholar]
- 31. Nicoli S., Standley C., Walker P., Hurlstone A., Fogarty K. E., Lawson N. D. (2010) MicroRNA-mediated integration of haemodynamics and Vegf signalling during angiogenesis. Nature 464, 1196–1200 [DOI] [PMC free article] [PubMed] [Google Scholar]
- 32. Yu J., Cai X., He J., Zhao W., Wang Q., Liu B. (2013) Microarray-based analysis of gene regulation by transcription factors and microRNAs in glioma. Neurol. Sci. 34, 1283–1289 [DOI] [PubMed] [Google Scholar]
- 33. Rhodes C. J., Wharton J., Boon R. A., Roexe T., Tsang H., Wojciak-Stothard B., Chakrabarti A., Howard L. S., Gibbs J. S., Lawrie A., Condliffe R., Elliot C. A., Kiely D. G., Huson L., Ghofrani H. A., Tiede H., Schermuly R., Zeiher A. M., Dimmeler S., Wilkins M. R. (2013) Reduced microRNA-150 is associated with poor survival in pulmonary arterial hypertension. Am. J. Respir. Crit. Care Med. 187, 294–302 [DOI] [PubMed] [Google Scholar]
- 34. Moser B., Clark-Lewis I., Zwahlen R., Baggiolini M. (1990) Neutrophil-activating properties of the melanoma growth-stimulatory activity. J. Exp. Med. 171, 1797–1802 [DOI] [PMC free article] [PubMed] [Google Scholar]
- 35. McConnell B. B., Yang V. W. (2010) Mammalian Kruppel-like factors in health and diseases. Physiol. Rev. 90, 1337–1381 [DOI] [PMC free article] [PubMed] [Google Scholar]
- 36. Das M., Jiang F., Sluss H. K., Zhang C., Shokat K. M., Flavell R. A., Davis R. J. (2007) Suppression of p53-dependent senescence by the JNK signal transduction pathway. Proc. Natl. Acad. Sci. U.S.A. 104, 15759–15764 [DOI] [PMC free article] [PubMed] [Google Scholar]
- 37. Nayak L., Goduni L., Takami Y., Sharma N., Kapil P., Jain M. K., Mahabeleshwar G. H. (2013) Kruppel-like factor 2 is a transcriptional regulator of chronic and acute inflammation. Am. J. Pathol. 182, 1696–1704 [DOI] [PMC free article] [PubMed] [Google Scholar]
- 38. Allen K. L., Hamik A., Jain M. K., McCrae K. R. (2011) Endothelial cell activation by antiphospholipid antibodies is modulated by Kruppel-like transcription factors. Blood 117, 6383–6391 [DOI] [PMC free article] [PubMed] [Google Scholar]
- 39. Krützfeldt J., Poy M. N., Stoffel M. (2006) Strategies to determine the biological function of microRNAs. Nat. Genet. 38, S14–S19 [DOI] [PubMed] [Google Scholar]