

Abstract
Context:
The mechanisms by which glucocorticoids (GCs) increase skeletal fragility are not well understood.
Objective:
The objective of the study was to evaluate the microarchitecture, trabecular morphology, and biomechanical properties of bone in postmenopausal women treated with GCs.
Design:
This was a case-control study.
Setting:
The study was conducted at a university hospital outpatient facility.
Patients:
Postmenopausal women treated with oral GCs for longer than 3 months (n = 30) and age/race-matched controls (n = 60) participated in the study.
Main Outcome Measures:
Areal bone mineral density aBMD (BMD) by dual-energy x-ray absorptiometry (DXA) was measured. Trabecular and cortical volumetric BMD (vBMD) and microarchitecture by high-resolution peripheral computed tomography of the distal radius and tibia were also measured. Whole-bone stiffness was estimated by finite element analysis. A novel technique, individual trabecula segmentation, was used to evaluate trabecular type (as plate or rod), orientation, and connectivity.
Results:
DXA T-scores did not differ significantly at any site. GC subjects had significantly lower total, cortical, and trabecular vBMD and thinner cortices, fewer, thinner, more widely, and irregularly spaced trabeculae. They had fewer trabecular plates, fewer axially aligned trabeculae, and lower trabecular connectivity. Differences ranged from 4% to 65% for these trabecular measures and 5% to 17% for the cortical measures. Whole-bone stiffness was significantly lower (11%–16%) in GC subjects. Markers of bone formation (osteocalcin and amino-terminal propeptide of type I procollagen) and resorption (C-telopeptide) were lower in the GC subjects.
Conclusions:
Despite similar areal BMD by DXA, GC-treated women had abnormal cortical and trabecular vBMD and microarchitecture at both the radius and tibia, including fewer trabecular plates, a less axially aligned trabecular network, lower trabecular connectivity, thinner cortices, and lower whole-bone stiffness. Further research into these abnormalities as mechanisms for fracture in GC-treated women is warranted.
Osteoporosis is a major complication of glucocorticoid (GC) therapy (1, 2). The risk of vertebral, hip, and other nonvertebral fractures increases within 3 months of drug exposure (3–5). Bone loss and fracture risk are directly associated with dose and duration of GCs (4). Patients treated with GCs have a higher risk of fracture than untreated patients with similar areal bone mineral densities (aBMD) measured by dual-energy x-ray absorptiometry (DXA) (6), suggesting that factors distinct from aBMD contribute to the increased fracture risk in these patients. Bone microarchitecture is an important determinant of bone strength that contributes to fracture susceptibility, independent of areal BMD (7). Differences in bone microarchitecture might therefore contribute to skeletal fragility in patients using GCs.
Histomorphometry of iliac crest bone biopsies has demonstrated lower trabecular bone volume, thinner trabeculae, a more fragmented trabecular network, lower bone formation, and higher bone resorption (8, 9) as well as increased cortical porosity (10) in patients with long-term glucocorticoid use. High-resolution peripheral quantitative computed tomography (HR-pQCT) is a noninvasive, three-dimensional imaging technique, which measures volumetric BMD of the distal radius and tibia, can distinguish between cortical and trabecular bone and visualize fine details of trabecular microarchitecture. HR-pQCT scans can be computationally modeled by microstructural finite element analysis (FEA) to assess bone stiffness, a surrogate measure of strength. HR-pQCT has been used to evaluate structural abnormalities underlying fragility in many different populations (11–15).
We have developed a novel technique based upon HR-pQCT data, individual trabecula segmentation (ITS)-based morphological analysis that provides additional insight into the microstructural mechanisms of skeletal fragility. This three-dimensional, model-independent technique directly measures individual trabeculae, characterizing trabecular type (plate vs. rod), orientation, and connectivity. Trabecular plates and rods of different orientations have distinct roles in mechanical properties and failure mechanisms of trabecular bone (16, 17). We have shown that disparities in plate and rod structure explain differences in bone strength between postmenopausal women with and without fractures (18, 19).
We performed this study to determine whether postmenopausal women with a history of GC use have differences in cortical and trabecular microarchitecture and biomechanical properties of bone compared with controls. We sought to build upon current knowledge by using ITS to evaluate the plate and rod microstructure of trabecular bone in women using GCs, hypothesizing that these novel techniques would reveal skeletal abnormalities that were more pronounced than suggested by DXA. Specifically, based on histomorphometric findings of biopsy studies, we hypothesized that women treated with GCs would have worse microarchitecture, lower volumetric BMD, and lower stiffness compared with controls, although DXA might not differ in the 2 groups. Furthermore, women using GCs would have fewer, thinner trabecular plates and less connectivity between plates and rods by ITS.
Materials and Methods
Patients
Postmenopausal women, over the age of 55 years or more than 5 years after menopause, were recruited at Columbia University Medical Center (New York, New York) by advertisement or self- or physician referral. Cases were women who had at least 3 months of oral glucocorticoid use with a minimum daily dose of 5 mg of prednisone (or the equivalent). Control subjects had no history of glucocorticoid use. Due to standard practice patterns, it was not possible to find controls with the same medical problems as cases who were not being treated with glucocorticoids. Therefore, patients in our clinic population with various chronic diseases were used as controls. Potential cases and controls were excluded if they had endocrinopathies (eg, untreated hyperthyroidism, Cushing's syndrome, prolactinoma), celiac or other gastrointestinal diseases, abnormal mineral metabolism (eg, osteomalacia, primary hyperparathyroidism), or malignancy (except for skin cancer). Hormone replacement therapy and raloxifene were permitted in both groups. Subjects and controls with current or past teriparatide use were excluded. Case subjects with current or prior history of bisphosphonates were included, given the prevalence of bisphosphonate use in this population, and ethical concerns about not treating postmenopausal women using chronic steroids. Control subjects were recruited as part of an ongoing cohort study in which cumulative bisphosphonate use was limited to less than 1 year. At the study visit, medical history, reproductive history, and medication use were assessed. A physical examination was performed including height by Harpenden stadiometer and weight, and body mass index (BMI) was calculated. Physical activity was assessed using the Physical Activity Scale for the Elderly questionnaire, a validated tool for older populations (20). All subjects provided written informed consent, and the Institutional Review Board of Columbia University Medical Center approved this study.
Biochemistries
Serum calcium, albumin, and creatinine were measured using automated techniques. Serum 25-hydroxyvitamin D2 and D3 were measured by ultraperformance liquid chromatography combined with tandem mass spectrometry using a 1290 ultraperformance liquid chromatography and a 6410 tandem mass spectrometer (Agilent). The interassay coefficient of variation (CV) is 2.9% for 25-hydroxyvitamin D2 and 5.4% for 25-hydroxyvitamin D3. Intact PTH was measured by an immunoradiometric assay (Scantibodies Laboratories; CV 6.8%). Serum C-telopeptide (CTX) was measured by an ELISA (Immunodiagnostics Systems; CV < 10%). Osteocalcin was measured by an ELISA (Immunodiagnostic Systems; CV 2.7%). Amino-terminal propeptide of type I procollagen (P1NP) was measured by a RIA (Orion Diagnostica; CV 7.0%). Sclerostin was measured by an ELISA (TECO Medical Group; CV 9.4%). Serum was archived at −80°C and analyzed in one batch after all visits were completed.
Areal bone mineral density
Areal BMD was measured by DXA (QDR-4500; Hologic Inc) at the lumbar spine (L1–4), total hip, femoral neck, one third radius, and ultradistal radius. Lumbar vertebrae with significant deformity, osteosclerosis, osteophytes, or degenerative disease were excluded from the analysis. T-scores compared subjects and controls with young-normal populations of the same race and sex, as provided by the manufacturer.
HR-pQCT and image-based microstructural FEA of the distal radius and tibia
HR-pQCT (XtremeCT; Scanco Medical AG) was performed by immobilizing the nondominant forearm and ipsilateral tibia in a carbon fiber shell and scanning as we have described in prior publications (11, 21–23). The European Forearm Phantom was scanned daily for quality control. All scans were acquired by the same highly experienced technician. The standard patient thresholding procedure was used to segment the mineralized phase. In addition to standard cortical and trabecular measurements of volumetric BMD, cortical thickness and trabecular microarchitecture, HR-pQCT data were used to calculate whole-bone stiffness, a measure of bone's resistance to force.
Cortical porosity
To evaluate the cortical bone structure, a validated autosegmentation method (24) was applied to separate the cortical and trabecular compartments and to measure cortical porosity (percentage). This method has been validated for accuracy (25) and reproducibility (26), and it is distributed by the manufacturer (Scanco Medical).
ITS-based morphological analyses of HR-pQCT images
The trabecular bone compartment of each HR-pQCT image was extracted from cortex using the autosegmentation method that could accurately separate trabecular bone from cortical bone (24, 25). Trabecular bone images were then subjected to ITS-based morphological analyses. A complete volumetric decomposition technique was applied to segment the trabecular network into individual plates and rods. Detailed methods describing this technique and ITS-based measurements can be found in our prior publications (16, 17, 27). Based on the three-dimensional evaluations of each individual trabecular plate and rod, bone volume, and plate and rod number were evaluated by plate and rod bone volume fraction as well as plate and rod number densities (1 per millimeter). Intactness of trabecular network was characterized by plate-plate, plate-rod, and rod-rod junction density (1 per cubic millimeter), calculated as the total number of junctions between trabecular plates and rods normalized by the bulk volume. Orientation of trabecular bone network was characterized by axial bone volume fraction, defined as axially aligned bone volume divided by the bulk volume.
Statistical methods
Analyses were conducted with STATA version 11.0 (Stata Corp) and SAS version 9.1 (SAS Institute Inc). Normality testing (Shapiro Wilk) was performed and variables that were not normally distributed were logarithmically transformed prior to group comparisons. Satterthwaite adjustment was performed in the case of unequal variance between the groups. Two-sided values of P < .05 were considered to indicate statistical significance. Descriptive data are presented as mean ± SD and group comparisons as mean ± SEM. The differences between GC and control subjects were assessed by a Student's t test or χ2. Relationships between dose and duration of GC use with microarchitecture were assessed using Pearson correlations.
Results
Thirty postmenopausal women with a history of 3 or more months of oral GC use were enrolled and matched one to two by age (±3 y) and race/ethnicity to a control group with no GC exposure. The mean age of enrolled subjects was 68 ± 8 years. The majority (67%) was Caucasian and the rest were Latina. The mean daily GC dose was 8.4 ± 7.2 mg (median dose 5 mg). The mean duration of use was 2.9 ± 3.4 years, with a mean cumulative dose of 49 ± 12 g (median 9 g). Most patients were using glucocorticoids for rheumatological conditions. These included polymyalgia rheumatica/giant cell arteritis (n = 6), polymyositis (n = 2), lupus (n = 5), rheumatoid arthritis (n = 4), and other inflammatory arthritis (n = 3). Other indications were gastrointestinal [Crohn's disease (n = 2) and ulcerative colitis (n = 1)]; pulmonary, [asthma (n = 4) and interstitial lung disease (n = 1)]; and renal, [minimal change disease (n = 1), focal segmental glomerulosclerosis (n = 1), and glomerulomephritis (n = 1)].
GC subjects and controls did not differ on the basis of height, weight, or time since menopause (Table 1). Control subjects reported greater alcohol use (P < .03), although only three subjects had more than 2 U/d. Tobacco use and a family history of osteoporosis did not differ. GC subjects were more likely to be using bisphosphonates (P < .01) and tended to use more hormone replacement therapy (HRT) (P = .10). Calcium intake from supplements was greater among GC subjects (895 vs 525 mg daily; P < .01). Mean vitamin D intake was similar between groups and above the recommended daily allowance, although there was a wide range of intakes among the subjects. The prevalence of chronic medical problems in both groups is detailed in Table 1. Fewer GC-treated patients had diabetes (P < .03), but more had hyperlipidemia (P < .01). Sixteen of the GC-treated women had prevalent fractures, and the most common sites were vertebral (44%), ankle (19%), and forearm (13%). As per protocol specifications, there were no fractures among the control group. Physical activity, assessed by the Physical Activity Scale for the Elderly questionnaire, was variable among the subjects on average and not significantly different between groups (105 ± 78 in controls and 96 ± 65 in GC subjects; P = .56). Values in both groups were similar to the mean (and median) values from the general population [103 (90)].
Table 1.
Characteristics of the Study Population (Mean ± SD)
| GC (n = 30) | Control (n = 60) | P Value | |
|---|---|---|---|
| Age, y | 68 ± 9 | 67 ± 7 | .58 |
| Race, % Caucasian | 67 | 67 | 1.00 |
| Height, cm | 159 ± 8 | 160 ± 7 | .63 |
| Weight, kg | 71 ± 19 | 71 ± 16 | .82 |
| BMI, kg/m2 | 28 ± 8 | 28 ± 6 | .65 |
| Years since menopause | 21 ± 10 | 19 ± 10 | .47 |
| Family history of osteoporosis by BMD, % | 40 | 46 | .58 |
| Family history of fracture, % | 37 | 33 | .77 |
| Tobacco use | |||
| Never, % | 43 | 50 | .14 |
| Former, % | 50 | 50 | |
| Current, % | 7 | 0 | |
| Alcohol use, beverages per day | 0.2 ± 0.3 | 0.7 ± 1.1 | .03 |
| Calcium supplements, total daily dose, mg | 895 ± 569 | 524 ± 461 | .01 |
| Vitamin D supplements, total daily dose, IU | 1374 ± 1552 | 1129 ± 1768 | .54 |
| Bisphosphonates, current use, % | 30 | 7 | .01 |
| HRT, % | 13 | 4 | .10 |
| Raloxifene, % | 3 | 2 | .65 |
| T4, % | 13 | 25 | .21 |
| Thiazide diuretics, % | 14 | 17 | .78 |
| GC use | |||
| Duration, y | 2.9 ± 3.4 | n/a | |
| Current dose, mg/d | 8.4 ± 7.2 | n/a | |
| Cumulative dose, g | 49 ± 12 | n/a | |
Abbreviation: n/a, not available. Bold values indicate significance.
Bone turnover markers were significantly lower in GC patients than in controls (Table 2). Bone formation markers, osteocalcin and P1NP, were 33% lower (P < .05) and 28% lower (P = .051), respectively, in GC patients, and the bone resorption maker CTX was 39% lower (P < .01). Sclerostin was also 29% lower in GC subjects than controls (P < .01). PTH was within the normal range. The mean serum 25-hydroxyvitamin D concentrations were in the sufficient range (>30 ng/mL) and did not significantly differ between groups.
Table 2.
Biochemistries in GC and Control Subjects (Mean ± SD)
| GC | Control | P Value | |
|---|---|---|---|
| Osteocalcin, 8.4–33.9 ng/mL | 14.6 ± 10.8 | 21.9 ± 15.0 | <.02 |
| P1NP, 16–96 μg/L | 41.3 ± 34.4 | 57.7 ± 33.6 | <.05 |
| CTX, 0.11–0.74 ng/mL | 0.31 ± 0.20 | 0.50 ± 0.26 | <.001 |
| Sclerostin, mean 0.69 ± 0.26 ng/mL | 0.63 ± 0.23 | 0.88 ± 0.37 | <.001 |
| 25-Hydroxyvitamin D, 30–80 ng/mL | 39.3 ± 12.5 | 34.6 ± 11.3 | .13 |
| PTH, 14–66 pg/mL | 46.7 ± 30.0 | 51.1 ± 39.7 | .57 |
The prevalence of osteoporosis (47% in GC subjects and 37% in controls) and osteopenia (43% in GC subjects and 50% in controls) did not differ significantly between groups. Mean DXA T-scores were similar between groups at all sites, except at the total hip, in which they tended to be lower in women using GCs (P < .08; Figure 1).
Figure 1.

Comparison of T-scores (mean ± SEM) by DXA in postmenopausal women using GCs (striped bars) and controls (white bars) at the lumbar spine (LS), total hip (TH), femoral neck (FN), one third radius (1/3R), and ultradistal radius (UDR). No significant difference was found at any site, although GC subjects tended to have lower T-scores at the total hip (TH) (P = .08).
Volumetric BMD, cortical and trabecular microarchitecture by HR-pQCT, and whole-bone stiffness by FEA differed markedly between GC and control subjects (Figure 2). At the radius, bone size, measured as total cross-sectional area, did not differ. GC subjects had significantly smaller cortical area (−15.8%; P < .002) and tended to have a larger trabecular area (10%; P < .07). Total density was lower (−17.6%; P < .001). Cortical density (−4.7%; P < .02) and cortical thickness (−16.6%; P < .002) were significantly lower in the GC subjects. Trabecular density was significantly lower (−20.4%; P < .005) and trabecular microarchitecture was worse, with lower trabecular number (−27.5%; P < .04) and thickness (−9.3%; P < .03) and greater separation (30.7%; P < .03) in the GC subjects. Network heterogeneity, a measure of how irregularly spaced the trabeculae are, was greater (64.8%; P < .04). Whole-bone stiffness was significantly lower among the GC subjects (−15.7%; P < .005), as was failure load (−14.6%; P < .007).
Figure 2.

Comparison of the percent difference ± SEM in vBMD and microarchitecture by HR-pQCT and whole-bone stiffness by FEA in GC-treated and control subjects at the radius (black bars) and tibia (gray bars). *, P < .05; **, P < .01. Ct.Th, cortical thickness; Ct.vBMD, cortical density; Tb.Number, trabecular number; Tb.Separation, trabecular separation; Tb.Thickness, trabecular thickness; Tb.vBMD, trabecular density; Total vBMD, total density.
At the tibia, the total cross-sectional area did not differ. However, GC subjects tended to have a smaller cortical area (−11.4%; P = .08) and a greater trabecular area (9.3%; P = .07). The total density (−17.0%; P < .0001), trabecular density (−18.4; P < .002), and cortical density (−5.5%; P < .02) were lower among the GC subjects and of the same magnitude as the radial differences. Cortical thickness tended to be lower (−12.8%; P = .056). The trabecular thickness was lower (−13.4; P < .002). The trabecular number did not differ. The trabecular separation tended to be greater among the GC subjects (11.2%; P = .09), and network heterogeneity was significantly greater (33.3%; P < .02). Whole-bone stiffness was lower among the GC subjects (−10.5%; P < .02). Failure load tended to be lower (−9%; P = .59). Cortical porosity did not differ at either site (radius: GC 2.8% ± 0.2% vs control 2.6% ± 0.1%, P = .58; tibia: GC, 7.4 ± 0.3, vs control, 7.3 ± 0.2, P = .80).
Current GC dose tended to be associated with more heterogeneity of the trabecular network at the tibia (0.33; P = .07) but was not associated with other microarchitectural parameters. We did not find an association between cumulative GC dose, or treatment duration, and microarchitecture or stiffness.
Using ITS at the radius, GC subjects had significantly lower, directly measured bone volume fraction (−12.6; P < .03) and fewer trabecular plates (−6.9%; P < .03) and tended to have fewer trabecular rods (−3.7%; P = .08). They had significantly fewer axially aligned trabeculae (−16.0%; P < .03). They had lower connectivity between plates (−18.9%; P < .02) and between plates and rods (−17.4%; P < .02). There was no difference in connectivity between rods. At the tibia, women using GCs tended to have lower bone volume fraction (−8.0%; P = .052), had significantly fewer trabecular plates (−5.7%; P < .02), had fewer axially aligned trabeculae (−14; P < .01), and had less connectivity between plates (−14%; P < .02). They tended to have less connectivity between plates and rods (−10.3%; P = .06). There was no difference in rod number or connectivity between the rods (Figure 3). Representative HR-pQCT and ITS images are shown in Figure 4.
Figure 3.

Comparison of plate and rod structure and connectivity by ITS-based morphological analysis between GC-treated and control subjects. A, Percentage differences ± SEM shown. *, P < .05; **, P < .01. aBV/TV, axial bone volume fraction; BV/TV, total bone volume fraction; PP Junc.D, plate-plate junction density; P-R Junc.D, plate-rod junction pTb.N, plate trabecular number; rTb.N, rod trabecular number; density.
Figure 4.
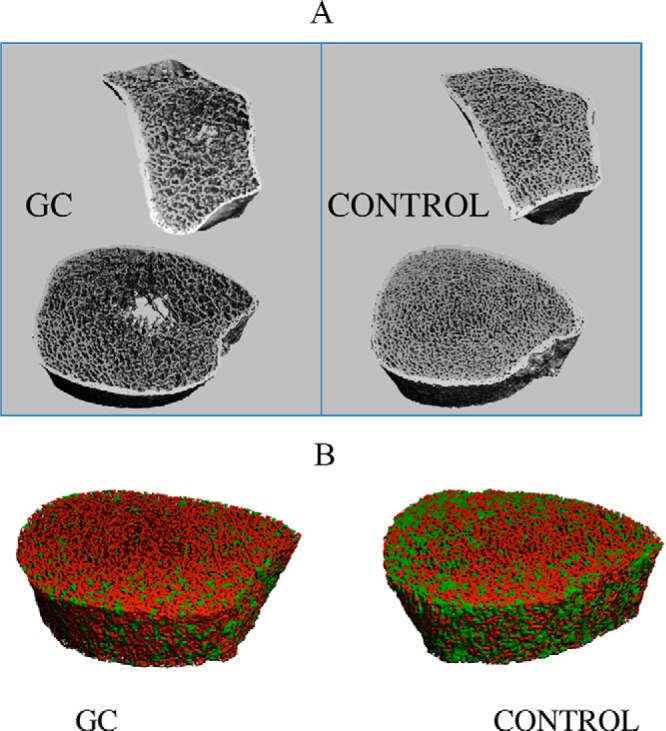
A, HR-pQCT scans of the distal radius (above) and tibia (below) from a GC-treated subject and control matched for age and race/ethnicity demonstrate the lower trabecular number, increased trabecular separation, and heterogeneity found in the GC subjects. B, ITS images (plates in green, rods in red) at the radius illustrating fewer trabecular plates in the GC-treated subject.
Analyses were repeated, excluding women receiving bisphosphonates (21 GC treated women and 54 controls remained). Results were similar to those in the entire cohort. Bone resorption remained lower in GC-treated subjects. At the radius, differences in total density, trabecular density, trabecular number separation and heterogeneity, cortical thickness, and whole-bone stiffness remained significant. The differences in cortical density (P = .10) and trabecular thickness (P = .07) were no longer significant. At the tibia, the difference in total density, cortical density, trabecular density, and trabecular thickness and network heterogeneity remained significant. The difference in whole-bone stiffness became a trend (P = .055). As in the entire cohort, there was no significant difference in cortical thickness (P = .23) or trabecular separation (P = .12). All differences in the ITS measures remained significant. In this subgroup, there was no difference in cortical porosity at either site according to GC treatment.
Discussion
In this study, we found that postmenopausal women using GCs had cortical and trabecular abnormalities and lower stiffness compared with age- and ethnicity-matched controls and extend previous reports by describing pronounced abnormalities at both the radius and tibia as well as new abnormalities in trabecular microstructure. In contrast to the differences in volumetric BMD (vBMD) and microarchitecture, we did not detect any significant differences in aBMD by DXA between the 2 groups. Although it is possible that our sample size precluded our detection of significant differences in aBMD, this finding is consistent with studies demonstrating an increased fracture risk in GC-treated subjects despite similar aBMD to controls (6) as well as reports of microarchitectural abnormalities in women with fragility fractures compared with controls despite the similar areal bone density results (11, 21, 22, 28, 29).
To date, only one study has used HR-pQCT to compare GC-treated patients and controls. Tang et al (15) found that a group of pre- and postmenopausal Chinese women using GCs had lower total and cortical vBMD, lower cortical thickness, higher cortical porosity, and lower stiffness at the radius compared with a group of healthy controls. They found no significant differences in the trabecular variables. Measurements at the tibia were not obtained. More GC-treated patients were postmenopausal and had lower BMI than the controls, which may have influenced their results. Racial differences in study populations may also have contributed to the disparate findings between their study and ours because significant microarchitectural and strength differences exist between Chinese and Caucasian women (30). Because we included only postmenopausal women and our controls had other chronic diseases common in this age group, we may have been able to discern more specific effects of GC treatment at both the radius and tibia.
Our findings of lower trabecular number, thickness, greater separation, and network heterogeneity in GC-treated women are consistent with prior histomorphometric studies showing that patients using GCs have decreased trabecular bone volume, thinner trabeculae, a more fragmented trabecular network, lower bone formation, and higher bone resorption (8, 9, 31). This is the first study to use ITS to evaluate trabecular characteristics and connectivity in woman treated with GCs. With this higher-order imaging, we found that women using GCs had fewer trabecular plates, fewer axially aligned trabeculae, and less connectivity between trabeculae, all features that have been associated with decreased strength (16, 17). Trabecular differences were somewhat less pronounced at the tibia than the radius, suggestive of a protective effect of weight bearing on trabecular bone at that site. We have reported similar discrepancies between the radius and tibia in osteopenic women with fractures (19) and women with hyperparathyroidism (23) compared with controls.
Although bone biopsy studies have predominantly reported abnormalities in the trabecular bone (8, 31), our use of HR-pQCT enabled us to discern abnormalities in cortical density and thickness as well. We did not detect an increase in cortical porosity, which has been previously reported (10, 15). This difference may be related to methodology because one of these studies was based on transiliac crest bone biopsies. GC-treated women in our study may have had differences in fine porosity or primarily endocortical porosity, as opposed to coalesced osteons, or macropores, that were not detectable by the resolution of our technique. This idea is supported by the fact that we did detect differences in cortical density. Our analyses were based on images thresholded by the global threshold technique provided by the HR-pQCT manufacturer, which may overestimate trabecular bone parameters, particularly in patients who have cortical thinning and increased endosteal porosity (32). The study by Tang et al (15) using HR-pQCT, did not report PTH levels, but it is conceivable that higher levels of PTH among those subjects may have contributed to increased cortical porosity in that cohort. The magnitude of trabecular differences was greater than seen in cortical bone, consistent with studies from our group and others of both women with osteoporotic fractures and hyperparathyroidism (11, 12, 14, 23) and likely related to the higher rate of turnover of this skeletal compartment. The largest difference was in the measure of network heterogeneity. This may be an important feature of skeletal deterioration in GC-treated patients and may reflect uncoupling due to profound suppression bone formation by osteoblasts, ultimately resulting in trabecular dropout.
Whole-bone stiffness was markedly lower at both the radius and tibia in women treated with GCs, which may be associated with the increased fracture risk reported in GC-treated subjects (33). Other authors have reported lower stiffness with central and peripheral FEA (13, 34, 35). We are the first to report equivalently lower stiffness at both the radius and tibia. Although vertebrae are the most common site of GC-related fractures (36, 37), as opposed to peripheral locations, we have previously reported that tibial microstructure and strength is closely associated with the presence of vertebral fractures (21). Studies using central quantitative computed tomography have reported lower cortical and trabecular vBMD of the spine and hip (38) and lower stiffness by FEA at the hip in patients using oral GCs than controls (39).
In our study, the GC and control groups were well matched on age, race, BMI, years since menopause, and chronic diseases. The significantly higher use of bisphosphonates in GC subjects compared with controls may have biased the results toward the null and masked an even greater effect of GCs on bone quality. Our results do not suggest that a difference in physical activity played a substantial role in the difference in skeletal structure and strength that we found between GC-treated women and controls. This may be because the activity levels in both groups were fairly robust. In an older population, we may have detected more of an effect of GCs on muscle weakness and, subsequently, activity. It is also important to note that scores were higher in controls and therefore conceivable that with a larger sample, we might have observed significant differences.
Although we found a small association between current GC dose and trabecular heterogeneity, we did not observe a relationship between the current dose and other microarchitectural parameters, nor did we find an association between the cumulative GC dose or treatment duration and microarchitecture or stiffness. This may have been due to several factors. The structural differences we observed may have occurred shortly after the initiation of GC treatment and be less related to effects of long-term treatment. Some women, because of the influence of genetics and lifestyle on bone, may have had a greater detrimental response to the initiation of treatment, something we could not detect with our study design. Our small sample size may have also precluded detecting an effect.
The structural abnormalities we observed in the GC-treated patients may reflect the cellular effects of these medications. GCs decrease osteoblast number and function by inhibiting replication of osteoblastic lineage cells, thus reducing the pool of mature osteoblasts (40). GCs also inhibit osteoblast differentiation by interfering with signaling between wnt and β-catenin (41). An antiapoptotic effect on osteoclasts may also result in an early transient increase in bone resorption (42). This uncoupling of bone turnover may result decreased ability to repair ongoing age-related losses and subsequently the marked structural abnormalities that we observed. GCs also reduce osteocyte viability (41) and may adversely affect their function by increasing the size of osteocyte lacunae and decreasing mineralization and strength of the surrounding bone (43). We observed that both formation and resorption markers were lower in GC subjects. This may have reflected the suppressive effects of long-term glucocorticoids on bone turnover (2); the initial, transient increase in bone resorption was not seen because most patients had been on treatment for extended periods.
Our finding could also be due to greater bisphosphonate and HRT use among GC-treated women. It is notable that after restricting our analysis to women not on antiresorptive treatment, the results did not significantly change. Variability in the levels of bone turnover markers may have accounted for the lack of an association with turnover markers and microarchitecture. Another potential explanation is that perturbations in turnover were associated with early microarchitectural changes and that the microstructural abnormalities we observed reflected long-term GC use. Lower levels of sclerostin in the GC group likely reflect the destructive effects of GCs on osteocytes. Although the inhibition of the wnt pathway is considered to play an important role in GC suppression of bone formation, studies measuring sclerostin in GC-treated patients have found conflicting results (28, 44). Differences may relate to dose, duration, and indication for treatment.
Our findings have several significant implications. They demonstrate a structural basis, distinct from aBMD, which may account for skeletal fragility among postmenopausal women on glucocorticoids. They highlight that both cortical and trabecular bone abnormalities are found in women using GCs and that there are substantial abnormalities in trabecular plate structure, alignment, connectivity, and whole-bone stiffness.
This study has both unique strengths and important limitations. This is the first study to use FEA and ITS to evaluate trabecular bone in patients using GCs and to compare postmenopausal women treated with GCs and controls with chronic illnesses. By assessing both the radius and tibia, we were able to evaluate the effects of these medications at multiple skeletal sites and determine the modifying effects of weight bearing. Although we included a control population with similar rates of chronic diseases, we were not able to compare subjects with a control group with the same diseases for which they were receiving GCs because GC treatment of these patients is part of routine clinical care. Important limitations are our sample size and the cross-sectional study design, which prevented us from determining whether microarchitectural abnormalities reflect ongoing losses or effects that occurred early after the initiation of GC treatment. This study was not designed to evaluate fracture as an outcome. We did not measure vBMD at the spine, the site most commonly affected by GC associated fractures. Bisphosphonate use by many of the women in the GC group, appropriate clinically given their fracture risk, may have contributed to the suppression of their bone turnover markers. There are also several potential measurement limitations, which may have precluded our ability to detect differences in porosity, as summarized earlier in the Discussion. Studies in men and premenopausal women would be helpful in determining whether these findings are specific to postmenopausal women. Longitudinal studies will be critical to better delineate a mechanism for the structural deficits that we observed and to better investigate the relationship between the duration of therapy and structural abnormalities.
In conclusion, this study demonstrated several novel structural abnormalities in postmenopausal women using glucocorticoids. With ITS, we found that women using GCs have fewer trabecular plates, a less axially aligned trabecular network, and less trabecular connectivity. Women treated with GCs had marked trabecular and cortical abnormalities and lower stiffness at both the radius and tibia. Our work suggests new mechanisms for biomechanical compromise in women treated with chronic GCs and provides the basis for future studies of fracture in this population.
Acknowledgments
We thank Elizabeth Shane for her guidance with study design and manuscript preparation.
This work was supported by the Junior Faculty Osteoporosis Research Award from the American Society for Bone and Mineral Research (to E.M.S.), National Institutes of Health Grant NIHK23 DK084337 (to E.M.S.), National Institutes of Health Grant R01 AR051376 (to X.E.G.), National Institutes of Health Grant R01 AR058004 (to X.E.G. and Elizabeth Shane), and the Thomas L. Kempner and Katheryn C. Patterson Foundation.
Disclosure Summary: The authors have no conflicts of interest.
Footnotes
- aBMD
- areal BMD
- BMD
- bone mineral density
- BMI
- body mass index
- CTX
- C-telopeptide
- CV
- coefficient of variation
- DXA
- dual-energy x-ray absorptiometry
- FEA
- finite element analysis
- GC
- glucocorticoid
- HR-pQCT
- high-resolution peripheral quantitative computed tomography
- HRT
- hormone replacement therapy
- ITS
- individual trabecula segmentation
- P1NP
- amino-terminal propeptide of type I procollagen
- vBMD
- volumetric BMD.
References
- 1. Lukert BP, Raisz LG. Glucocorticoid-induced osteoporosis: pathogenesis and management. Ann Intern Med. 1990;112:352–364. [DOI] [PubMed] [Google Scholar]
- 2. Weinstein RS. Clinical practice. Glucocorticoid-induced bone disease. N Engl J Med. 2011;365:62–70. [DOI] [PubMed] [Google Scholar]
- 3. Van Staa TP, Leufkens HG, Abenhaim L, Zhang B, Cooper C. Use of oral corticosteroids and risk of fractures. June 2000. J Bone Miner Res. 2005;20:1487–1494; discussion 1486. [DOI] [PubMed] [Google Scholar]
- 4. van Staa TP, Leufkens HG, Abenhaim L, Zhang B, Cooper C. Oral corticosteroids and fracture risk: relationship to daily and cumulative doses. Rheumatology (Oxford). 2000;39:1383–1389. [DOI] [PubMed] [Google Scholar]
- 5. Reid IR. Glucocorticoid effects on bone. J Clin Endocrinol Metab. 1998;83:1860–1862. [DOI] [PubMed] [Google Scholar]
- 6. Van Staa TP, Laan RF, Barton IP, Cohen S, Reid DM, Cooper C. Bone density threshold and other predictors of vertebral fracture in patients receiving oral glucocorticoid therapy. Arthritis Rheum. 2003;48:3224–3229. [DOI] [PubMed] [Google Scholar]
- 7. Cheung AM, Detsky AS. Osteoporosis and fractures: missing the bridge? JAMA. 2008;299:1468–1470. [DOI] [PubMed] [Google Scholar]
- 8. Dalle Carbonare L, Arlot ME, Chavassieux PM, Roux JP, Portero NR, Meunier PJ. Comparison of trabecular bone microarchitecture and remodeling in glucocorticoid-induced and postmenopausal osteoporosis. J Bone Miner Res. 2001;16:97–103. [DOI] [PubMed] [Google Scholar]
- 9. Lo Cascio V, Kanis JA, Beneton MN, et al. Acute effects of deflazacort and prednisone on rates of mineralization and bone formation. Calcif Tissue Int. 1995;56:109–112. [DOI] [PubMed] [Google Scholar]
- 10. Vedi S, Elkin SL, Compston JE. A histomorphometric study of cortical bone of the iliac crest in patients treated with glucocorticoids. Calcif Tissue Int. 2005;77:79–83. [DOI] [PubMed] [Google Scholar]
- 11. Stein EM, Liu XS, Nickolas TL, et al. Abnormal Microarchitecture and stiffness in postmenopausal women with ankle fractures. J Clin Endocrinol Metab. 2011;96:2041–2048. [DOI] [PMC free article] [PubMed] [Google Scholar]
- 12. Stein EM, Liu XS, Nickolas TL, et al. Abnormal microarchitecture and reduced stiffness at the radius and tibia in postmenopausal women with fractures. J Bone Miner Res. 2010;25:2572–2581. [DOI] [PMC free article] [PubMed] [Google Scholar]
- 13. Melton LJ, 3rd, Riggs BL, van Lenthe GH, et al. Contribution of in vivo structural measurements and load/strength ratios to the determination of forearm fracture risk in postmenopausal women. J Bone Miner Res. 2007;22:1442–1448. [DOI] [PubMed] [Google Scholar]
- 14. Boutroy S, Bouxsein ML, Munoz F, Delmas PD. In vivo assessment of trabecular bone microarchitecture by high-resolution peripheral quantitative computed tomography. J Clin Endocrinol Metab. 2005;90:6508–6515. [DOI] [PubMed] [Google Scholar]
- 15. Tang XL, Qin L, Kwok AW, et al. Alterations of bone geometry, density, microarchitecture, and biomechanical properties in systemic lupus erythematosus on long-term glucocorticoid: a case-control study using HR-pQCT. Osteoporos Int. 2012;24(6):1817–1826. [DOI] [PubMed] [Google Scholar]
- 16. Liu XS, Sajda P, Saha PK, et al. Complete volumetric decomposition of individual trabecular plates and rods and its morphological correlations with anisotropic elastic moduli in human trabecular bone. J Bone Miner Res. 2008;23:223–235. [DOI] [PMC free article] [PubMed] [Google Scholar]
- 17. Liu XS, Sajda P, Saha PK, Wehrli FW, Guo XE. Quantification of the roles of trabecular microarchitecture and trabecular type in determining the elastic modulus of human trabecular bone. J Bone Miner Res. 2006;21:1608–1617. [DOI] [PMC free article] [PubMed] [Google Scholar]
- 18. Liu XS, Stein EM, Zhou B, et al. Individual trabecula segmentation (ITS)-based morphological analyses and microfinite element analysis of HR-pQCT images discriminate postmenopausal fragility fractures independent of DXA measurements. J Bone Miner Res. 2012;27:263–272. [DOI] [PMC free article] [PubMed] [Google Scholar]
- 19. Stein EM, Kepley A, Walker MD, et al. Skeletal structure in postmenopausal women with osteopenia and fractures is characterized by abnormal trabecular plates and cortical thinning. J Bone Miner Res. 2014;29:1101–1109. [DOI] [PMC free article] [PubMed] [Google Scholar]
- 20. Washburn RA, Smith KW, Jette AM, Janney CA. The Physical Activity Scale for the Elderly (PASE): development and evaluation. J Clin Epidemiol. 1993;46:153–162. [DOI] [PubMed] [Google Scholar]
- 21. Stein EM, Liu XS, Nickolas TL, et al. Microarchitectural abnormalities are more severe in postmenopausal women with vertebral compared to nonvertebral fractures. J Clin Endocrinol Metab. 2012;97:E1918–E1926. [DOI] [PMC free article] [PubMed] [Google Scholar]
- 22. Stein EM, Liu XS, Nickolas TL, et al. Abnormal microarchitecture and reduced stiffness at the radius and tibia in postmenopausal women with fractures. J Bone Miner Res. 2010;25:2296–2305. [DOI] [PMC free article] [PubMed] [Google Scholar]
- 23. Stein EM, Silva BC, Boutroy S, et al. Primary hyperparathyroidism is associated with abnormal cortical and trabecular microstructure and reduced bone stiffness in postmenopausal women. J Bone Miner Res. 2013;28:1029–1040. [DOI] [PMC free article] [PubMed] [Google Scholar]
- 24. Buie HR, Campbell GM, Klinck RJ, MacNeil JA, Boyd SK. Automatic segmentation of cortical and trabecular compartments based on a dual threshold technique for in vivo micro-CT bone analysis. Bone. 2007;41:505–515. [DOI] [PubMed] [Google Scholar]
- 25. Nishiyama KK, Macdonald HM, Buie HR, Hanley DA, Boyd SK. Postmenopausal women with osteopenia have higher cortical porosity and thinner cortices at the distal radius and tibia than women with normal aBMD: an in vivo HR-pQCT study. J Bone Miner Res. 2010;25:882–890. [DOI] [PubMed] [Google Scholar]
- 26. Burghardt AJ, Buie HR, Laib A, Majumdar S, Boyd SK. Reproducibility of direct quantitative measures of cortical bone microarchitecture of the distal radius and tibia by HR-pQCT. Bone. 2010;47:519–528. [DOI] [PMC free article] [PubMed] [Google Scholar]
- 27. Saha PK, Chaudhuri BB. 3D digital topology under binary transformation with applications. Comput Vis Image Underst. 1996;63:418–429. [Google Scholar]
- 28. Gifre L, Ruiz-Gaspa S, Monegal A, et al. Effect of glucocorticoid treatment on Wnt signalling antagonists (sclerostin and Dkk-1) and their relationship with bone turnover. Bone. 2013;57:272–276. [DOI] [PubMed] [Google Scholar]
- 29. Melton LJ, 3rd, Christen D, Riggs BL, et al. Assessing forearm fracture risk in postmenopausal women. Osteoporos Int. 2010;21:1161–1169. [DOI] [PMC free article] [PubMed] [Google Scholar]
- 30. Liu XS, Walker MD, McMahon DJ, et al. Better skeletal microstructure confers greater mechanical advantages in Chinese-American women versus white women. J Bone Miner Res. 2011;26:1783–1792. [DOI] [PMC free article] [PubMed] [Google Scholar]
- 31. Chappard D, Josselin N, Rouge-Maillart C, Legrand E, Basle MF, Audran M. Bone microarchitecture in males with corticosteroid-induced osteoporosis. Osteoporos Int. 2007;18:487–494. [DOI] [PubMed] [Google Scholar]
- 32. Zebaze RM, Ghasem-Zadeh A, Bohte A, et al. Intracortical remodelling and porosity in the distal radius and post-mortem femurs of women: a cross-sectional study. Lancet. 2010;375:1729–1736. [DOI] [PubMed] [Google Scholar]
- 33. Van Staa TP, Leufkens HG, Abenhaim L, Zhang B, Cooper C. Use of oral corticosteroids and risk of fractures. J Bone Miner Res. 2000;15:993–1000. [DOI] [PubMed] [Google Scholar]
- 34. Siris ES, Miller PD, Barrett-Connor E, et al. Identification and fracture outcomes of undiagnosed low bone mineral density in postmenopausal women: results from the National Osteoporosis Risk Assessment. JAMA. 2001;286:2815–2822. [DOI] [PubMed] [Google Scholar]
- 35. Boutroy S, Van Rietbergen B, Sornay-Rendu E, Munoz F, Bouxsein ML, Delmas PD. Finite element analysis based on in vivo HR-pQCT images of the distal radius is associated with wrist fracture in postmenopausal women. J Bone Miner Res. 2008;23:392–399. [DOI] [PubMed] [Google Scholar]
- 36. van Staa TP, Leufkens HG, Cooper C. The epidemiology of corticosteroid-induced osteoporosis: a meta-analysis. Osteoporos Int. 2002;13:777–787. [DOI] [PubMed] [Google Scholar]
- 37. Canalis E, Mazziotti G, Giustina A, Bilezikian JP. Glucocorticoid-induced osteoporosis: pathophysiology and therapy. Osteoporos Int. 2007;18:1319–1328. [DOI] [PubMed] [Google Scholar]
- 38. Rehman Q, Lang T, Modin G, Lane NE. Quantitative computed tomography of the lumbar spine, not dual x-ray absorptiometry, is an independent predictor of prevalent vertebral fractures in postmenopausal women with osteopenia receiving long-term glucocorticoid and hormone-replacement therapy. Arthritis Rheum. 2002;46:1292–1297. [DOI] [PubMed] [Google Scholar]
- 39. Lian KC, Lang TF, Keyak JH, et al. Differences in hip quantitative computed tomography (QCT) measurements of bone mineral density and bone strength between glucocorticoid-treated and glucocorticoid-naive postmenopausal women. Osteoporos Int. 2005;16:642–650. [DOI] [PubMed] [Google Scholar]
- 40. Weinstein RS, Jilka RL, Parfitt AM, Manolagas SC. Inhibition of osteoblastogenesis and promotion of apoptosis of osteoblasts and osteocytes by glucocorticoids. Potential mechanisms of their deleterious effects on bone. J Clin Invest. 1998;102:274–282. [DOI] [PMC free article] [PubMed] [Google Scholar]
- 41. Ohnaka K, Tanabe M, Kawate H, Nawata H, Takayanagi R. Glucocorticoid suppresses the canonical Wnt signal in cultured human osteoblasts. Biochem Biophys Res Commun. 2005;329:177–181. [DOI] [PubMed] [Google Scholar]
- 42. Jia D, O'Brien CA, Stewart SA, Manolagas SC, Weinstein RS. Glucocorticoids act directly on osteoclasts to increase their life span and reduce bone density. Endocrinology. 2006;147:5592–5599. [DOI] [PMC free article] [PubMed] [Google Scholar]
- 43. Sambrook PN. Anabolic therapy in glucocorticoid-induced osteoporosis. N Engl J Med. 2007;357:2084–2086. [DOI] [PubMed] [Google Scholar]
- 44. Brabnikova Maresova K, Pavelka K, Stepan JJ. Acute effects of glucocorticoids on serum markers of osteoclasts, osteoblasts, and osteocytes. Calcif Tissue Int. 2013;92:354–361. [DOI] [PubMed] [Google Scholar]