

Abstract
Histone deacetylases (HDACs) are targets for cancer therapy. Suberoylanilide hydroxamic acid (SAHA) is an HDAC inhibitor approved by the U.S. Food and Drug Administration for the treatment of cutaneous T-cell lymphoma. To obtain a better mechanistic understanding of the Sin3/HDAC complex in cancer, we extended its protein–protein interaction network and identified a mutually exclusive pair within the complex. We then assessed the effects of SAHA on the disruption of the complex network through six homologous baits. SAHA perturbs multiple protein interactions and therefore compromises the composition of large parts of the Sin3/HDAC network. A comparison of the effect of SAHA treatment on gene expression in breast cancer cells to a knockdown of the ING2 subunit indicated that a portion of the anticancer effects of SAHA may be attributed to the disruption of ING2's association with the complex. Our dynamic protein interaction network resource provides novel insights into the molecular mechanism of SAHA action and demonstrates the potential for drugs to rewire networks.
The identification of proteins that change in response to a drug perturbation can shed light on the molecular mechanisms of the drug and its potential use in therapies. Drugs often interact with a number of additional proteins beyond their primary targets (1–3). Therefore, drugs have effects on multiple pathways beyond altering the activity of a single protein. Two histone deacetylase (HDAC)1 inhibitors approved by the U.S. Food and Drug Administration, suberoylanilide hydroxamic acid (SAHA) and depsipeptide (Romidepsin), are used for the treatment of advanced and refractory cutaneous T-cell lymphoma in patients with progressive, persistent, or recurrent disease (4). SAHA has the permeability to cross the blood–brain barrier and cause biological responses in the mouse brain, making it a preferred candidate drug for testing in the central nervous system (5, 6). Additionally, HDAC inhibitors have been examined as potential therapeutics for cardiac conditions, arthritis, and malaria (7). Despite the successful use of SAHA in cancer treatments and the existing number of clinical trials in progress for other diseases, the critical disease-relevant pathways disrupted by SAHA are poorly understood (8). Here we characterized the global effects triggered by SAHA in the context of a Sin3/HDAC protein interaction network in order to provide insights into SAHA's molecular mechanism.
The human histone deacetylase Sin3/HDAC is a multiprotein complex well known for its role in diverse biological and cellular processes including transcription, chromatin structure, cell-cycle progression, genomic stability, and embryonic development (9–13), and it was most recently found to be implicated in suppressing cell migration (14). The human Sin3/HDAC complex consists of at least 17 subunits, of which HDAC1 and -2 constitute the major catalytic subunits (14, 15). Importantly, the anticancer drug SAHA targets HDAC1 and -2, and SAHA is known to bind to the catalytic sites of HDACs (16). However, more recent findings suggest that SAHA and HDAC inhibitors may have broader noncatalytic effects on HDAC complexes (15, 17). Furthermore, HDAC1 and HDAC2 are part of several complexes, as was recently demonstrated in an elegant protein interaction network analysis using the 11 human HDACs as baits (18).
Here we present a focused study on the Sin3a complex and describe a strategy to determine the effect of SAHA on an HDAC protein interaction network (supplemental Fig. S1). To begin, we purified this complex through multiple baits and identified the associated proteins with a subsequent mass-spectrometry-based multidimensional protein identification technology (MudPIT) analysis. This analysis revealed several new components associated with the subunits of the Sin3/HDAC complex. Furthermore, we determined that the network includes a pair of mutually exclusive homologous proteins. Next, in order to capture the global effect of SAHA on the Sin3/HDAC interactome, we selected six homologous subunits and quantified the degree of perturbation of the complex upon SAHA treatment. The most intriguing observation was that depending on the bait used, different subsets of SAHA-mediated effects on protein–protein interactions were observed. Instead of inhibiting a single protein, SAHA perturbs multiple protein interactions and therefore compromises the composition of large parts of the Sin3/HDAC protein interaction network. Gene expression analyses of triple negative breast cancer cells suggested that the HDAC inhibitor SAHA could down-regulate genes through the disruption of the noncatalytic subunit ING2, a protein considered an important potential anticancer drug target (19). This suggested that a portion of SAHA's mechanistic action can be explained by the disruption of ING2's interaction with the complex. Finally, we generated a Sin3/HDAC human disease network and a connectivity map that reflects the relationships among SAHA, proteins, and diseases within the Sin3/HDAC centered network.
EXPERIMENTAL PROCEDURES
Cell Lines and Culture
Full-length cDNAs encoding human BRMS1, BRMS1L, or ING2 were cloned into pcDNA5/FRT with a single N-terminal (BRMS1, ING2, ING1, FOXK1) or C-terminal (SAP30, SAP30L, BRMS1L, FAM60) FLAG tag. 293T cells stably expressing FLAG-tagged subunits of the Sin3 complex were made by using the Flp-In system (Invitrogen). MDA-MB-231 cells were obtained from the American Type Culture Collection. All cell lines were maintained in DMEM (Invitrogen) supplemented with 10% FBS, Pen/Strep, and Glutamax (Invitrogen) in a humidified atmosphere at 37 °C with 5% CO2. For experiments involving drug treatment, SAHA or DMSO was added directly to the culture media, and cells were collected at the indicated times as previously described (15).
Co-expression of BRMS1 and BRMS1L was performed by transfecting 293T cells stably expressing FLAG-BRMS1 with BRMS1L and, conversely, transiently transfecting BRMS1 into 293T cells stably expressing BRMS1L-FLAG. Sequences containing the ORFs of BRMS1 and BRMS1L flanked by SgfI and PmeI restriction sites were subcloned between the PacI and PmeI restriction sites in the pcDNA5/FRT vector (Invitrogen). Approximately 1 × 10⁷ of the 293T stably expressing FLAG-tagged BRMS1 and BRMS1L stable cell lines were transfected with 7.5 μg of plasmid DNA encoding BRMS1 and BRMS1L. Cells were harvested 48 h post-transfection and rinsed twice in ice-cold PBS. Cell pellets were frozen at −80 °C.
Purifications
293T whole cell extracts were made as previously described (15). Nuclear extracts were made according to Dignam et al.'s procedure (20). FLAG purifications from 293T cells were carried out overnight at 4 °C using anti-FLAG M2 resin (Sigma). FLAG beads were washed four times for 10 min each time with rotation at 4 °C. Sixty volumes of wash buffer to bead volume were used per wash with the following buffer: 10 mm HEPES, pH 7.5, 0.2% Triton X-100, 0.3 m NaCl, 10 mm KCl, and 1.5 mm MgCl2. After washing, proteins were eluted using 3× FLAG peptide (Sigma) diluted to a concentration of 0.2 mg/ml in a buffer containing 50 mm Tris, pH 7.5, 0.5% Nonidet P-40, and 0.3 m NaCl.
Cell pellets from co-expressing BRMS1 in a BRMS1L-FLAG stable cell line and BRMS1L in a FLAG-BRMS1 stable cell line were resuspended in 300 μl of ice-cold buffer containing 50 mm Tris·HCl (pH 7.5), 150 mm NaCl, 1% Triton® X-100, 0.1% sodium deoxycholate, 0.1 mm benzamidine HCl, 55 μm phenanthroline, 10 μm bestatin, 20 μm leupeptin, 5 μm pepstatin A, and 1 mm PMSF. We then homogenized lysates by passing the cells through a 26-gauge needle five times and centrifuged them at 21,000 × g for 30 min at 4 °C to remove insoluble material. Proteins were enriched using FLAG purification as previously described.
MudPIT Mass Spectrometry and Database Searching
Preparation of Peptide Mixtures
TCA-precipitated protein samples from ING2, ING1, SAP30, SAP30L, HDAC1, BRMS1, FAM60, FOXK1, and BRMS1L Flag-immunopurifications were solubilized in 30 μl of freshly made 0.1 m Tris-HCl, pH 8.5, 8 m urea, 5 mm Tris(2-carboxylethyl)-phosphine hydrochloride (Pierce). Portions of the ING2 ± SAHA, BRMS1 ± SAHA, and BRMS1-LIKE ± SAHA affinity purification datasets were described previously (15). After 30 min at room temperature, freshly made 0.5 m chloroacetamide (Sigma) was added to a final concentration of 10 mm, and the samples were left at room temperature for another 30 min in the dark. Endoproteinase Lys-C (Roche) was first added at an estimated 1:100 (wt/wt) enzyme-to-protein ratio for at least 6 h at 37 °C. Urea was then diluted to 2 m with 0.1 m Tris-HCl, pH 8.5; CaCl2 was added to 0.5 mm, and modified trypsin (Promega) (1:100 wt/wt) was added for over 12 h at 37 °C. All enzymatic digestions were quenched by formic acid added to 5%.
Data Acquisition
Each trypsin-digested sample was analyzed independently via MudPIT as described previously (21). Peptide mixtures were pressure-loaded onto a 100-μm fused-silica column pulled to a 5-μm tip using a P 2000 CO2 laser puller (Sutter Instruments, Novato, CA). The microcapillary columns were packed with 8 cm of 5-μm C18 reverse phase particles (Aqua, Phenomenex, Torrance, CA) followed by 3 cm of 5-μm strong cation exchange material (Partisphere SCX, Whatman) and 2 cm of reverse phase particles (22). Loaded microcapillaries were placed in line with LTQ ion trap mass spectrometers (Thermo Scientific, San Jose, CA) interfaced with quaternary Agilent 1100 quaternary pumps (Agilent Technologies, Palo Alto, CA). Overflow tubing was used to decrease the flow rate from 0.1 ml/min to about 200 to 300 nl/min. During the course of a fully automated chromatography, ten 120-min cycles of increasing salt concentrations followed by organic gradients slowly released peptides directly into the mass spectrometer (21). Three different elution buffers were used: 5% acetonitrile, 0.1% formic acid (Buffer A); 80% acetonitrile, 0.1% formic acid (Buffer B); and 0.5 m ammonium acetate, 5% acetonitrile, 0.1% formic acid (Buffer C). The last two chromatography steps consisted of a high salt wash with 100% Buffer C followed by the acetonitrile gradient (21). The application of a 2.5-kV distal voltage electrosprayed the eluting peptides directly into LTQ linear ion trap mass spectrometers equipped with a nano-LC electrospray ionization source. Each full MS scan (from 400 to 1600 m/z) was followed by five MS/MS events using data-dependent acquisition, where the first most intense ion was isolated and fragmented via collision-induced dissociation (at 35% collision energy), followed by the second to fifth most intense ions.
Data Analysis
RAW files were converted to ms2 format using RAWDistiller v. 1.0, an in-house-developed software. The ms2 files were subjected to database searching using SEQUEST (version 27 (rev. 9)) with no enzyme specificity considered (23). The mass tolerance for precursor ions was set at 3 amu, and the mass tolerance for fragment ions was 0 amu. MS/MS spectra were searched against a protein database consisting of 29,375 non-redundant human proteins (NCBI, released August 16, 2011) and 160 sequences for usual contaminants (keratins, proteolytic enzymes, etc.). In addition, to estimate false discovery rates, each non-redundant protein entry was randomized. The resulting “SHUFFLED” sequences were added to the database and searched at the same time as the “forward” sequences. To account for carboxamidomethylation by CAM, +57 Da was added statically to cysteine residues and +16 Da for oxidized methionine residues for all the searches, and no variable modifications were searched. Results from different runs were compared and merged using CONTRAST (24). Spectrum–peptide matches were retained only if peptides were at least seven amino acids long and fully tryptic. The DeltaCn had to be at least 0.08, with minimum XCorrs of 1.8 for singly, 2.0 for doubly, and 3.0 for triply charged spectra and a maximum Sp rank of 10. Finally, combining all runs, proteins had to be detected by at least two such peptides, or one peptide with two independent spectra. Proteins that were subsets of others were removed. Using these selection criteria, we obtained an average spectral false discovery rate for the 59 MudPIT runs of 0.76% ± 0.44%. The parsimony option in Contrast was used to remove proteins that were subsets of others. If proteins were identified by the same set of peptides (including at least one peptide unique to the set to distinguish between isoforms), they were grouped together; one representative accession number was used to describe the set.
Quantitative Proteomics
Quantitation was performed using label-free spectral counting. The number of spectra identified for each protein was used for calculating the distributed normalized spectral abundance factor (dNSAF) (25). Briefly, for a given protein j in a pulldown with i total proteins,
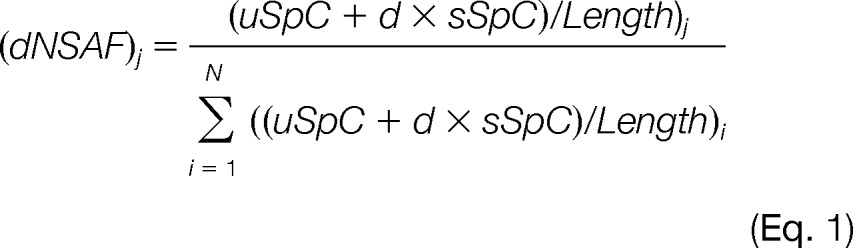 |
with d representing the distribution factor, which is equal to the number of unique spectral counts (uSpC) for a given protein j divided by the total uSpC from all n proteins with which protein j shares peptide(s). If the dNSAF value in the purification was less than the dNSAF in the negative control, the protein was considered nonspecific to that particular purification, and the dNSAF was replaced by 0; otherwise the dNSAF value remained unchanged. After removing the proteins shown to be nonspecific to all purifications, we applied an additional filtering criterion by considering only proteins present in at least half of the baits. These 33 proteins included all known subunits of the Sin3/HDAC complex and other additional proteins that were not previously characterized as subunits of the complex (Fig. 1A). NSAF v7 (an in-house-developed software) was used to create the final report on all non-redundant proteins detected across the different runs, estimate false discovery rates, and calculate their respective dNSAF values (25). Under these criteria the spectral false discovery rates ranged from 0.00% to 1.3% for all pulldowns. Supplemental Tables S1–S3 contain all the mass spectrometry data.
Fig. 1.

Defining the Sin3 complexes. A, heat map of the Sin3 complexes. Composition of the Sin3 complex as represented in a bait–prey matrix, where each column corresponds to a purification of a bait protein and each row corresponds to a prey protein; protein abundances are represented as average dNSAF values. The color intensity represents the protein abundance, with brightest yellow indicating the greatest abundance and decreasing intensity indicating decreased abundance. Black indicates that the protein was not detected in the particular purification. The protein BBX did not meet our criteria; however, because it is known to be related to the complex, and for clarity, we have included it in the figure. Unique peptides to both Sap130a and Sap130b were found in the study. Homologous pairs (BRMS1-BRMS1L, SAP30-SAP30L, and ING1-ING2) are represented in red boxes. B, protein abundance values of FOXK1 relative to the subunits of the Sin3 complex. C, Western blots showing that ING1 and ING2 may reside in separate Sin3/HDAC complexes. Silver stain analysis of the BRMS1-FLAG and BRMS1L-FLAG complexes purified from whole cell 293T extract. D, analysis of the average dNSAF observed for the three homologous pairs.
Impact of the Drug SAHA on the Sin3/HDAC-centered Network: Statistical Analyses
Our analysis starts with the observed spectral count data matrix X = [Xij].
To address the question of whether any differences were observable between the untreated and drug-treated samples, we calculated first the fold changes between the respective purifications using the z-statistics-based statistical framework Qspec (version 1.2.2) using the Web submission (26). The spectra counts and the length of each protein were used as input for the Qspec software. Generally, the model is based on a Poisson model with hierarchical Bayesian estimation as described (26).
The results obtained from the Qspec analysis correlated well (i.e. with a Pearson correlation between 0.6 and 0.8) with the results calculated from the dNSAF ratio between the SAHA drug and DMSO, defined as
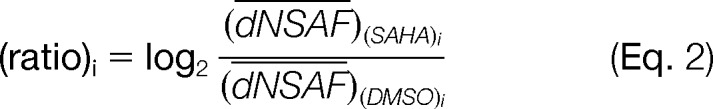 |
To further strengthen our conclusions, we applied another statistical test specific to spectral count data. For power law global error model analysis, dNSAF values were used as input for the Bioconductor package plgem in the R environment. A power law global error model was used to evaluate the goodness of the fit of the model to the data and to detect differentially abundant proteins (27). The power law global error model (27) is a global error model governed by power law, where the frequency of an event varies as a power of some attribute of that event. In mathematical terms, the model is described as
Thus,
The expected counts obtained from the generalized linear mixed effects model for treated and untreated samples together with the z-statistics were produced by the software and are reported in supplemental Table S4.
The Importance of a Multiple Bait Strategy
In order to determine how proteins group together after the drug treatment, we clustered the components of the Sin3/HDAC complex using the difference in dNSAF values between SAHA and DMSO treatment. For a protein i in the complex, the difference is calculated as
where negative values denote a strong effect on the complex upon SAHA treatment and positive values indicate a weaker or positive effect on the complex after the SAHA treatment.
Microarray
Cells were treated with 2 μm SAHA or an equal volume of DMSO for 30 h. ING2 expression was knocked down using siRNA #116981 (Ambion, Grand Island, NY) and Dharmafect 1 (Dharmacon, Lafayette, CO) RNA was collected 4 days post-transfection and purified using Trizol followed by an RNeasy clean-up column. ING2 expression was knocked down in human breast cancer cells (MDA-MB-231 cell line), and the resulting effect on gene expression was examined relative to a control using Affymetrix Human microarrays (HG-U133 Plus 2.0). Arrays were processed with the GeneChip Fluidics Station 450 and scanned with a GeneChip Scanner 3000 7G using standard protocols. Affymetrix CEL files were processed in the R statistical environment and normalized using RMA (28). The linear modeling package Limma (29) was used to derive gene expression coefficients and calculate p values. p values were adjusted for multiple hypothesis testing using the method of Benjamini and Hochberg. Supplemental Tables S5–S7 contain gene expression changes in ING2 knockdown cells and in SAHA treated cells and the overlap of gene expression changes between the treatments, respectively.
Real-time PCR
RNA was purified using TRIzol (Invitrogen), with subsequent DNase I digestion and clean-up through an RNeasy clean-up column (Qiagen, Valencia, CA). Alternatively, RNA was collected using TRIzol and then purified using the Direct-zol kit (Zymo Research, Irvine, CA). cDNAs were made using the GeneAmp kit (Applied Biosystems, Grand Island, NY) using random hexamers. Real-time PCR was performed using a Bio-Rad iCycler machine and SYBR green. Cycling conditions were as follows: 3 min at 95 °C; then 41 cycles of 10 s at 95 °C, 30 s at annealing temperature, and 30 s at 72 °C, followed by a melt curve.
RESULTS
Proteomics Analysis Reveals New Insights into Sin3 Composition
Eight known subunits (BRMS1, BRMS1L, ING2, ING1, SAP30, SAP30L, HDAC1, and FAM60A) of the Sin3/HDAC complex and an additional protein (FOXK1) previously linked to Sin3a (30, 31) were FLAG-tagged, stably expressed in 293T cells, and affinity purified. Purified complexes were analyzed via MudPIT (21), and dNSAF analysis was performed (25) (supplemental Tables S1 and S2). We performed at least three replicates for each of the bait proteins to generate a high-quality dataset. The number of spectra identified for each protein was used to calculate dNSAF values; this is an established spectral-counting-based approach in which shared peptides are distributed, data are normalized to the length of individual proteins, and data are normalized to the total intensity of a given MudPIT run (25). To eliminate nonspecific binders, we performed an additional 12 purifications from a control 293T cell line. A total of 45 runs were performed, which led to a total of 5149 identified proteins (supplemental Table S2). Based on the dNSAF values, we next extracted the nonspecific proteins as described previously (32). This resulted in a final list of 576 identified proteins (supplemental Table S2). To determine the set of the most tightly associated interactions, we applied an additional filtering criterion by only considering proteins present in at least half of the baits. These 33 proteins included all known subunits of the Sin3/HDAC complex and other additional proteins that were not previously characterized as subunits of the complex (Fig. 1A) (14).
This network contained two separate sub-networks (Fig. 1A). One sub-network comprised nine new interactions, among which C20orf4 had an unknown function. Another sub-network (Fig. 1A) consisted of two forkhead box transcription factors, forkhead box k1 (FOXK1) and forkhead box k2 (FOXK2); BAH domain and coiled-coil containing 1; and trinucleotide repeat containing 18. When we subsequently used FOXK1 as a bait, we also obtained reciprocal interactions, confirming all interactions with the various subunits of the Sin3/HDAC complex (Fig. 1). The result of this and our previous study (14) show a strong association between FOXK1 and the complex. It has been shown that FOXK1, FOXK2, and BAH domain and coiled-coil containing 1 associate with Sin3a in ES cells (31). FOXK1 was also found to interact with Sin3 using yeast two-hybrid and GST pulldown assays (30).
Sin3/HDAC contains seven homologous pairs: SAP30/SAP30-LIKE, ING1/ING2 (1-like), BRMS1/BRMS1-LIKE, RBBP4/RBBP7, HDAC1/HDAC2, SIN3A/SIN3B, and ARID4A/ARID4B. Our analyses revealed that proteins in the homologous pairs may exist in mutually exclusive pairs (Fig. 1). More explicitly, BRMS1 is absent in the BRMS1-LIKE purification, and vice versa. In the case of the SAP30/SAP30L pair, one SAP30 peptide is in one of the three SAP30L purifications, whereas for SAP30L two and five peptides are in two of the three SAP30 replicates (supplemental Table S2). In the case of ING1 and ING2, ING2 has two peptides in two of the ING1 replicates, and ING1 is not in any of the ING2 replicates (supplemental Table S2). These protein pairs suggest that multiple HDAC complexes may exist. Note that in our pulldowns, we have not noticed any specific homologs purifying with other proteins in the complex. This is likely because we get multiple complexes in each pulldown. Furthermore, this observation demonstrates the strength of our method, as it is capable of distinguishing between different forms of the complex. This phenomenon of mutual exclusivity has been observed in another major HDAC complex (NuRD) (33).
BRMS1 and BRMS1L Are Mutually Exclusive
Purification of the protein complexes revealed that BRMS1 and BRMS1L did not co-purify, suggesting the possibility that they are mutually exclusive. However, the overexpression of one of the proteins in a stable cell line could cause competition between the endogenous homolog and the overexpressed homolog, which could skew the results. To exclude this possibility, we co-expressed both homologs by transiently transfecting BRMS1L into a BRMS1-FLAG stable cell line, and conversely BRMS1 was transiently transfected into a BRMS1L-FLAG stable cell line. The FLAG-tagged BRMS1 and BRMS1L were then purified and analyzed via Western blotting (Fig. 2). Western blots using antibodies to BRMS1 and BRMS1L revealed that both proteins were overexpressed in the cell lysate; however, only the FLAG-tagged homolog was present in the elution (Fig. 2). In Fig. 2A, the results of transfecting BRMS1 into the BRMS1L-FLAG stable cell line are shown. In this experiment, BRMS1 was found in the cellular lysate but not in the elution of the affinity-purified BRSM1L-FLAG (left-hand panel, Fig. 2A), whereas BRMS1L was found in both the lysate and the elution (right-hand panel, Fig. 2A). In Fig. 2B, the results of transfecting BRMS1L into the FLAG-BRMS1 stable cell line are shown. In this experiment, BRMS1L was found in the cellular lysate but not in the elution of the affinity-purified FLAG-BRSM1 (right-hand panel, Fig. 2B), whereas BRMS1 was found in both the lysate and the elution (left-hand panel, Fig. 2B). It is important to note that these antibodies had cross-reactivity with other proteins in the samples, but the highest intensity bands at the appropriate molecular weight are the areas of the Western blots to focus on (Figs. 2A and 2B). After examining the Western blots, we proceeded to further characterize the co-purification of these two homologs via mass-spectrometry-based MudPIT (Figs. 2C and 2D, supplemental Table S2, p. 3). In agreement with the results described above, the BRMS1-FLAG purification did not contain BRMS1L (Fig. 2C), and the FLAG-BRMS1 purification did not contain BRMS1L (Fig. 2D), suggesting that BRMS1 and BRMS1L are indeed mutually exclusive in HEK293 cells.
Fig. 2.

BRMS1 and BRMS1L are mutually exclusive. A, B, 293T cells stably expressing BRMS1L-FLAG were transfected with BRMS1 (BRMS1Txf_ BRMS1L-FLAG), and 293T cells stably expressing FLAG-BRMS1 were transfected with BRMS1L (BRMS1LTxf_FLAG-BRMS1). Noticeable amounts of BRMS1 and BRMS1L were detected in the lysate as well as in the elution after proteins were enriched by FLAG affinity purification. The whole cell lysate and the FLAG elution were visualized in Western blots. Both homologous proteins were detected using anti-BMRS1 and anti-BRMS1L rabbit monoclonal (abcam-ab-134968) and polyclonal (abcam-ab155188) primary antibodies and IRDye™-800-labeled goat anti-rabbit IgG secondary antibodies (green). A Li-Cor Odyssey infrared imaging system was used to detect the fluorescently labeled secondary antibodies. It is important to note that these antibodies have cross-reactivity with other proteins in the samples, but the highest intensity bands at the appropriate molecular weight are the areas of the Western blots to focus on. C, D, analysis of the average dNSAF observed in the BRMS1 and BRMS1L purifications. Proteins purified from cells expressing BRMS1LTxf_FLAG-BRMS1 and BRMS1Txf_BRMS1L-FLAG were analyzed with MudPIT. The normalized dNSAF values of the Sin3/HDAC complex are shown for either BRMS1LTxf_FLAG-BRMS1 (C) or BRMS1Txf_BRMS1L-FLAG (D). Error bars show standard deviation.
Impact of the Drug SAHA on the Sin3/HDAC-centered Network
After assembling a detailed Sin3/HDAC protein interaction network, we addressed the question of how the network is perturbed upon SAHA treatment. We purified the Sin3/HDAC complex through six homologous subunits (BRMS1, BRMS1L, SAP30, SAP30L, ING1, and ING2) from SAHA-treated cells (hereinafter referred to as BAIT_SAHA), DMSO-treated cells, or untreated cells (no DMSO). The purifications were then subjected to quantitative proteomics analysis (supplemental Table S3). Overall, for all baits, the Pearson correlation coefficient between DMSO-treated cells and untreated cells was 0.84. For subsequent comparative analyses, DMSO and untreated cell results were pooled and then compared with those for SAHA-treated cells. Note that in the absence of SAHA, complexes were intact according to MudPIT and silver stain, and all complexes tested were active for HDAC activity (14, 15). Applying more stringent criteria, we kept only proteins that were present in at least two replicates in the control-treated baits and at least one time in a treated sample counterpart. To address the question of whether any differences were observed between the untreated and drug-treated samples, we calculated the fold changes between the respective purifications using a z-statistics-based statistical framework for the significance analysis of differential expression (26). To increase our confidence in identified protein abundance changes, we applied another statistical method, the power law global error model (27), which provided the signal-to-noise ratio and p value for each protein in our dataset. We considered a change significant if the z-statistics value of the respective protein was greater or less than ±1.5, had an average dNSAF-based ratio of greater than 2 or less than −2, and had a p value of less than 0.05 (supplemental Table S4).
We next constructed a differential interaction network illustrating all changes caused by the drug on each protein in the respective bait purifications. For visualization purposes, we included only 68 proteins with a z-statistics value of ±1.5, which also satisfied any of the other two criteria. These proteins are shown as nodes in our differential network (Fig. 3A). Strikingly, SAHA led to dynamic changes in the protein–protein interactions both within and outside of the Sin3/HDAC complex. Regarding changes outside the complex, we saw a change in abundance for a large number of proteins in the BRMS1_SAHA and ING1_SAHA purifications, but not for the BRMS1L_SAHA or ING2_SAHA purifications. This observation correlates with our earlier result showing that BRMS1 and BRMS1L are mutually exclusive pairs. Moreover, these additional interactions in the BRMS1 and ING1 networks included proteins without enzymatic function. We also observed that all components of a sub-network (i.e. FOXK1, FOXK2, BAHCC1, and TNRC18) in the wild-type analysis showed a strong depletion in the ING1_SAHA and ING2_SAHA purifications. The protein FAM60A, which just recently was discovered as a member of the Sin3/HDAC complex (9, 14), also showed a decrease in abundance in the ING2_SAHA purification.
Fig. 3.

SAHA-induced differential network analysis. A, the SAHA interaction network of Sin3/HDAC-centered complexes. The SAHA drug-interaction differential network was generated from six purifications (BRMS1, BRMS1L, SAP30, SAP30L, ING2, and ING1) from SAHA-treated cells. All Bait_SAHA (bait purification after SAHA treatment) proteins are depicted as hexagons, and all preys as circles. Edges are colored based on the fold change between treated and untreated samples using the z-score. Black lines correspond to interactions increasing in abundance (i.e. a z-score ≥ 1.5), and red lines represent interactions with decreasing abundance (i.e. a z-score ≤ −1.5) as shown in top left of A. The thickness of the lines corresponds to the degree of the effect caused by the SAHA treatment in the respective baits. The isoforms Sap130a and Sap130b were both included because unique peptides to each isoform were found in the study. B, hierarchical clustering was performed on the difference between dNSAF averages from Sin3 subunit purifications from SAHA-treated cells and untreated counterparts. Each column represents an individual purification, and each row represents a prey protein. Red color illustrates that SAHA treatment did not affect the complex, whereas gray color symbolizes a strong effect of SAHA on the Sin3 network. Through hierarchical clustering, subcomplexes were separated as illustrated on the right-hand side of the cluster.
The Importance of a Multiple Bait Strategy
Our strategy of using different subunits of the Sin3/HDAC complex as baits for the evaluation of the SAHA drug treatment facilitated the identification of differential effects on the network. In the ING1_SAHA and ING2_SAHA purifications, a strong reduction in binding was observed for the proteins SAP30, SAP30L, SAP130, and SDS3 (Fig. 3). In the SAP30_SAHA purification, the proteins ING1 and ING2 showed the largest reduction (Fig. 3). Our observations are further supported by data indicating that these proteins reside in distinct modules in the yeast Sin3 complex (34). As a result of this observation, we applied a differential clustering approach. Here we clustered all components of the complex together with the proteins detected in the first sub-network using differences in dNSAF values between untreated and SAHA-treated cells. The clustering result clearly separated the proteins into different groups (Fig. 3B). All proteins that formed homologous pairs were clustered in close proximity to each other: ARID4A/ARID4B in cluster 1, SAP30/SAP30-LIKE in cluster 2, the module HDAC1/HDAC2/RBBP4/RBBP7/SIN3A/SIN3B in cluster 3, and ING1/ING2 with BRMS1/BRMS1-LIKE in cluster 4 (Fig. 3B). Interestingly, some of the modules were also identified in a deletion study characterizing the homologous yeast complex (34). This clustering method therefore revealed that some of the identified modules (SAP30/SDS3, SIN3/HDAC1 (RPD3 in yeast), ING1/ING2 (PHO23 in yeast)) were conserved between the human and the yeast Sin3 complex. This result accentuates the differential effect of SAHA treatment on these protein pairs. In agreement with a previous study (15), ING2 had the strongest reduction in the baits purified from SAHA-treated cells (Fig. 3). In BRMS1_SAHA, BRMS1L_SAHA, and SAP30_SAHA, the interaction with ING2 was greatly reduced, whereas in SAP30L_SAHA this interaction was only mildly decreased (Fig. 3).
These results support the idea that ING2 is a critical component of the complex through which the HDAC inhibitor SAHA acts on the network. The mechanism of disassociation of ING2 from the complex was elucidated previously in work that showed that SAHA disrupts the binding of the Sin3 complex to the p21 promoter through a disassociation of ING2 (15) and that p21 plays a key role in HDAC1 function and inhibition (35, 36). Consistent with prior studies (15, 37), interactions of HDAC1 or HDAC2 with the core complex were not largely affected, an observation that was independent of the bait used. SAHA also had a substantial effect on proteins outside of the complex. Our results suggest that SAHA may exert its function on the Sin3/HDAC network not only by inhibiting its enzymatic activity, but also by severely compromising network integrity. This differential effect on protein interaction was only revealed through the use of multiple baits for exploring the drug action.
Transcriptional Profile Following SAHA Treatment and ING2 Knockdown
HDAC inhibitors have been shown to preferentially induce cell cycle arrest, differentiation, and/or apoptosis in cancer cells over noncancerous cells (38). Because ING2 was the core complex subunit most affected by drug treatment, we aimed to explore whether the disruption of this subunit was important for any of the SAHA-mediated cancer-related changes in gene expression. We chose to knock down ING2 in MDA-MB-231 cells to address its effect on gene expression and compare these results with those for SAHA-treated MDA-MB-231 cells. We used microarray analysis to identify the degree of overlap between the ING2- and SAHA-mediated changes in gene expression (supplemental Tables S5 and S6). We chose this triple negative breast cancer cell line because it is one in which HDACi has been shown to be particularly effective in causing cell cycle arrest (at G2) (39, 40), and because of the potential clinical relevance. Surprisingly, of the top 300 genes that were differentially expressed upon ING2 knockdown, 99% were down-regulated (Fig. 4). This was unexpected; it is believed that ING2 acts as a repressor by recruiting the Sin3/HDAC complex to its chromosomal targets, and therefore an up-regulation of several target genes would have been expected (41). However, our results suggested that in the absence of ING2, many genes are repressed. As expected, SAHA altered the expression of a much larger set of genes than disruption of ING2 alone (Fig. 4A). However, we identified 295 genes that exhibited down-regulation in both SAHA-treated and ING2 knockdown cells (supplemental Table S7).
Fig. 4.

SAHA treatment and ING2 knockdown gene expression changes. A, decreased expression of ING2 in human breast cancer cells and the resulting effect on gene expression relative to a control as examined using Affymetrix Human microarrays (HG-U133 Plus 2.0). The y-axis indicates the ratio expression as log2(ING2 knockdown/control), and the x-axis represents the combined intensity of the array measurements for each sample, ½ × (log2(ing2) + log2(wt)). The top 300 genes are highlighted in color. Surprisingly, of the top 300 genes that were differentially expressed, 99% were down-regulated. B, Western blots from ING2 knockdown (RNAi) experiments in MDA-MB-231 breast cancer cells using antibodies against β-tubulin or ING2. C, changes in gene expression in a human breast cancer cell line upon treatment with the histone deacetylase inhibitor SAHA. Breast cancer cells were treated with 2 μm SAHA (HDAC inhibitor) for 30 h. The y-axis indicates the gene expression ratio between treated and untreated cells as log2(SAHA/DMSO), and the x-axis represents the combined intensity of the array measurements for each sample as ½ × (log2(SAHA) + log2(DMSO)). The top 300 up- or down-regulated genes are highlighted in color. D, real-time PCR was performed to quantify CDC2 transcript levels in ING2 knockdown MDA-MB-231 cells. Cells were day 3 post-transfected with control siRNAs or siRNAs against ING2. Real-time PCR was performed using primers to ING2 and GAPDH. Bars represent the average of triplicate real-time PCR reactions. Error bars represent ±1 average deviation. In addition, real-time PCR was performed in cells treated with 1, 2, and 4 μm SAHA or DMSO for 30 h.
We next classified these commonly down-regulated genes in different biological classes using the DAVID annotation tool (supplemental Table S7 and supplemental Fig. S2). Our analysis revealed that both SAHA and a reduction in ING2 levels largely modulate the expression of genes implicated in the cell cycle. Additionally, significant changes were observed for genes involved in chromatin organization, apoptosis, and RNA processing. Our results are consistent with other gene expression studies on SAHA (42, 43).
The down-regulated genes in the cell cycle category included several genes required for the G1/S transition, including cyclins (CCNB1, CCNA2, and CCNE2) as well as G2/M phase regulators (CDC2, CHECK1, and CDC25) (supplemental Table S7). Our data therefore strongly suggest that SAHA exerts its inhibitory function on the cell cycle in cancer cells by compromising the function of ING2 as well as by inhibiting histone deacetylase enzymatically. To confirm that loss of ING2 did lead to gene repression, we validated some target genes with real-time PCR. We chose to focus on CDC2 because it is a master regulator of G2/M phase cell cycle progression and its protein levels are known to be reduced by HDAC inhibitors in some cell lines (44). We found that CDC2 was consistently down-regulated in ING2 knockdown cells and repressed by SAHA treatment (Fig. 4D). Additional genes decreased in the ING2 knockdown and SAHA-treated cells confirmed by real-time PCR include the cohesion subunits SCC2 and SCC3. HDACi has been previously shown to affect sister chromatid separation (45). These results suggest that a portion of the overall SAHA-induced gene expression changes are mediated via disruption of ING2 association with the Sin3/HDAC complex.
Disease-associated Genes and Proteins of the Sin3/HDAC Network
Because our final aim was to gain a better understanding of the action of SAHA, we categorized the proteins with significant expression changes upon SAHA treatment into different diseases (supplemental Fig. S2). The disorder genes and diseases were obtained from the Online Mendelian Inheritance in Men database and the genetic association database (46). Out of 140 proteins with significant changes in abundance upon SAHA treatment, 47 proteins were, according to the genetic association database, found with high confidence to be involved in a disease (supplemental Table S8).
Using the data from the genetic association database, combined with only genes significantly changed upon SAHA treatment, we first constructed a connectivity map (Fig. 5A) illustrating the relationship between genes/proteins and their related diseases. The weights of the connectivity map represent the number of a disease subtype. For example, a gene/protein could be implicated in two different types of cancer (both breast and prostate cancer), leading to a connectivity with a weight of 2 in the cancer disease class. Based upon this connectivity map, we constructed a stringent disease interaction map of the Sin3/HDAC-centered network, in which two classes were connected if at least two proteins were associated with both diseases (Fig. 5B). We chose this criterion in order to avoid cases where a few proteins involved in multiple diseases give rise to a highly connected network. The resulting network revealed that cancer and neurological disease (linked to k = 15 other diseases) were more predominant in our dataset; in contrast, age and hematological disease were underrepresented (Fig. 5B). The prominence of cancer and neurological disease in our network was encouraging, as HDAC inhibitors are promising potential therapies for cancers and neurodegenerative diseases (5). Thus, the proteins that show significant changes upon SAHA treatment and that are known to be involved in specific diseases could be candidates for potential therapeutic targets.
Fig. 5.

SAHA gene and disease network linkages. A, protein–disease connectivity map. Each column represents a disease, and each row represents a protein involved in one of the diseases. The numbers inside the matrix correspond to the number of disease subtype (for example, multiple types of cancer). Light orange corresponds to the group of proteins that have a connectivity weight of 1 or 2, and dark red corresponds to the group of proteins involved in multiple diseases with many subtypes and thereby having larger weight numbers. B, Sin3 disease network. Each node represents a disease, and two diseases are connected to each other if they share at least two proteins that are associated with both diseases. The size of the circle is proportional to the total number of links.
DISCUSSION
In this study, we systematically analyzed the Sin3/HDAC-centered protein interaction network using affinity purification, label-free quantitative proteomics, and differential protein interaction network analysis. The human Sin3/HDAC network consists of several different sub-networks, of which one was more tightly associated with the Sin3/HDAC core; this subsequently was verified via reciprocal purifications using a newly identified interaction partner, FOXK1. We found that the BRSM1 and BRMS1L subunits of Sin3 complexes behaved as mutually exclusive, suggesting that the Sin3 complex may exist in multiple alternative forms. We sought to determine how the HDAC inhibitor SAHA affects the Sin3/HDAC network. HDAC inhibitors block the activity of HDACs by chelating a zinc molecule in their catalytic sites (16). Our analysis indicates that SAHA does not uniformly compromise the integrity of the Sin3/HDAC protein interaction network. Instead, SAHA leads to a dynamic remodeling of the network and has differential effects on protein interactions. The most drastic effect of SAHA was on ING2, which was largely reduced in the complex upon SAHA treatment (15). Intriguingly, our microarray experiments suggest that part of the anticancer effect of SAHA is conferred through the disruption of ING2. Finally, we constructed a disease network of the Sin3/HDAC-centered protein interaction network, which revealed proteins that might be relevant to the functions of SAHA in other diseases.
Our findings illustrate the importance of using an unbiased approach in characterizing the action of pharmacological drugs and the effects of a drug on a complex through multiple baits. A recent HDAC-centered protein interaction network in T cells demonstrates the large number of diverse complexes that contain HDACs (18). This emphasizes the importance of devising strategies to dissect the cellular and network effects of HDAC inhibitors on each HDAC-containing complex. By analyzing the effect of SAHA on homologous pairs of complexes, we were able to discern the extent of the effect on the network. Most of our observations would have been missed if we had concentrated on a single bait for the affinity purification MS experiments. Next, mapping of disease-related proteins altered in our analysis onto disease types supports alternative uses for SAHA. Finally, our dynamic network analysis could be used for pinpointing single elements such as ING2 as targets for more precise therapeutic intervention.
Supplementary Material
Footnotes
Author contributions: M.E.S., K.T.S., B.D.G., J.M.G., C.S., L.F., J.L.W., and M.P.W. designed research; M.E.S., K.T.S., B.D.G., J.M.G., A.S., R.E., A.P., and C.S. performed research; M.E.S., K.T.S., and B.D.G. contributed new reagents or analytic tools; M.E.S., K.T.S., B.D.G., J.M.G., A.S., R.E., A.P., C.S., L.F., and M.P.W. analyzed data; M.E.S., K.T.S., J.M.G., and M.P.W. wrote the paper.
* This work was supported by the Stowers Institute for Medical Research. This work was supported in part by NIGMS Grant No. R37 GM047867 (J.L.W.) and NCI Fellowship 5F32CA130468 (K.T.S.). K.T.S. was the American Cancer Society's 2008 Cattle Baron's Ball of Lubbock Postdoctoral Fellow (#PF-09-109-01-GMC).
 This article contains supplemental material.
1 The abbreviations used are:
- HDAC
- histone deacetylase
- dNSAF
- distributed normalized spectral abundance factor
- DMSO
- dimethyl sulfoxide
- FOXK
- forkhead box k
- MudPIT
- multidimensional protein identification technology
- SAHA
- suberoylanilide hydroxamic acid.
REFERENCES
- 1. Brouwers L., Iskar M., Zeller G., van Noort V., Bork P. (2011) Network neighbors of drug targets contribute to drug side-effect similarity. PLoS One 6, e22187. [DOI] [PMC free article] [PubMed] [Google Scholar]
- 2. Paolini G. V., Shapland R. H., van Hoorn W. P., Mason J. S., Hopkins A. L. (2006) Global mapping of pharmacological space. Nat. Biotechnol. 24, 805–815 [DOI] [PubMed] [Google Scholar]
- 3. Rix U., Superti-Furga G. (2009) Target profiling of small molecules by chemical proteomics. Nat. Chem. Biol. 5, 616–624 [DOI] [PubMed] [Google Scholar]
- 4. Ververis K., Hiong A., Karagiannis T. C., Licciardi P. V. (2013) Histone deacetylase inhibitors (HDACIs): multitargeted anticancer agents. Biologics 7, 47–60 [DOI] [PMC free article] [PubMed] [Google Scholar]
- 5. Hashioka S., Klegeris A., McGeer P. L. (2012) The histone deacetylase inhibitor suberoylanilide hydroxamic acid attenuates human astrocyte neurotoxicity induced by interferon-gamma. J. Neuroinflamm. 9, 113. [DOI] [PMC free article] [PubMed] [Google Scholar]
- 6. Hockly E., Richon V. M., Woodman B., Smith D. L., Zhou X., Rosa E., Sathasivam K., Ghazi-Noori S., Mahal A., Lowden P. A., Steffan J. S., Marsh J. L., Thompson L. M., Lewis C. M., Marks P. A., Bates G. P. (2003) Suberoylanilide hydroxamic acid, a histone deacetylase inhibitor, ameliorates motor deficits in a mouse model of Huntington's disease. Proc. Natl. Acad. Sci. U.S.A. 100, 2041–2046 [DOI] [PMC free article] [PubMed] [Google Scholar]
- 7. Chuang D. M., Leng Y., Marinova Z., Kim H. J., Chiu C. T. (2009) Multiple roles of HDAC inhibition in neurodegenerative conditions. Trends Neurosci. 32, 591–601 [DOI] [PMC free article] [PubMed] [Google Scholar]
- 8. New M., Olzscha H., La Thangue N. B. (2012) HDAC inhibitor-based therapies: can we interpret the code? Mol. Oncol. 6, 637–656 [DOI] [PMC free article] [PubMed] [Google Scholar]
- 9. Munoz I. M., MacArtney T., Sanchez-Pulido L., Ponting C. P., Rocha S., Rouse J. (2012) Family with sequence similarity 60A (FAM60A) protein is a cell cycle-fluctuating regulator of the SIN3-HDAC1 histone deacetylase complex. J. Biol. Chem. 287, 32346–32353 [DOI] [PMC free article] [PubMed] [Google Scholar]
- 10. Ludwig S., Klitzsch A., Baniahmad A. (2011) The ING tumor suppressors in cellular senescence and chromatin. Cell Biosci. 1, 25. [DOI] [PMC free article] [PubMed] [Google Scholar]
- 11. Ayer D. E., Lawrence Q. A., Eisenman R. N. (1995) Mad-Max transcriptional repression is mediated by ternary complex formation with mammalian homologs of yeast repressor Sin3. Cell 80, 767–776 [DOI] [PubMed] [Google Scholar]
- 12. Sommer A., Hilfenhaus S., Menkel A., Kremmer E., Seiser C., Loidl P., Luscher B. (1997) Cell growth inhibition by the Mad/Max complex through recruitment of histone deacetylase activity. Curr. Biol. 7, 357–365 [DOI] [PubMed] [Google Scholar]
- 13. Wotton D., Knoepfler P. S., Laherty C. D., Eisenman R. N., Massague J. (2001) The Smad transcriptional corepressor TGIF recruits mSin3. Cell Growth Diff. 12, 457–463 [PubMed] [Google Scholar]
- 14. Smith K. T., Sardiu M. E., Martin-Brown S. A., Seidel C., Mushegian A., Egidy R., Florens L., Washburn M. P., Workman J. L. (2012) Human family with sequence similarity 60 member A (FAM60A) protein: a new subunit of the Sin3 deacetylase complex. Mol. Cell. Proteomics 11, 1815–1828 [DOI] [PMC free article] [PubMed] [Google Scholar]
- 15. Smith K. T., Martin-Brown S. A., Florens L., Washburn M. P., Workman J. L. (2010) Deacetylase inhibitors dissociate the histone-targeting ING2 subunit from the Sin3 complex. Chem. Biol. 17, 65–74 [DOI] [PMC free article] [PubMed] [Google Scholar]
- 16. Finnin M. S., Donigian J. R., Cohen A., Richon V. M., Rifkind R. A., Marks P. A., Breslow R., Pavletich N. P. (1999) Structures of a histone deacetylase homologue bound to the TSA and SAHA inhibitors. Nature 401, 188–193 [DOI] [PubMed] [Google Scholar]
- 17. Bantscheff M., Hopf C., Savitski M. M., Dittmann A., Grandi P., Michon A. M., Schlegl J., Abraham Y., Becher I., Bergamini G., Boesche M., Delling M., Dumpelfeld B., Eberhard D., Huthmacher C., Mathieson T., Poeckel D., Reader V., Strunk K., Sweetman G., Kruse U., Neubauer G., Ramsden N. G., Drewes G. (2011) Chemoproteomics profiling of HDAC inhibitors reveals selective targeting of HDAC complexes. Nat. Biotechnol. 29, 255–265 [DOI] [PubMed] [Google Scholar]
- 18. Joshi P., Greco T. M., Guise A. J., Luo Y., Yu F., Nesvizhskii A. I., Cristea I. M. (2013) The functional interactome landscape of the human histone deacetylase family. Mol. Syst. Biol. 9, 672. [DOI] [PMC free article] [PubMed] [Google Scholar]
- 19. Unoki M., Kumamoto K., Harris C. C. (2009) ING proteins as potential anticancer drug targets. Curr. Drug Targets 10, 442–454 [DOI] [PMC free article] [PubMed] [Google Scholar]
- 20. Dignam J. D., Martin P. L., Shastry B. S., Roeder R. G. (1983) Eukaryotic gene transcription with purified components. In: Methods in Enzymology (Wu R., Grossman L., Moldave K., eds), pp. 582–598, Academic Press, New York: [DOI] [PubMed] [Google Scholar]
- 21. Swanson S. K., Florens L., Washburn M. P. (2009) Generation and analysis of multidimensional protein identification technology datasets. Methods Mol. Biol. 492, 1–20 [DOI] [PubMed] [Google Scholar]
- 22. McDonald W. H., Ohi R., Miyamoto D. T., Mitchison T. J., Yates J. R., 3rd (2002) Comparison of three directly coupled HPLC MS/MS strategies for identification of proteins from complex mixtures: single-dimension LC-MS/MS, 2-phase MudPIT, and 3-phase MudPIT. Int. J. Mass Spectrom. 219, 245–251 [Google Scholar]
- 23. Eng J. K., McCormack A. L., Yates J. R., 3rd (1994) An approach to correlate tandem mass spectral data of peptides with amino acid sequences in a protein database. J. Am. Soc. Mass Spectrom. 5, 976–989 [DOI] [PubMed] [Google Scholar]
- 24. Tabb D. L., McDonald W. H., Yates J. R., 3rd (2002) DTASelect and Contrast: tools for assembling and comparing protein identifications from shotgun proteomics. J. Proteome Res. 1, 21–26 [DOI] [PMC free article] [PubMed] [Google Scholar]
- 25. Zhang Y., Wen Z., Washburn M. P., Florens L. (2010) Refinements to label free proteome quantitation: how to deal with peptides shared by multiple proteins. Anal. Chem. 82, 2272–2281 [DOI] [PubMed] [Google Scholar]
- 26. Choi H., Fermin D., Nesvizhskii A. I. (2008) Significance analysis of spectral count data in label-free shotgun proteomics. Mol. Cell. Proteomics 7, 2373–2385 [DOI] [PMC free article] [PubMed] [Google Scholar]
- 27. Pavelka N., Fournier M. L., Swanson S. K., Pelizzola M., Ricciardi-Castagnoli P., Florens L., Washburn M. P. (2008) Statistical similarities between transcriptomics and quantitative shotgun proteomics data. Mol. Cell. Proteomics 7, 631–644 [DOI] [PubMed] [Google Scholar]
- 28. Irizarry R. A., Hobbs B., Collin F., Beazer-Barclay Y. D., Antonellis K. J., Scherf U., Speed T. P. (2003) Exploration, normalization, and summaries of high density oligonucleotide array probe level data. Biostatistics 4, 249–264 [DOI] [PubMed] [Google Scholar]
- 29. Smyth G. K. (2004) Linear models and empirical Bayes methods for assessing differential expression in microarray experiments. Stat. Applicat. Genet. Mol. Biol. 3, Article3 [DOI] [PubMed] [Google Scholar]
- 30. Shi X., Garry D. J. (2012) Sin3 interacts with Foxk1 and regulates myogenic progenitors. Mol. Cell. Biochem. 366, 251–258 [DOI] [PMC free article] [PubMed] [Google Scholar]
- 31. McDonel P., Demmers J., Tan D. W., Watt F., Hendrich B. D. (2012) Sin3a is essential for the genome integrity and viability of pluripotent cells. Dev. Biol. 363, 62–73 [DOI] [PMC free article] [PubMed] [Google Scholar]
- 32. Mosley A. L., Sardiu M. E., Pattenden S. G., Workman J. L., Florens L., Washburn M. P. (2011) Highly reproducible label free quantitative proteomic analysis of RNA polymerase complexes. Mol. Cell. Proteomics 10, M110.000687. [DOI] [PMC free article] [PubMed] [Google Scholar]
- 33. Le Guezennec X., Vermeulen M., Brinkman A. B., Hoeijmakers W. A., Cohen A., Lasonder E., Stunnenberg H. G. (2006) MBD2/NuRD and MBD3/NuRD, two distinct complexes with different biochemical and functional properties. Mol. Cell. Biol. 26, 843–851 [DOI] [PMC free article] [PubMed] [Google Scholar]
- 34. Sardiu M. E., Gilmore J. M., Carrozza M. J., Li B., Workman J. L., Florens L., Washburn M. P. (2009) Determining protein complex connectivity using a probabilistic deletion network derived from quantitative proteomics. PLoS One 4, e7310. [DOI] [PMC free article] [PubMed] [Google Scholar]
- 35. Simboeck E., Sawicka A., Zupkovitz G., Senese S., Winter S., Dequiedt F., Ogris E., Di Croce L., Chiocca S., Seiser C. (2010) A phosphorylation switch regulates the transcriptional activation of cell cycle regulator p21 by histone deacetylase inhibitors. J. Biol. Chem. 285, 41062–41073 [DOI] [PMC free article] [PubMed] [Google Scholar]
- 36. Zupkovitz G., Grausenburger R., Brunmeir R., Senese S., Tischler J., Jurkin J., Rembold M., Meunier D., Egger G., Lagger S., Chiocca S., Propst F., Weitzer G., Seiser C. (2010) The cyclin-dependent kinase inhibitor p21 is a crucial target for histone deacetylase 1 as a regulator of cellular proliferation. Mol. Cell. Biol. 30, 1171–1181 [DOI] [PMC free article] [PubMed] [Google Scholar]
- 37. Sekhavat A., Sun J. M., Davie J. R. (2007) Competitive inhibition of histone deacetylase activity by trichostatin A and butyrate. Biochem. Cell Biol. 85, 751–758 [DOI] [PubMed] [Google Scholar]
- 38. Miller C. P., Singh M. M., Rivera-Del Valle N., Manton C. A., Chandra J. (2011) Therapeutic strategies to enhance the anticancer efficacy of histone deacetylase inhibitors. J. Biomed. Biotechnol. 2011, 514261. [DOI] [PMC free article] [PubMed] [Google Scholar]
- 39. Librizzi M., Longo A., Chiarelli R., Amin J., Spencer J., Luparello C. (2012) Cytotoxic effects of Jay Amin hydroxamic acid (JAHA), a ferrocene-based class I histone deacetylase inhibitor, on triple-negative MDA-MB231 breast cancer cells. Chem. Res. Toxicology 25, 2608–2616 [DOI] [PubMed] [Google Scholar]
- 40. Tate C. R., Rhodes L. V., Segar H. C., Driver J. L., Pounder F. N., Burow M. E., Collins-Burow B. M. (2012) Targeting triple-negative breast cancer cells with the histone deacetylase inhibitor panobinostat. Breast Cancer Res. 14, R79. [DOI] [PMC free article] [PubMed] [Google Scholar]
- 41. Shi X., Hong T., Walter K. L., Ewalt M., Michishita E., Hung T., Carney D., Pena P., Lan F., Kaadige M. R., Lacoste N., Cayrou C., Davrazou F., Saha A., Cairns B. R., Ayer D. E., Kutateladze T. G., Shi Y., Cote J., Chua K. F., Gozani O. (2006) ING2 PHD domain links histone H3 lysine 4 methylation to active gene repression. Nature 442, 96–99 [DOI] [PMC free article] [PubMed] [Google Scholar]
- 42. Ruefli A. A., Ausserlechner M. J., Bernhard D., Sutton V. R., Tainton K. M., Kofler R., Smyth M. J., Johnstone R. W. (2001) The histone deacetylase inhibitor and chemotherapeutic agent suberoylanilide hydroxamic acid (SAHA) induces a cell-death pathway characterized by cleavage of Bid and production of reactive oxygen species. Proc. Natl. Acad. Sci. U.S.A. 98, 10833–10838 [DOI] [PMC free article] [PubMed] [Google Scholar]
- 43. Wozniak M. B., Villuendas R., Bischoff J. R., Aparicio C. B., Martinez Leal J. F., de La Cueva P., Rodriguez M. E., Herreros B., Martin-Perez D., Longo M. I., Herrera M., Piris M. A., Ortiz-Romero P. L. (2010) Vorinostat interferes with the signaling transduction pathway of T-cell receptor and synergizes with phosphoinositide-3 kinase inhibitors in cutaneous T-cell lymphoma. Haematologica 95, 613–621 [DOI] [PMC free article] [PubMed] [Google Scholar]
- 44. Brazelle W., Kreahling J. M., Gemmer J., Ma Y., Cress W. D., Haura E., Altiok S. (2010) Histone deacetylase inhibitors downregulate checkpoint kinase 1 expression to induce cell death in non-small cell lung cancer cells. PLoS One 5, e14335. [DOI] [PMC free article] [PubMed] [Google Scholar]
- 45. Magnaghi-Jaulin L., Eot-Houllier G., Fulcrand G., Jaulin C. (2007) Histone deacetylase inhibitors induce premature sister chromatid separation and override the mitotic spindle assembly checkpoint. Cancer Res. 67, 6360–6367 [DOI] [PubMed] [Google Scholar]
- 46. Zhang Y., De S., Garner J. R., Smith K., Wang S. A., Becker K. G. (2010) Systematic analysis, comparison, and integration of disease based human genetic association data and mouse genetic phenotypic information. BMC Med. Genomics 3, 1. [DOI] [PMC free article] [PubMed] [Google Scholar]
Associated Data
This section collects any data citations, data availability statements, or supplementary materials included in this article.