

Abstract
Aim
Coronary artery calcification (CAC), as a sign of atherosclerosis, can be detected and progression quantified using computed tomography (CT). We develop a tool for predicting CAC progression.
Methods and results
In 3481 participants (45–74 years, 53.1% women) CAC percentiles at baseline (CACb) and after five years (CAC5y) were evaluated, demonstrating progression along gender-specific percentiles, which showed exponentially shaped age-dependence. Using quantile regression on the log-scale (log(CACb+1)) we developed a tool to individually predict CAC5y, and compared to observed CAC5y. The difference between observed and predicted CAC5y (log-scale, mean±SD) was 0.08±1.11 and 0.06±1.29 in men and women. Agreement reached a kappa-value of 0.746 (95% confidence interval: 0.732–0.760) and concordance correlation (log-scale) of 0.886 (0.879–0.893). Explained variance of observed by predicted log(CAC5y+1) was 80.1% and 72.0% in men and women, and 81.0 and 73.6% including baseline risk factors. Evaluating the tool in 1940 individuals with CACb>0 and CACb<400 at baseline, of whom 242 (12.5%) developed CAC5y>400, yielded a sensitivity of 59.5%, specificity 96.1%, (+) and (−) predictive values of 68.3% and 94.3%. A pre-defined acceptance range around predicted CAC5y contained 68.1% of observed CAC5y; only 20% were expected by chance. Age, blood pressure, lipid-lowering medication, diabetes, and smoking contributed to progression above the acceptance range in men and, excepting age, in women.
Conclusion
CAC nearly inevitably progresses with limited influence of cardiovascular risk factors. This allowed the development of a mathematical tool for prediction of individual CAC progression, enabling anticipation of the age when CAC thresholds of high risk are reached.
Keywords: Coronary artery calcification, Progression of atherosclerosis, CT, Imaging, Heinz Nixdorf Recall study, Epidemiology
See page 2934 for the editorial comment on this article (doi:10.1093/eurheartj/ehu377)
Introduction
Coronary atherosclerotic lesions often contain calcified components, which can be detected using computed tomography (CT) and quantified by the Agatston method.1 Longitudinal assessment of coronary artery calcium (CAC) burden allows the quantification of progression of coronary artery disease.2 An annual score increase >15% is associated with an enhanced risk of myocardial infarction,3,4 and a higher CAC burden carries a greater risk for future coronary heart disease (CHD) events and all-cause mortality.5
While CAC is associated with many cardiovascular risk factors, overall explanation of variance of CAC by risk factors is limited. Major risk factors such as low-density lipoprotein cholesterol (LDL-C) and hypertension showed only weak associations with CAC, explaining a variance of <5% for a single risk factor and <25% for established risk factors.6,7 Also risk modifying medical therapy, known to reduce risk for CV events,8 showed no reduction or attenuation of CAC progression.9–12
Coronary artery calcification scores in an European unselected population were similar to an American cohort despite differences in a risk factor profile,13 subsequently confirmed for the comparison with the multi-ethnic study of atherosclerosis (MESA).14 This study, however, showed that the prevalence and amount of CAC are heavily influenced by ethnicity in addition to age and gender. Thus, genetic factors seem to influence CAC and even CAC progression beyond what is captured by risk factors including a family history of CHD.15 Nevertheless, Leopold16 pointed out recently that new experimental studies suggest that vascular calcification is not inevitable and can be ameliorated. We have previously demonstrated that the rate of CAC progression at a time is proportional to pre-existing CAC.17 We thought, that, if this mechanism and heritable influences are the major determinants of CAC progression combined with a minor influence of the risk factor profile, than it should be possible to predict the progression of CAC based on a single CAC measurement. Therefore, the aim of this study was to measure the progression of CAC with the same CT technology over a time period of 5 years and derive a new mathematical tool for prediction of CAC progression.
Methods
Study participants
Between December 2000 and August 2003, the Heinz Nixdorf Recall (HNR) study recruited a total of 4814 Caucasians (age 45–75 years) from the three cities in the Ruhr area, Germany.18 Subjects with prior coronary artery disease (coronary artery bypass surgery and/or interventional revascularization procedures and history of prior myocardial infarction) were excluded. In 4275 (95.3%) of 4487 participants (2027 men and 2248 women) electron beam CT was performed at baseline. Individuals were followed with a second CT after a mean of 5.1 ± 0.3 years (4.2–7.5 years) scans. A total of 3481 participants (53% women) had complete CAC data at baseline (CACb) and at follow-up (CAC5y); 156 died before the 5-year follow-up, 47 had non -fatal myocardial infarctions, 107 coronary revascularizations, 407 cancelled , 28 had missing risk factors, 12 were out of the age range. All the participants provided written informed consent and the study had been approved by the ethical committee at the University Clinic Essen, Germany. The study was certified and recertified according to DIN EN ISO 9001:2000/2008.
Computed tomography
Computed tomography scans were performed with a C-100 and C-150 scanner (GE, Imatron, South San Francisco, CA, USA) in two radiology institution (D.G. and R.S.) at baseline.13 The 5-year follow-up CT was performed at the Radiology Department of the Alfred Krupp-Hospital, Essen (T.B. and M.M.) also with a C-150 scanner. The CTs were operated in the single-slice mode with an image acquisition time of 100 ms. A slice thickness of 3 mm was chosen. Prospective ECG-triggering was done at 80% of the R–R interval.13 Contiguous slices down to the apex of the heart were obtained. The CAC score was determined using the methods of Agatston et al.1 At least four contiguous pixels with a CT density ≥130 Hounsfield Units were used to define an area of CAC. The total CAC score was computed, comprising all calcified lesions in the coronary system. Analyses were performed using a Virtuoso workstation (Siemens Medical Solutions, Forchheim, Germany).13 Computed tomography scan results were not disclosed to the participants or the study centre.
Follow-up data collection
Annual postal questionnaires and a second medical examination assessed the morbidity health status during the follow-up, i.e. hospital admissions, outpatient diagnoses of cardiovascular (CV) disease.19
Risk factor analyses
Cardiovascular risk factors were assessed at baseline and after 5 years. The methodology has recently been published.19 Smoking behaviour was assessed in detail.20 The body mass index (BMI: kg/m2) was calculated using height and weight measurements. Total cholesterol, high-density lipoprotein (HDL-C) cholesterol, and triglycerides as well as low-density lipoprotein (LDL) cholesterol were measured with the standard enzymatic methods.7 Use of lipid-lowering medication was documented. Blood pressure was measured using an oscillometric method (Omron; Netherlands). The mean value of the second and third of three measurements taken at least 2 min apart was used.6 Hypertension was defined as systolic or diastolic blood pressure ≥140 or ≥90 mmHg, respectively, or the use of antihypertensive medication.6 Blood glucose was measured after overnight fasting 9.7 ± 4.9 h (median 12 h). Participants were classified as diabetics when glucose exceeded ≥126 mg/dL or reported use of insulin or oral hypoglycaemic agents.21 From the respective risk factors, the Framingham risk equation was used to predict the 10- year probability of CHD (10-year CHD risk) at baseline and follow-up.19 Serum creatinine was measured (Advia Clinical Chemistry Analyzer, Siemens HealthCare Diagnostics, Eschborn, Germany) and glomerular filtration rate (GFR in millilitres per minute per 1.73 m2 of BSA) was estimated. High-sensitive C-reactive protein was determined (BN-II, Siemens HealthCare Diagnostics, Germany). Homocysteine was measured using a fluorescence polarization immunoassay (IMx, Abbott Laboratories, USA). All analyses were done within 12 h at one central laboratory (D.F.).
Statistical analysis
Continuous data were depicted as means ± SD, and in the case of substantially skewed distribution also as median (Q1, Q3); count data as frequency and percentage. Demographics and risk factors at baseline (b) and after 5 years (5y) were given in quartiles/upper deciles of CACb and CAC5y, respectively. To evaluate the relationship between CAC groups and continuous data, we used a Spearman correlation test for trend with CAC groups, and for count data a Cochran–Armitage test for trend.
In a first step, age- and sex-related percentiles of CAC distribution for baseline and 5-year follow-up data were analysed. Previously, we had shown that the graphical presentation of percentiles such as the 50th, 75th, and 90th percentiles calculated from linear quantile regression of log(CAC + 1) on age showed an exponential curvature during ageing.14,17 This reflects the natural history of CAC with a progression of CAC proportional to the given CACb value.17
To prove that also the CAC progression for individual participants follow such an exponential curvature of CAC distribution, we developed a new mathematical tool (Figure 1). Therefore, we performed a linear quantile regression analysis from the baseline data set of the form log(CACb + 1) = I + β·age in 0.05 quantile steps, starting at 0.025 up to 0.975 getting a total of 20 quantiles. Each step yields an intercept (I) and a slope parameter (β), which is demonstrated in Figure 1 for the 50th, 75th, and 90th percentiles. To interpolate between these straight lines, both I and β were fitted as functions of quantile (Q) using quadratic equations (see Supplementary material online). In short, to determine a subject's percentile at baseline in two steps, we first identified the percentile (resolution 5%) pertaining to the straight line fit I + β·age, which is closest to the subject's coordinates (determined by age, gender, and CACb). Second we refined, by selecting the solution of the respective quadratic equation which is closest to the first, the coarse-grained prediction.
Figure 1.

Derivation scheme and use of coronary artery calcification quantile calculator.
Our hypothesis was that the individual CAC value increases with age along the given percentile at baseline. Therefore, we calculated log(CAC5y + 1) using only the baseline CACb quantile Qb, gender, and increased age by time between the two CTs (time) from log(CAC5y + 1) = I(Qb) + β(Qb) · (age + time). (see Appendix). Note that time between scans is a random variable, not necessarily equal to 5 years.
In a next step, we compared the predicted with the observed CAC5y progression after the 5-year interval. First we evaluated the number of participants for the total cohort who would be correctly classified. In addition, (multivariable) linear regression analysis for log(CAC5y + 1) as function of the predicted value (plus risk factors) gives the percentage of explained variance (coefficient of determination). Agreement statistics (weighted kappa and concordance correlation coefficient) were calculated as well. For kappa, we used the ordinal categories of CAC 0, CAC1-9.9, CAC10-99.9, CAC100-399.9, CAC > 400. Here, a predicted value below one was counted as zero (left truncation).
We also analysed the predictive ability for exceeding the cut-point of CAC = 400 at follow-up among subjects with baseline CAC > 0 but <400. The influence of risk factors was assessed, when the observed CAC5y exceeded the threshold of CAC = 400, when the predicted CAC5y was <400, using multivariable logistic regression.
Furthermore, we define a 20%-acceptance range delta (Δ) for the predicted CAC values, which is skewed with respect to the quantile Q, i.e. for Q = 0.8 (80th percentile), the range is 0.64–0.84. The corresponding formula for calculating the Δ is given in the Appendix. We calculated the fractions of subjects with Q5y below and above the accepted range. The influence of classical risk factors and the presence of CV medication on the probability to exceed the range was modelled using multivariable logistic regression analysis.
In a final step, we attempted to predict the age at which a subject on the Qth quantile would reach a clinically relevant CAC threshold (like CAC = 100 or CAC = 400). We could solve the sex-specific equations log(u + 1) = I(Q) + β(Q)·age(u,Q) for age, using the continuous coefficients given in the appendix. This resulted in a rational function (quotient of two quadratic polynomials).
Results
The baseline demographics of the cohort of 3481 participants, who underwent baseline and 5-year follow-up CTs are given in Table 1 for men and women. The male cohort is subdivided in five categories according to the percentiles of the CAC distribution: 0–25th, 25–50th, 50–75th, 75–90th, and >90th percentiles (Table 1). The female cohort was subdivided in four categories, because in women CAC values were 0 up to the 40th percentile (Table 1). In men, all baseline risk factors showed a significant association with CAC except for HDL-C, serum creatinine and GFR. For women the association to risk factors was similar, but not significant for smoking and serum creatinine.
Table 1.
Baseline characteristics by 25th/50th/75th/90th percentiles in men and 50th/75th/90th in women of coronary artery calcification distribution 2.3/41.0/192.6/557.0 and 0/1.0/24.5/139.8, respectively
| 1633 men CACb percentile |
1848 women CACb percentile |
||||||||||
|---|---|---|---|---|---|---|---|---|---|---|---|
| 0–25th | 25–50th | 50–75th | 75–90th | >90th | P for trend | 0–50th | 50–75th | 75–90th | >90th | P for trend | |
| n (%) | 403 (24.7) | 413 (25.3) | 408 (25.0) | 245 (15.0) | 164 (10.0) | n.a. | 915 (49.5) | 471 (25.5) | 277 (15.0) | 185 (10.0) | n.a. |
| Age (years) | 55.1 ± 7.0 | 57.6 ± 7.0 | 60.1 ± 7.1 | 61.1 ± 7.0 | 63.5 ± 6.8 | <0.0001 | 56.7 ± 7.1 | 59.0 ± 7.3 | 62.4 ± 7.1 | 64.7 ± 6.6 | <0.0001 |
| BMI (kg/m2) | 26.6 ± 3.0 | 28.4 ± 3.6 | 28.3 ± 3.8 | 28.4 ± 3.9 | 28.3 ± 3.3 | <0.0001 | 26.2 ± 4.2 | 28.4 ± 4.8 | 28.0 ± 5.8 | 28.9 ± 5.3 | <0.0001 |
| Obesity (BMI ≥30 kg/m2) | 43 (10.7) | 115 (27.9) | 116 (28.5) | 69 (28.3) | 50 (30.5) | <0.0001 | 153 (31.7) | 173 (36.8) | 85 (30.7) | 72 (39.1) | <0.0001 |
| Diabetes (%) | 37 (9.2) | 58 (14.0) | 59 (14.5) | 44 (18.0) | 41 (25.0) | <0.0001 | 35 (3.8) | 45 (9.6) | 37 (13.4) | 35 (18.9) | <0.0001 |
| HbA1c (%) | 5.4 ± 0.6 | 5.6 ± 0.9 | 5.6 ± 0.8 | 5.7 ± 1.1 | 5.7 ± 0.9 | <0.0001 | 5.3 ± 0.7 | 5.4 ± 0.6 | 5.5 ± 0.7 | 5.7 ± 1.0 | <0.0001 |
| Systolic BP (mmHg) | 131.9 ± 16.7 | 136.0 ± 18.3 | 138.5 ± 18.7 | 140.6 ± 19.3 | 146 ± 19.9 | <0.0001 | 122.7 ± 19.0 | 129.3 ± 20.2 | 130.9 ± 19.4 | 138.4 ± 22.0 | <0.0001 |
| Diastolic BP (mmHg) | 83.1 ± 9.6 | 84.8 ± 11.0 | 84.5 ± 10.3 | 84.8 ± 10.4 | 85.6 ± 10.0 | 0.0033 | 77.4 ± 10.0 | 80.2 ± 10.6 | 79.6 ± 10.3 | 80.5 ± 10.9 | <0.0001 |
| Hypertension (%) | 169 (41.9) | 219 (53.0) | 269 (65.9) | 166 (67.8) | 135 (82.3) | <0.0001 | 329 (36.0) | 235 (49.9) | 160 (57.8) | 138 (74.6) | <0.0001 |
| Antihypertensive medication (%) | 79 (19.6) | 108 (26.2) | 139 (34.1) | 85 (34.7) | 80 (48.8) | <0.0001 | 196 (21.4) | 160 (34.0) | 105 (37.9) | 106 (57.3) | <0.0001 |
| Never smoking (%) | 134 (33.3) | 137 (33.2) | 132 (32.4) | 55 (22.5) | 39 (23.8) | 0.023 | 498 (54.4) | 272 (57.8) | 161 (58.1) | 102 (55.1) | 0.18 |
| Former smoking (%) | 174 (43.2) | 183 (44.3) | 178 (43.6) | 118 (48.2) | 89 (54.3) | 0.023 | 241 (13.0) | 100 (21.2) | 60 (21.7) | 37 (20.0) | 0.18 |
| Present smoking (%) | 95 (23.6) | 93 (22.5) | 98 (24.0) | 72 (29.4) | 36 (22.0) | 0.023 | 176 (19.2) | 99 (21.0) | 56 (20.2) | 46 (24.9) | 0.18 |
| LDL-C (mg/dL) | 141.6 ± 36.0 | 146.9 ± 35.5 | 150.8 ± 34.6 | 148.8 ± 33.0 | 149.6 ± 36.7 | 0.0002 | 139.7 ± 34.2 | 147.2 ± 37.8 | 154.9 ± 35.7 | 154.7 ± 35.8 | <0.0001 |
| HDL-C (mg/dL) | 53.2 ± 14.8 | 51.2 ± 13.7 | 51.5 ± 13.9 | 51.2 ± 13.4 | 51.6 ± 14.5 | 0.10 | 67.4 ± 16.8 | 64.9 ± 17.7 | 63.6 ± 15.5 | 64.2 ± 16.6 | <0.0001 |
| ApoB (mg/dL) | 109.6 ± 26.2 | 116.2 ± 25.5 | 117.6 ± 27.0 | 118.4 ± 22.9 | 117.6 ± 26.5 | <0.0001 | 106.1 ± 42.3 | 110.7 ± 31.9 | 117.2 ± 24.7 | 118.1 ± 26.6 | <0.0001 |
| Lipid-lowering medication (%) | 16 (4.0) | 30 (7.3) | 29 (7.1) | 33 (13.5) | 28 (17.1) | <0.0001 | 46 (5.0) | 53 (11.3) | 35 (12.6) | 40 (21.6) | <0.0001 |
| Framingham risk score (%/10 years) | 11.4 ± 7.1 | 13.9 ± 8.3 | 16.5 ± 9.2 | 17.4 ± 9.0 | 20.4 ± 10.1 | <0.0001 | 5.9 ± 4.0 | 8.0 ± 5.2 | 9.2 ± 5.5 | 10.9 ± 5.6 | <0.0001 |
| High-sensitive C-reactive protein (mg/L) | 2.6 ± 7.6 | 2.8 ± 5.6 | 2.7 ± 5.7 | 3.5 ± 9.7 | 2.9 ± 3.3 | <0.0001 | 2.4 ± 6.0 | 4.0 ± 21.7 | 2.8 ± 3.4 | 3.4 ± 4.8 | <0.0001 |
| Serum creatinine (mg/dL) | 1.0 ± 0.3 | 1.0 ± 0.2 | 1.0 ± 0.2 | 1.0 ± 0.2 | 1.0 ± 0.1 | 0.54 | 0.8 ± 0.1 | 0.9 ± 0.3 | 0.9 ± 0.2 | 0.9 ± 0.1 | 0.079 |
| GFR (mL/min/1.73 m2) | 84.7 ± 18.0 | 85.3 ± 18.1 | 83.8 ± 20.0 | 82.3 ± 16.2 | 82.2 ± 15.9 | 0.0049 | 78.0 ± 19.5 | 75.9 ± 18.3 | 74.6 ± 14.6 | 73.0 ± 13.8 | 0.0001 |
| GFR < 60 (mL/min/1.73 m2) | 18 (4.5) | 11 (2.7) | 17 (4.2) | 10 (4.1) | 5 (3.1) | 0.77 | 74 (8.1) | 61 (13.0) | 35 (12.7) | 32 (17.3) | <0.0001 |
| Homocystein (µmol/L) | 11.7 ± 3.2 | 12.0 ± 4.1 | 12.1 ± 4.3 | 12.5 ± 3.8 | 12.6 ± 3.8 | <0.0001 | 11.5 ± 35.0 | 10.7 ± 3.1 | 11.7 ± 6.7 | 12.2 ± 4.0 | <0.0001 |
apo B, apoliporotein B; BMI, body mass index; CAC, coronary artery calcification; systolic/diastolic BP, systolic/diastolic blood pressure; HbA1c, haemoglobin A1c; HDL-C, high-density lipoprotein cholesterol; GFR, glomerular filtration rate; LDL-C, low-density lipoprotein cholesterol; n, number of participants; b, baseline values.
After 5 years, the demographics in men show a higher BMI with a higher prevalence of obesity and diabetes and higher HbA1c level (Table 2). Systolic blood pressure was higher and diastolic blood pressure lower despite a higher use of antihypertensive agents. On the other hand, we found a lower prevalence of smoking as well as lower LDL-C levels with a higher rate of lipid-lowering medication. The 5-year follow-up data in women showed very similar trends in comparison with men (Table 2).
Table 2.
Five-year follow-up characteristics by 25th/50th/75th/90th percentiles in men and 50th/75th/90th in women of coronary artery calcification distribution 7.2/94.9/376.0/999.2 and 1.6/68.2/291.6, respectively
| 1633 men CAC5y percentile |
1848 women CAC5y percentile |
||||||||||
|---|---|---|---|---|---|---|---|---|---|---|---|
| 0–25th | 25–50th | 50–75th | 75–90th | >90th | P for trend | 0–50th | 50–75th | 75–90th | >90th | P for trend | |
| n (%) | 406 (24.9) | 410 (25.1) | 408 (25.0) | 245 (15.0) | 164 (10.0) | n.a. | 917 (49.6) | 469 (25.4) | 277 (15.0) | 185 (10.0) | n.a. |
| Age (years) | 59.6 ± 6.4 | 63.5 ± 7.2 | 65.3 ± 7.1 | 66.3 ± 7.0 | 68.2 ± 6.8 | <0.0001 | 61.3 ± 6.8 | 65.3 ± 7.2 | 67.5 ± 7.4 | 69.8 ± 6.6 | <0.0001 |
| BMI (kg/m2) | 27.4 ± 3.6 | 28.3 ± 3.9 | 28.7 ± 3.8 | 28.6 ± 3.9 | 28.8 ± 3.3 | <0.0001 | 27.4 ± 4.9 | 28.0 ± 5.2 | 28.2 ± 5.3 | 29.5 ± 5.6 | <0.0001 |
| Obesity (BMI ≥30 kg/m2) | 71 (17.5) | 119 (29.1) | 126 (31.0) | 77 (31.7) | 56 (34.2) | <0.0001 | 243 (26.5) | 142 (30.4) | 94 (33.9) | 81 (44.0) | <0.0001 |
| Diabetes (%) | 48 (11.8) | 83 (20.2) | 95 (23.3) | 58 (23.7) | 62 (37.8) | <0.0001 | 80 (8.7) | 63 (13.4) | 46 (16.6) | 54 (29.2) | <0.0001 |
| HbA1c (%) | 5.5 ± 0.6 | 5.7 ± 0.9 | 5.8 ± 0.9 | 5.8 ± 1.0 | 6.0 ± 1.0 | <0.0001 | 5.5 ± 0.6 | 5.6 ± 0.6 | 5.8 ± 0.7 | 5.9 ± 0.8 | <0.0001 |
| Systolic BP (mmHg) | 132.2 ± 16.7 | 138.3 ± 19.5 | 139.9 ± 19.8 | 142.4 ± 18.0 | 143.1 ± 19.7 | <0.0001 | 126.0 ± 18.0 | 133.2 ± 19.3 | 133.5 ± 21.1 | 137.3 ± 21.5 | <0.0001 |
| Diastolic BP (mmHg) | 81.0 ± 10.2 | 82.6 ± 10.8 | 81.9 ± 10.5 | 82.0 ± 10.4 | 79.9 ± 11.3 | 0.0033 | 77.0 ± 9.7 | 78.3 ± 9.5 | 77.7 ± 10.4 | 77.2 ± 10.9 | 0.16 |
| Hypertension (%) | 200 (49.4) | 295 (72.0) | 291 (71.7) | 190 (77.6) | 141 (86.0) | <0.0001 | 430 (46.9) | 302 (56.0) | 186 (67.2) | 149 (81.0) | <0.0001 |
| Antihypertensive medication (%) | 112 (27.6) | 180 (43.9) | 198 (48.5) | 136 (55.5) | 118 (72.0) | <0.0001 | 313 (34.1) | 220 (46.9) | 146 (52.7) | 129 (69.7) | <0.0001 |
| Never smoking (%) | 143 (35.2) | 134 (32.8) | 110 (27.0) | 58 (23.7) | 45 (27.4) | 0.03 | 506 (55.2) | 262 (55.2) | 166 (59.9) | 97 (52.4) | 0.58 |
| Former smoking (%) | 191 (47.0) | 202 (49.4) | 211 (51.8) | 132 (53.9) | 94 (57.3) | 0.03 | 275 (30.0) | 118 (25.2) | 66 (23.8) | 54 (29.2) | 0.58 |
| Present smoking(%) | 72 (17.7) | 73 (17.9) | 86 (21.1) | 55 (22.5) | 25 (15.2) | 0.03 | 135 (14.7) | 88 (18.8) | 45 (16.3) | 34 (18.4) | 0.58 |
| LDL-C (mg/dL) | 127.6 ± 32.1 | 132.9 ± 35.2 | 134.0 ± 30.7 | 135.9 ± 36.5 | 126.4 ± 32.2 | 0.0002 | 131.0 ± 33.6 | 138.6 ± 36.4 | 140.2 ± 36.8 | 130.8 ± 35.8 | 0.006 |
| HDL-C (mg/dL) | 54.5 ± 13.8 | 54.0 ± 12.9 | 53.0 ± 12.6 | 54.4 ± 13.7 | 53.2 ± 13.2 | 0.10 | 68.3 ± 15.5 | 66.1 ± 16.2 | 65.4 ± 16.3 | 65.3 ± 18.0 | 0.0002 |
| ApoB (mg/dL) | 110.4 ± 26.3 | 116.0 ± 28.1 | 116.8 ± 24.8 | 119.5 ± 28.9 | 112.7 ± 26.2 | 0.007 | 112.1 ± 26.9 | 117.3 ± 28.2 | 121.2 ± 27.7 | 116.4 ± 29.4 | <0.0001 |
| Lipid-lowering medication (%) | 39 (9.6) | 68 (16.6) | 80 (19.6) | 63 (25.7) | 56 (34.2) | <0.0001 | 90 (9.8) | 85 (18.1) | 68 (24.6) | 69 (37.3) | <0.0001 |
| Framingham risk score (%/10 years)a | 11.6 ± 6.4 | 15.2 ± 8.2 | 17.0 ± 8.6 | 18.9 ± 9.3 | 18.2 ± 8.1 | <0.0001 | 6.6 ± 4.1 | 8.4 ± 4.6 | 9.0 ± 5.3 | 10.8 ± 6.2 | <0.0001 |
| High-sensitive C-reactive protein (mg/L) | 2.4 ± 5.7 | 2.4 ± 4.0 | 2.6 ± 4.7 | 2.9 ± 3.9 | 2.8 ± 6.1 | 0.71 | 2.4 ± 4.0 | 2.8 ± 4.2 | 3.2 ± 5.0 | 3.2 ± 3.6 | <0.0001 |
| Serum creatinine (mg/dL) | 1.1 ± 0.1 | 1.2 ± 0.3 | 1.2 ± 0.2 | 1.2 ± 0.2 | 1.2 ± 0.2 | 0.54 | 1.0 ± 0.1 | 1.0 ± 0.3 | 1.0 ± 0.2 | 1.0 ± 0.1 | 0.079 |
| GFR (mL/min/1.73 m2) | 71.1 ± 10.5 | 68.7 ± 10.7 | 69.1 ± 10.5 | 69.0 ± 10.3 | 68.1 ± 10.1 | 0.0049 | 62.9 ± 9.0 | 61.9 ± 9.5 | 61.6 ± 12.0 | 59.8 ± 12.8 | <0.0001 |
| GFR < 60 mL/min/1.73 m2 | 50 (3.1) | 74 (18.1) | 72 (17.7) | 42 (17.2) | 33 (20.1) | 0.03 | 352 (38.7) | 186 (40.0) | 124 (45.1) | 100 (54.6) | <0.0001 |
| Homocysteine (µmol/L) | 11.2 ± 5.2 | 11.9 ± 6.0 | 12.0 ± 3.6 | 12.2 ± 4.5 | 12.1 ± 3.6 | <0.0001 | 10.1 ± 3.2 | 10.7 ± 3.8 | 11.6 ± 4.5 | 12.1 ± 4.4 | <0.0001 |
apo B, apoliporotein B; BMI, body mass index; CAC, coronary artery calcification; systolic/diastolic BP, systolic/diastolic blood pressure; HbA1c, haemoglobin A1c; HDL-C, high-density lipoprotein cholesterol; GFR, glomerular filtration rate; LDL-C, low-density lipoprotein cholesterol; n, number of participants; t1, data for 5-year follow-up values.
aCalculated only for subjects aged 75 or younger at follow-up.
For the male and female cohort, the CAC values for the 10th , 25th, 50th,75th, 90th, and 95th percentiles of the CAC distribution are listed for the baseline and 5-year follow-up CTs (Appendix Table A1–4). After 5 years, the graphics of the age- and gender-related percentiles of CAC distribution showed a nearly indistinguishable curvature in comparison with the baseline results except for men in the highest percentile of CAC (Figure 2). Based on this observation, we tested the hypothesis that not only for the total cohort, but also for individual participants the progression of CAC over time follows an exponential curvature once the calcification process has started. The derived mathematical tool was used to predict the individual CAC progression rate.
Figure 2.
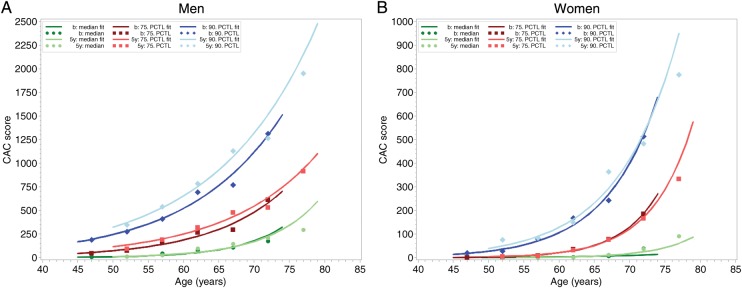
(A) Observed and fitted 50th, 75th, and 90th percentile of the coronary artery calcification distribution for men by age categories. In dark colors for the baseline values, when the participants (1633 men) were aged between 45 and 74 years, and in light colors for the 5-year follow-up data, when the cohort was aged 50–79 years. Note the exponential shape of the increase of coronary artery calcification. Dots represent observed percentile values for each 5-year age categories, lines show linear quantile regression on a log scale after retransformation. (B) Observed and fitted 50th, 75th, and 90th percentile of the coronary artery calcification distribution for men by age categories. In dark colors for the baseline values, when the participants (1848 women) were aged between 45 and 74 years, and in light colors for the 5-year follow-up data, when the cohort was aged 50–79 years. Note the exponential shape of the increase of coronary artery calcification. Dots represent observed percentile values for each 5-year age categories, lines show linear quantile regression on a log scale after retransformation. The y-axis range in Figure 1A and B differ by a factor of 2.5 in men compared with women.
Residual and correlation analysis showed that (i) the mean differences between the observed and the predicted log(CAC5y + 1) were close to 0; 0.08 ± 1.11 in 1633 men and 0.06 ± 1.29 in 1848 women, (ii) the coefficient of determination between the observed and predicted log(CAC5y + 1) was R2 = 0.801 in men and R2 = 0.720 in women. This corresponds to an explained variance of log-transformed CAC5y of 80.1 and 72.0% in men and women. When we adjusted for baseline risk factor including medication the values increased to R2 = 0.810 for men and R2 = 0.736 for women (explained variance: 81.0 and 73.6%), respectively. Overall agreement between observed and predicted CAC values reached a kappa value of 0.746 (95% CI: 0.732–0.760) and a concordance correlation on the log-scale of 0.886 (95% CI: 0.879–0.893).
To demonstrate the benefit of our approach, we plotted the predicted age (at which a CAC value is reached) vs. the percentile based on our mathematical tool for CAC = 10, CAC = 20, CAC = 50, CAC = 100, CAC = 200, CAC = 400. For CAC = 400, we also plotted the corresponding acceptance limits (Figure 3A). Thus, the age can be predicted at which an interesting threshold of CAC is reached. For instance, when the baseline CAC value in an individual man corresponds to the 40th percentile, CAC = 100 is reached at the age of 69.4 (64.2–73.6) years and CAC = 400 at the age of 77.7 (73.5–81.7) years. On the other hand, if it corresponds to the 80th percentile, CAC = 100 is reached at 48.3 (44.7–58.6) years and CAC = 400 at 63.3 (61.3–69.6) years. For women, predicted age at a given CAC percentile is much higher and shown in Figure 3B. Women with CAC values below the 50th percentile will not reach CAC = 100 until the age of 85 years and those with a level below the 70th percentile reach the CAC = 100 threshold not before the age of ∼70 years. CAC = 100 is predicted to be reached by women on the 80th percentile at 65.4 (63.1–74.6) years, and CAC = 400 at 73.4 (71.5–82.9) years.
Figure 3.
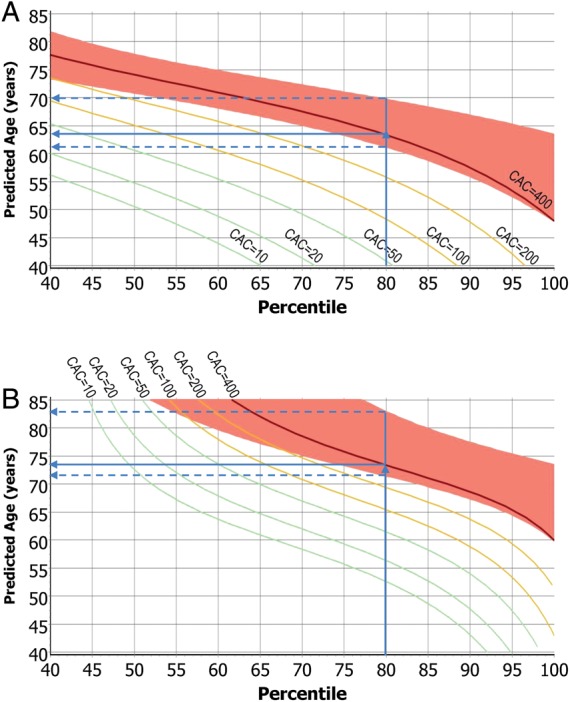
(A) Predicted age, at which a man reaches a coronary artery calcification value, as function of coronary artery calcification percentile. The red band around the curve for CAC = 400 represents respective prediction limits. A man with an observed coronary artery calcification on the 80th percentile reaches CAC = 400 at 63.3 (61.3–69.6) years. (B) Predicted age, at which a woman reaches a coronary artery calcification value, as function of coronary artery calcification percentile. The red band around the curve for CAC = 400 represents respective prediction limits. A woman with an observed coronary artery calcification on the 80th percentile reaches CAC = 400 at 73.4 (71.5–82.9) years, 10 years later than her male counterpart.
Overall, the observed CAC values were in 68.1% of the cohort (men: 67.1%; women: 69.1%) within the pre-defined 20%-acceptance range, while 19.4% of the cohort (20.0 and 18.8%, respectively) had a higher observed CAC value and 12.5% (12.9 and 12.1%) a lower CAC value than predicted. Please note that by chance assignment we expected 20% in a pre-specified acceptance range around the predicted values. However, our calculation demonstrates that more than two-thirds of observed CAC values after 5 years were included. Multivariable logistic regression analysis (Table 3) showed that in men, age, systolic blood pressure, diabetes, and smoking as well lipid-lowering medication contributed significantly to the probability for CAC progression above the predicted value. In women similar odds ratios were found except for the factor age in women.
Table 3.
Multivariable logistic regression for CAC5y above the accepted range of deviation
| Men |
Women |
|||
|---|---|---|---|---|
| OR (95% CI) | P-value | OR (95% CI) | P-value | |
| Age (per 5 years) | 0.71 (0.65–0.78) | <0.0001 | 0.94 (0.86–1.02) | 0.14 |
| Systolic blood pressure (per 10 mmHg) | 1.13 (1.06–1.21) | 0.0005 | 1.08 (1.01–1.14) | 0.02 |
| Antihypertensive medication | 1.26 (0.95–1.67) | 0.11 | 1.15 (0.88–1.51) | 0.32 |
| LDL-cholesterol (per 10 mg/dL) | 1.01 (0.98–1.05) | 0.47 | 1.02 (0.99–1.06) | 0.23 |
| HDL-cholesterol (per 5 mg/dL) | 1.04 (0.99–1.09) | 0.09 | 1.02 (0.98–1.05) | 0.43 |
| Lipid-lowering medication | 1.89 (1.24–2.89) | 0.003 | 1.49 (1.02–2.19) | 0.04 |
| Diabetes mellitus | 1.90 (1.37–2.63) | <0.0001 | 1.56 (1.05–2.33) | 0.03 |
| Former smoking | 1.30 (0.95–1.77) | 0.10 | 1.11 (0.82–1.50) | 0.51 |
| Present smoking | 1.99 (1.42–2.80) | <0.0001 | 1.98 (1.47–2.67) | <0.0001 |
To further test the accuracy of our mathematical tool, we selected 1940 participants, who had a baseline CAC between 0 and 400. Out of these 242 (12.5%) participants had a CAC score of >400 after 5 years; 163 (15.3%) of 1068 men and 79 (9.1%) of 872 women. Multivariable logistic regression analysis for exceeding observed CAC = 400 among those, who were predicted to stay below CAC = 400, demonstrated the importance of diabetes and present smoking for both genders and systolic blood pressure for women (Table 4). We used this cohort of 1940 men and women to calculate the accuracy of our mathematical tool for prediction of a progression beyond CAC = 400. The misclassification rate was only 8.5% for the total cohort (men 9.8% and women 6.9%) meaning correct classification in 91.5% (Table 5). The sensitivity reached 59.5% and a specificity of 96.1%, a positive-predictive accuracy of 68.3% and negative-predictive accuracy of 94.3% (Table 5), which means that the model was particular useful to rule out a CAC progression beyond 400. The results in men were slightly better than in women.
Table 4.
Multivariable logistic regression for observed CAC5y ≥ 400 where predicted CAC5y < 400a
| Men |
Women |
|||
|---|---|---|---|---|
| OR (95% CI) | P-value | OR (95% CI) | P-value | |
| Age (per 5 years) | 0.92 (0.65–1.11) | 0.38 | 1.16 (0.87–1.54) | 0.31 |
| Systolic blood pressure (per 10 mmHg) | 1.19 (0.98–1.27) | 0.13 | 1.38 (1.08–1.51) | 0.004 |
| LDL-cholesterol (per 10 mg/dL) | 1.02 (0.95–1.09) | 0.63 | 0.94 (0.84–1.05) | 0.25 |
| Diabetes mellitus | 1.97 (1.08–3.62) | 0.03 | 4.71 (2.1–10.55) | 0.0002 |
| Present smoking | 1.73 (1.01–2.92) | 0.05 | 4.54 (1.88–11.01) | 0.0008 |
aBased on subjects with baseline CAC > 0 but <400.
Table 5.
Diagnostic accuracy for the prediction of CAC ≥ 400a
| Both genders |
Men |
Women |
|||||
|---|---|---|---|---|---|---|---|
| CAC score ≥400 at follow-up | No | Yes | No | Yes | No | Yes | |
| Predicted CAC score ≥400 | No | 1631 | 98 | 867 | 67 | 764 | 31 |
| Yes | 67 | 144 | 38 | 96 | 29 | 48 | |
| Sensitivity (%) | 59.5 | 58.9 | 60.8 | ||||
| Specificity (%) | 96.1 | 95.8 | 96.3 | ||||
| Positive-predictive value (%) | 68.3 | 71.6 | 62.3 | ||||
| Negative-predictive value (%) | 94.3 | 92.8 | 96.1 | ||||
aBased on subjects with baseline CAC > 0 but <400.
In terms of a sensitivity analysis, we performed a validation using a half sample design. We determine the CAC calculator from baseline values in one half and apply it to predict follow-up CAC from baseline CAC in the other half. Results support a stable prediction.
Discussion
Our study demonstrates (i) that age- and gender-related percentiles of CAC distribution follow an exponential curvature, which showed a nearly indistinguishable shift along the baseline during a follow-up period of 5 years. (ii) The progression of the coronary artery calcification seems to be nearly inevitable with a very high explained variance, which increases only slightly after adjustment for risk factors including lipid lowering and antihypertensive medication. (iii) Based on the observation of the exponential curvature of the CAC distribution for the whole cohort, we developed a mathematical tool to predict the CAC progression for individual participants of the study. (iv) The difference between observed and predicted CAC progression was very small and the coefficient of determination between both values very high. (v) The age, at which relevant CAC of enhanced coronary or CV risk, like CAC = 100 or CAC = 400 is reached can be calculated once the individual baseline CAC percentile value is available. The predictable rate of CAC progression will re-inforce the understanding of the atherosclerotic process for physicians and patients as it seems indeed to be in many aspects inevitable and heritable.15 Physicians can use the new calculation tool, when they are interested in the progression of CAC for their patients. Further validation studies are needed in cohorts of different ethnicity and for different CT scanners. However, it is interesting to note that percentiles of CAC distribution are comparable in populations of similar ethnicity for both genders despite striking differences in risk factors.13,14,22 In other ethnic populations, the percentile of CAC distribution and CAC progression were lower for Chinese, blacks, and Hispanic cohorts compared with Caucasians.14,23 This view is supported by the Epidemiology of Coronary Artery Calcification (ECAC) study,15 showing in 877 asymptomatic white adults, that risk factors and baseline CAC explained 64% of the variation in CAC progression, comparable with our study showing 81.0% in men and 73.6% in women.
Signs of atherosclerosis were found in male and female mummies and in virtually every era of Egypt.24 When mummies of different continents were compared, covering 4000 years of human history, abdominal aortic calcification was more common in non-Hispanic-whites (97%), than Chinese (96%), Hispanics (91%), and Afro-Americans (80%).25 This corresponds to the observation of MESA that blacks tended to have the lowest CAC prevalence and CAC levels after adjusting for risk factors.26 The rate of CAC progression was higher in whites compared with Chinese, Hispanics, and blacks.23 A very similar inverse worldwide ethnic distribution was found for the β3 subunit of heterotrimeric G-protein (GNB3) subunit 825T allele associated with features of metabolic syndrome as well as stroke and CAD.27,28 The 825T allele frequencies were highest in Africa ranging from 72 to 91%, lower in Australoids with 72%, even lower in China with 42–62%, Europe with 22–38%, and lowest in North American Musqueams with 30% as well as South America with 15–32%, but reached 72% in AfroAmericans.28 The obvious strong genetically based heritable determination of the CAC-related atherosclerotic process may thus be related to polymorphism like the G-proteins.
Risk factors and progression of coronary artery calcification
Predictors of CAC progression are reported to be related to endothelium dysfunction, inflammation, autoantibodies to oxidized LDL-cholesterol, increased apoB100 immune complex and lipoprotein (a).29 Association studies demonstrated very low values for the explained variance in the range of 2–3% for different lipid parameters including apo A1 and B as well as Lp(a) and risk factor ratios.8 Including all risk factors in the model the explained variance amounted to <25%.6,7 In our longitudinal observational study, the explained variance for log(CAC + 1) (observed vs. predicted) reached 80.1% in men and 72.0% in women. Risk factor adjustment including medication improved the explained variance to only 81.0 and 73.6%, respectively. These findings correspond to previous observations in the EBAC trial that baseline risk factors and CAC quantity explained 64% of the variation in CAC progression.23 Our study shows that variable changes of risk factor profile and treatment occurred during the follow-up, which in part could explain the lack of CAC attenuation. Some factors such as obesity and diabetes as well as systolic blood pressure increased, whereas others like LDL-C and smoking decreased. The multivariable analysis demonstrated in addition, that in men systolic blood pressure, diabetes, and smoking, in women smoking, too, were confounders which explained a higher than expected CAC progression, supporting previous studies.23,29–31 Note that the odds ratios in men for age were <1, indicating higher variability of CAC in younger individuals, which means, that younger men were more prone to CAC progression than elderly participants. The quite small influence of risk factors including lipid-lowering medication and antihypertensive therapy can explain, why in four randomized, in both verum and placebo controlled, studies, statin treatment was unable to stop or even attenuate CAC progression.9–12 The CAC progression seems to be quite heritable and therefore inevitable,15 as previously suggested and supported by our results in a large observational study.16,23
Clinical implications
Coronary artery calcification progression follows a given exponential curvature based on the relationship between age and CAC distribution at a baseline, during a time period of 5 years. Our results demonstrate that CAC progression seems to be heritable and inevitable, but predictable. Our analysis suggest that repetitive quantification of CAC over time may not be suitable to measure the effectiveness of intensified risk factor modification, as reduction of risk profile may not transfer in attenuation of CAC progression. This opens a new interpretation for physicians and patients, which may lead to better understanding of the lack of attenuation of this process by lifestyle changes or current known medication and avoid multiple scans. This offers the opportunity to initiate re-scans after time intervals at which certain CAC-thresholds can be expected and to avoid unnecessary CT scans in between. To be able to anticipate the age, at which CAC thresholds of high risk like CAC > 300 or CAC > 400 are reached, can be regarded as a considerable advantage leading potentially to a different patient management and can be regarded as an important step forward to a personalized medicine in preventive cardiology. However, this study only addresses the progression of calcifications, but the inevitability of this process does not mean that outcome is inevitable or cannot be modified by preventive measures.
Strength and limitation of the study
The strength of our study represents a very well-defined large cohort with close follow-up over 5 years. The CT scans were repeated with the same system and protocol, so that we avoided the use of any correction factors, which otherwise would have been needed using different types of scanners.14,25,32 A 5-year follow-up period may be too short, but may allow an extrapolation to longer time intervals based on the exponential percentile curvature, which remained constant over time. In addition, we found for some patient, for whom we had during a 10-year follow-up multiple CT scans, that their individual CAC progression followed the age- and gender-related exponential curvature calculated form our baseline data of the total cohort.33–35 An extrapolation to longer time intervals has, however, to be proved in larger cohorts.
We excluded those subjects with coronary events during the 5-year period, because different revascularization procedures would have disturbed the CAC score analysis. However, we did know that those with events have had higher CAC scores and different percentile of CAC distribution.6,19,36 These observations may also explain, why a small left and upward shift to the higher percentiles of CAC distribution was found in men.
On the other hand, some subjects were not included, because we did not reach them or they refused to come. It may be that they were at a lower risk than those who attended the second study. Higher risk individuals would possibly be more interested in the second evaluation of their risk profile as they could be more concerned about their health situation. This assumption would, however, mean that inclusion of lower risk subjects with lower CAC values would outbalance the enhanced CAC score we observed in men for those with more than the 75th percentile and would not influence the results in women in whom such a difference was not seen.
Progression of CAC seems to follow a sustained, apparently inevitable and partly genetically determined heritable pathway which can be predicted over time from age- and gender-related percentile of CAC distribution once CAC level exceeds CAC > 10. A web-based application offers the possibility to calculate the degree of CAC progression based on age, gender, and percentile of CAC distribution for a given time span. Our data suggest that repetitive CAC-scoring only renders limited additional information and can only to a small amount be influenced by risk factor modification, which may reduce the indication for multiple CT examinations. The demonstration of the natural history of the atherosclerotic calcification process will help the physician–patient interaction and avoid potential misinterpretation of medication efficacy on the disease process, because a profound attenuation cannot be detected. In this regard, our approach could be regarded as an important step to a more personalized medicine in preventive cardiology. However, while CAC progression may not be modified, this does not mean that outcome is inevitable or cannot be modified by preventive measures due to the different patho-anatomical pathway.
Our data explain why current approaches for attenuation of CAC progression have failed. Studies related to ameliorate vascular calcification will have to take into account these analyses. The demonstration of the natural history of the atherosclerotic calcification process will help the physician–patient interaction and avoid potential misinterpretation of medication efficacy on the disease process, because a profound attenuation cannot be expected.
Supplementary material
Supplementary material is available at European Heart Journal online.
Advisory Board
Meinertz T., Hamburg, Germany (Chair); Bode C., Freiburg, Germany; de Feyter P.J., Rotterdam, Netherlands; Güntert B., Hall LT, Austria; Gutzwiller F., Bern, Switzerland; Heinen H., Bonn, Germany; Hess O., Bern, Switzerland; Klein B., Essen, Germany; Löwel H., Neuherberg, Germany; Reiser M., Munich, Germany; Schmidt G. (†), Essen, Germany; Schwaiger M., Munich, Germany; Steinmüller C., Bonn, Germany; Theorell T., Stockholm, Sweden; Willich S.N., Berlin, Germany.
Criteria and endpoint committee
C. Bode, Freiburg, Germany (Chair); K. Berger, Münster, Germany; H.R. Figulla, Jena, Germany; C. Hamm, Bad Nauheim, Germany; P. Hanrath, Aachen, Germany; W. Köpcke, Münster, Germany; Ringelstein, Münster, Germany; C. Weimar, Essen, Germany; A. Zeiher, Frankfurt, Germany.
Funding
We thank the Heinz Nixdorf Foundation [Chairman: Martin Nixdorf; Past Chairman: Dr Jur Gerhard Schmidt (deceased)], for their generous support of this study. This study is also supported by the German Ministry of Education and Science (BMBF), and the German Aero-space Center [Deutsches Zentrum für Luft- und Raumfahrt (DLR)], Bonn, Germany. The German Research Council Assessment supported the study (DFG project: ER 155/6-2) and funded the study of psychosocial factors and neighbourhood level information (DFG project SI 236/8-1 and SI 236/9-1). The sponsor of the study transferred the monitoring of the study to the German Ministry of Education and Science, Bonn using an international advisory board and quality control as well as event committee, but had no role concerning the study design, data collection, analysis, interpretation, or writing the report. The corresponding authors had full access to all data in the study and final responsibility for the submission of the manuscript for publication. Funding to pay the Open Access publication charges for this article was provided by the Heinz Nixdorf Recall Investigative Group.
Conflict of interest: none declared.
Acknowledgements
We acknowledge the support of the Sarstedt AG & Co. (Nümbrecht, Germany) concerning laboratory equipment. We thank Prof. K. Lauterbach (Adjunct Professor, Harvard School of Public Health, Boston, USA) for his valuable contributions in an earlier phase of the study. We are indebted to the all study participants and to the dedicated personnel of both the study center of the HNR study and the EBT-scanner facilities as well as to the investigative group, in particular to U. Slomiany, E.M. Beck, A. Öffner, S. Münkel, M. Bauer, S. Schrader, R. Peter, and H. Hirche.
Appendix
(Table A1, Table A2, Table A3, Table A4).
Table A1.
Baseline observed percentiles of coronary artery calcification for male participants by age category
| Age groups | 45–49 years | 50–54 years | 55–59 years | 60–64 years | 65–69 years | 69–74 years | 75–79 years |
|---|---|---|---|---|---|---|---|
| n | 227 | 327 | 298 | 376 | 262 | 143 | |
| CAC scores | |||||||
| Percentile: of CAC distribution | |||||||
| 10th | 0.0 | 0.0 | 0.0 | 0.0 | 1.0 | 1.3 | |
| 25th | 0.0 | 0.0 | 4.1 | 8.0 | 16.5 | 36.4 | |
| 50th | 2.8 | 8.5 | 43.1 | 74.7 | 104.6 | 173.0 | |
| 75th | 45.9 | 76.3 | 166.1 | 270.4 | 298.1 | 614.7 | |
| 90th | 184.1 | 272.6 | 393.0 | 692.9 | 770.2 | 1312.5 | |
| 95th | 291.4 | 476.5 | 622.5 | 1152.1 | 1561.6 | 1745.7 | |
| Mean CAC value | 73.1 | 120.4 | 145.2 | 255.4 | 321.0 | 420.9 | |
| SD | 270.5 | 398.5 | 270.2 | 494.8 | 649.3 | 585.8 | |
Table A2.
Five-year follow-up observed percentiles of coronary artery calcification for male participants by age category
| Age groups | 50–54 years | 55–59 years | 60–64 years | 65–69 years | 69–74 years | 75–79 years |
|---|---|---|---|---|---|---|
| n | 217 | 328 | 293 | 376 | 271 | 148 |
| CAC scores | ||||||
| Percentiles of CAC distribution | ||||||
| 10th | 0.0 | 0.0 | 0.0 | 0.0 | 10.8 | 15.2 |
| 25th | 0.0 | 0.0 | 7.7 | 23.6 | 53.9 | 90.0 |
| 50th | 7.7 | 21.7 | 97.5 | 143.2 | 205.5 | 295.9 |
| 75th | 93.1 | 188.1 | 320.5 | 479.5 | 536.3 | 917.3 |
| 90th | 343.7 | 512.1 | 757.6 | 1130.2 | 1264.8 | 2042.0 |
| 95th | 550.8 | 1223.3 | 1346.6 | 1882.9 | 2144.6 | 2519.0 |
| Mean CAC value | 131.0 | 218.6 | 270.6 | 419.3 | 513.2 | 669.2 |
| SD | 393.0 | 560.6 | 475.6 | 693.9 | 850.7 | 857.0 |
Table A3.
Baseline observed percentiles of coronary artery calcification for female participants by age category
| Age groups | 45–49 years | 50–54 years | 55–59 years | 60–64 years | 65–69 years | 69–74 years | 75–79 years |
|---|---|---|---|---|---|---|---|
| n | 257 | 362 | 333 | 416 | 288 | 192 | |
| CAC scores | |||||||
| Percentiles of CAC distribution | |||||||
| 10 | 0.0 | 0.0 | 0.0 | 0.0 | 0.0 | 0.0 | |
| 25 | 0.0 | 0.0 | 0.0 | 0.0 | 0.0 | 1.1 | |
| 50 | 0.0 | 0.0 | 0.0 | 2.3 | 6.4 | 37.8 | |
| 75 | 1.5 | 2.6 | 9.5 | 37.3 | 78.9 | 186.2 | |
| 90 | 18.8 | 25.8 | 79.4 | 166.1 | 242.6 | 513.9 | |
| 95 | 53.9 | 83.8 | 176.1 | 311.2 | 420.1 | 923.1 | |
| Mean CAC value | 8.1 | 19.1 | 28.8 | 68.4 | 105.0 | 171.1 | |
| SD | 30.9 | 97.6 | 84.1 | 211.6 | 398.1 | 329.5 | |
Table A4.
Five-year follow-up observed percentiles of coronary artery calcification for female participants by age category
| Age groups | 50–54 years | 55–59 years | 60–64 years | 65–69 years | 69–74 years | 75–79 years |
|---|---|---|---|---|---|---|
| n | 230 | 380 | 332 | 415 | 293 | 198 |
| CAC scores | ||||||
| Percentiles of CAC distribution | ||||||
| 10 | 0.0 | 0.0 | 0.0 | 0.0 | 0.0 | 0.0 |
| 25 | 0.0 | 0.0 | 0.0 | 0.0 | 0.0 | 6.7 |
| 50 | 0.0 | 0.0 | 0.0 | 10.8 | 39.5 | 89.4 |
| 75 | 5.7 | 7.5 | 33.0 | 76.3 | 172.8 | 334.5 |
| 90 | 73.9 | 83.0 | 148.0 | 362.3 | 483.2 | 774.6 |
| 95 | 150.9 | 200.7 | 291.6 | 601.3 | 877.8 | 1465.7 |
| Mean CAC value | 24.5 | 39.1 | 60.8 | 130.9 | 185.7 | 302.4 |
| SD | 77.1 | 167.8 | 180.8 | 377.3 | 593.7 | 527.3 |
References
- 1.Agatston AS, Janowitz WR, Hildner FJ, Zusmer NR, Viamonte M, Jr, Detrano R. Quantification of coronary artery calcium using ultrafast computed tomography. J Am Coll Cardiol. 1990;15:827–832. doi: 10.1016/0735-1097(90)90282-t. [DOI] [PubMed] [Google Scholar]
- 2.Min JK, Lin FY, Gidseg DS, Weinsaft JW, Weinsaft JW, Berman DS, Shaw LJ, Rozanski A, Callister TQ. Determinants of coronary calcium conversion among patients with a normal coronary calcium scan: what is the ‘warranty period’ for remaining normal? J Am Coll Cardiol. 2010;55:1110–1117. doi: 10.1016/j.jacc.2009.08.088. [DOI] [PubMed] [Google Scholar]
- 3.Raggi P, Cooil B, Ratti C, Callister TQ, Budoff M. Progression of coronary artery calcium and occurrence of myocardial infarction in patients with and without diabetes mellitus. Hypertension. 2005;46:238–243. doi: 10.1161/01.HYP.0000164575.16609.02. [DOI] [PubMed] [Google Scholar]
- 4.Greenland P, Bonow RO, Brundage BH, Budoff MJ, Eisenberg MJ, Grundy SM, Lauer MS, Post WS, Raggi P, Redberg RF, Rodgers GP, Shaw LJ, Taylor AJ, Weintraub WS. ACCF/AHA 2007 clinical expert consensus document on coronary artery calcium scoring by computed tomography in global cardiovascular risk assessment and in evaluation of patients with chest pain: a report of the American College of Cardiology Foundation Clinical Expert Consensus Task Force (ACCF/AHA Writing Committee to Update the 2000 Expert Consensus Document on Electron Beam Computed Tomography) developed in collaboration with the Society of Atherosclerosis Imaging and Prevention and the Society of Cardiovascular Computed Tomography. J Am Coll Cardiol. 2007;49:378–402. doi: 10.1016/j.jacc.2006.10.001. [DOI] [PubMed] [Google Scholar]
- 5.Budoff MJ, Hokanson JE, Nasir K, Shaw LJ, Kinney GL, Chow D, Demoss D, Nuguri V, Nabavi V, Ratakonda R, Berman DS, Raggi P. Progression of coronary artery calcium predicts all-cause mortality. JACC Cardiovasc Imaging. 2010;3:1229–1236. doi: 10.1016/j.jcmg.2010.08.018. [DOI] [PubMed] [Google Scholar]
- 6.Erbel R, Lehmann N, Möhlenkamp S, Churzidse S, Bauer M, Kälsch H, Schmermund A, Moebus S, Stang A, Roggenbuck U, Bröcker-Preuss M, Dragano N, Weimar C, Siegrist J, Jöckel KH Heinz Nixdorf Recall Study Investigators. Subclinical coronary atherosclerosis predicts cardiovascular risk in different stages of hypertension: result of the Heinz Nixdorf Recall Study. Hypertension. 2012;59:44–53. doi: 10.1161/HYPERTENSIONAHA.111.180489. [DOI] [PubMed] [Google Scholar]
- 7.Erbel R, Lehmann N, Churzidse S, Möhlenkamp S, Moebus S, Mahabadi AA, Schmermund A, Stang A, Dragano N, Grönemeyer D, Seibel R, Kälsch H, Bauer M, Bröcker-Preuss M, Mann K, Jöckel KH Heinz Nixdorf Recall Study Investigators. Gender-specific association of coronary artery calcium and lipoprotein parameters: The Heinz Nixdorf Recall Study. Atherosclerosis. 2013;229:531–540. doi: 10.1016/j.atherosclerosis.2013.04.015. [DOI] [PubMed] [Google Scholar]
- 8.Baigent C, Keech A, Kearney PM, Blackwell L, Buck G, Pollicino C, Kirby A, Sourjina T, Peto R, Collins R, Simes R Cholesterol Treatment Trialists’ (CTT) Collaborators. Efficacy and safety of cholesterol-lowering treatment: prospective meta-analysis of data from 90,056 participants in 14 randomised trials of statins. Lancet. 2005;366:1267–1278. doi: 10.1016/S0140-6736(05)67394-1. [DOI] [PubMed] [Google Scholar]
- 9.Arad Y, Spadaro LA, Roth M, Newstein D, Guerci AD. Treatment of asymptomatic adults with elevated coronary calcium scores with atorvastatin, vitamin C, and vitamin E: The St. Francis Heart Study randomized clinical trial. J Am Coll Cardiol. 2005;46:166–172. doi: 10.1016/j.jacc.2005.02.089. [DOI] [PubMed] [Google Scholar]
- 10.Raggi P, Davidson M, Callister TQ, Welty FK, Bachmann GA, Hecht H, Rumberger JA. Aggressive versus moderate lipid-lowering therapy in hypercholesterolemic postmenopausal women: Beyond Endorsed Lipid Lowering with EBT Scanning (BELLES) Circulation. 2005;112:563–571. doi: 10.1161/CIRCULATIONAHA.104.512681. [DOI] [PubMed] [Google Scholar]
- 11.Houslay ES, Cowell SJ, Prescott RJ, Reid J, Burton J, Northridge DB, Boon NA, Newby DE Scottish Aortic Stenosis and Lipid Lowering Therapy, Impact on Regression trial Investigators. Progressive coronary calcification despite intensive lipid-lowering treatment: a randomised controlled trial. Heart. 2006;92:1207–1212. doi: 10.1136/hrt.2005.080929. [DOI] [PMC free article] [PubMed] [Google Scholar]
- 12.Schmermund A, Achenbach S, Budde T, Buziashvili Y, Förster A, Erbel R. Effect of intensive versus standard lipid-lowering treatment with multicenter, randomized, double-blind trial.atorvastatin on the progression of calcified coronary atherosclerosis over 12 months: multicenter, randomized, double-blind trial. Circulation. 2006;113:427–437. doi: 10.1161/CIRCULATIONAHA.105.568147. [DOI] [PubMed] [Google Scholar]
- 13.Schmermund A, Lehmann N, Bielak LF, Yu P, Yu P, Yu P, Sheedy PF, II, Cassidy-Bushrow AE, Turner ST, Moebus S, Möhlenkamp S, Stang A, Mann K, Jöckel KH, Erbel R, Peyser PA. Comparison of subclinical coronary atherosclerosis and risk factors in unselected populations in Germany and US-America. Atherosclerosis. 2007;195:e207–e216. doi: 10.1016/j.atherosclerosis.2007.04.009. [DOI] [PMC free article] [PubMed] [Google Scholar]
- 14.McClelland RL, Chung H, Detrano R, Post W, Kronmal RA. Distribution of coronary artery calcium by race, gender, and age: results from the Multi-Ethnic Study of Atherosclerosis (MESA) Circulation. 2006;113:30–37. doi: 10.1161/CIRCULATIONAHA.105.580696. [DOI] [PubMed] [Google Scholar]
- 15.Cassidy-Bushrow AE, Bielak LF, Sheedy PF, 2nd, Turner ST, Kullo IJ, Lin X, Peyser PA. Coronary artery calcification progression is heritable. Circulation. 2007;116:25–31. doi: 10.1161/CIRCULATIONAHA.106.658583. [DOI] [PubMed] [Google Scholar]
- 16.Leopold JA. Vascular calcification. An age-old problem of old age. Circulation. 2013;127:2380–2382. doi: 10.1161/CIRCULATIONAHA.113.003341. [DOI] [PMC free article] [PubMed] [Google Scholar]
- 17.Lehmann N, Möhlenkamp S, Mahabadi AA, Schmermund A, Roggenbuck U, Seibel R, Grönemeyer D, Budde T, Dragano N, Stang A, Mann K, Moebus S, Erbel R, Jöckel KH. Effect of smoking and other traditional risk factors on the onset of coronary artery calcification: results of the Heinz Nixdorf recall study. Atherosclerosis. 2014;232:339–345. doi: 10.1016/j.atherosclerosis.2013.11.045. [DOI] [PubMed] [Google Scholar]
- 18.Stang A, Moebus S, Dragano N, Beck EM, Möhlenkamp S, Schmermund A, Siegrist J, Erbel R, Jöckel KH. Baseline recruitment and analyses of nonresponse of the Heinz Nixdorf Recall Study: identifiability of phone numbers as the major determinant of response. Eur J Epidemiol. 2005;20:489–496. doi: 10.1007/s10654-005-5529-z. [DOI] [PubMed] [Google Scholar]
- 19.Erbel R, Möhlenkamp S, Moebus S, Schmermund A, Lehmann N, Stang A, Dragano N, Grönemeyer D, Seibel R, Kälsch H, Bröcker-Preuss M, Mann K, Siegrist J, Jöckel KH Heinz Nixdorf Recall Study Investigative Group. Coronary risk stratification, discrimination, and reclassification improvement based on quantification of subclinical coronary atherosclerosis: the Heinz Nixdorf Recall study. J Am Coll Cardiol. 2010;56:1397–1406. doi: 10.1016/j.jacc.2010.06.030. [DOI] [PubMed] [Google Scholar]
- 20.Jöckel KH, Lehmann N, Jaeger BR, Moebus S, Möhlenkamp S, Schmermund A, Dragano N, Stang A, Grönemeyer D, Seibel R, Mann K, Volbracht L, Siegrist J, Erbel R. Heinz Nixdorf Recall Study Investigative Group. Smoking cessation and subclinical atherosclerosis--results from the Heinz Nixdorf Recall Study. Atherosclerosis. 2009;203:221–227. doi: 10.1016/j.atherosclerosis.2008.05.041. [DOI] [PubMed] [Google Scholar]
- 21.Moebus S, Stang A, Möhlenkamp S, Dragano N, Schmermund A, Slomiany U, Hoffmann B, Bauer M, Broecker-Preuss M, Mann K, Siegrist J, Erbel R, Jöckel KH Heinz Nixdorf Recall Study Group. Association of impaired fasting glucose and coronary artery calcification as a marker of subclinical atherosclerosis in a population-based cohort--results of the Heinz Nixdorf Recall Study. Diabetologia. 2009;52:81–89. doi: 10.1007/s00125-008-1173-y. [DOI] [PubMed] [Google Scholar]
- 22.Erbel R, Delaney JA, Lehmann N, McClelland RL, Möhlenkamp S, Kronmal RA, Schmermund A, Moebus S, Dragano N, Stang A, Jöckel KH, Budoff MJ Multi-Ethnic Study of Atherosclerosis; Investigator Group of the Heinz Nixdorf Recall Study. Signs of subclinical coronary atherosclerosis in relation to risk factor distribution in the Multi-Ethnic Study of Atherosclerosis (MESA) and the Heinz Nixdorf Recall Study (HNR) J Eur Heart. 2008;29:2782–2791. doi: 10.1093/eurheartj/ehn439. [DOI] [PMC free article] [PubMed] [Google Scholar]
- 23.Kronmal RA, McClelland RL, Detrano R, Shea S, Lima JA, Cushman M, Bild DE, Burke GL. Risk factors for the progression of coronary artery calcification an asymptomatic subjects: results from the Multi-Ethnic Study of Atherosclerosis (MESA) Circulation. 2007;115:2722–2730. doi: 10.1161/CIRCULATIONAHA.106.674143. [DOI] [PubMed] [Google Scholar]
- 24.Allam AH, Thompson RC, Wann LS, Miyamoto MI, Nur El-Din Ael-H, El-Maksoud GA, Al-Tohamy Soliman M, Badr I, El-Rahman Amer HA, Sutherland ML, Sutherland JD, Thomas GS. Atherosclerosis in ancient Egyptian mummies: the Horus study. JACC Cardiovasc Imaging. 2011;4:315–327. doi: 10.1016/j.jcmg.2011.02.002. [DOI] [PubMed] [Google Scholar]
- 25.Thompson RC, Allam AH, Lombardi GP, Wann LS, Sutherland ML, Sutherland JD, Soliman MA, Frohlich B, Mininberg DT, Monge JM, Vallodolid CM, Cox SL, Abd el-Maksoud G, Badr I, Miyamoto MI, el-Halim Nur el-Din A, Narula J, Finch CE, Thomas GS. Atherosclerosis across 4000 years of human history: the Horus study of four ancient populations. Lancet. 2013;381:1211–1222. doi: 10.1016/S0140-6736(13)60598-X. [DOI] [PubMed] [Google Scholar]
- 26.Bild DE, Detrano R, Peterson D, Guerci A, Liu K, Shahar E, Ouyang P, Jackson S, Saad MF. Ethnic differences in coronary calcification: the Multi-Ethnic Study of Atherosclerosis (MESA) Circulation. 2005;111:1313–1320. doi: 10.1161/01.CIR.0000157730.94423.4B. [DOI] [PubMed] [Google Scholar]
- 27.Siffert W, Rosskopf D, Siffert G, Busch S, Moritz A, Erbel R, Sharma AM, Ritz E, Wichmann HE, Jakobs KH, Horsthemke B. Association of a human G-protein beta3 subunit variant with hypertension. Nat Genet. 1998;18:45–48. doi: 10.1038/ng0198-45. [DOI] [PubMed] [Google Scholar]
- 28.Siffert W, Forster P, Jöckel K-H, Mvere DA, Brinkmann B, Naber C, Crookes R, Du P, Heyns A, Epplen JT, Fridey J, Freedman BI, Müller N, Stolke D, Sharma AM, Al Moutaery K, Grosse-Wilde H, Buerbaum B, Ehrlich T, Ahmad HR, Horsthemke B, Du Toit ED, Tiilikainen A, Ge J, Wang Y, Rosskopf D. Worldwide ethmic distribution of the G protein ß3 subunit 826T allele and its association with obesity in Caucasian, Chinese, and Black African Individuals. J Am Soc Nephrol. 1999;10:1921–1930. doi: 10.1681/ASN.V1091921. [DOI] [PubMed] [Google Scholar]
- 29.Kiramijyan S, Ahmadi N, Isma'eel H, Flores F, Shaw LJ, Raggi P, Budoff MJ. Impact of coronary artery calcium progression and statin therapy on clinical outcome in subjects with and without diabetes mellitus. Am J Cardiol. 2013;111:356–361. doi: 10.1016/j.amjcard.2012.09.033. [DOI] [PubMed] [Google Scholar]
- 30.Quercioli A, Montecucco F, Pataky Z, Thomas A, Ambrosio G, Staub C, Di Marzo V, Ratib O, Mach F, Golay A, Schindler TH. Improvement in coronary circulatory function in morbidly obese individuals after gastric bypass-induced weight loss: relation to alterations in endocannabinoids and adipocytokines. Eur Heart J. 2013;34:2063–2073. doi: 10.1093/eurheartj/eht085. [DOI] [PubMed] [Google Scholar]
- 31.Okwuosa TM, Greenland P, Burke GL, Eng J, Cushman M, Michos ED, Ning H, Lloyd-Jones DM. Prediction of coronary artery calcium progression in individuals with low Framingham Risk Score: the Multi-Ethnic Study of Atherosclerosis. JACC Cardiovasc Imaging. 2012;5:144–153. doi: 10.1016/j.jcmg.2011.11.008. [DOI] [PMC free article] [PubMed] [Google Scholar]
- 32.Reinsch N, Mahabadi AA, Lehmann N, Möhlenkamp S, Hoefs C, Sievers B, Budde T, Seibel R, Jöckel KH, Erbel R. Comparison of dual-source and electron-beam CT for the assessment of coronary artery calcium scoring. Br J Radiol. 2012;85:e300–e306. doi: 10.1259/bjr/91904659. [DOI] [PMC free article] [PubMed] [Google Scholar]
- 33.Erbel R, Möhlenkamp S, Kerkhoff G, Budde T, Schmermund A. Non-invasive screening for coronary artery disease: calcium scoring. Heart. 2007;93:1620–1629. doi: 10.1136/hrt.2005.071258. [DOI] [PMC free article] [PubMed] [Google Scholar]
- 34.Möhlenkamp S, Erbel R. Prognostic significance of coronary calcification in asymptomatic persons. Münch Med Wschr, Fortschr Med. 2007;149:38–40. [PubMed] [Google Scholar]
- 35.Erbel R, Budoff M. Improvement of cardiovascular risk prediction using coronary imaging: subclinical atherosclerosis: the memory of lifetime risk factor exposure. Eur Heart J. 2012;33:1201–1213. doi: 10.1093/eurheartj/ehs076. [DOI] [PubMed] [Google Scholar]
- 36.Budoff M, Budoff MJ, Möhlenkamp S, McClelland R, Delaney JA, Bauer M, Jöckel HK, Kälsch H, Kronmal R, Nasir K, Lehmann N, Moebus S, Mukamal K, Erbel R Multi-Ethnic Study of Atherosclerosis and the Investigator Group of the Heinz Nixdorf RECALL Study. A comparison of outcomes with coronary artery calcium scanning in unselected populations: the Multi-Ethnic Study of Atherosclerosis (MESA) and Heinz Nixdorf RECALL study (HNR) J Cardiovasc Comput Tomogr. 2013;7:182–191. doi: 10.1016/j.jcct.2013.05.009. [DOI] [PMC free article] [PubMed] [Google Scholar]