Abstract
Currently there is an explosive increase of the next-generation sequencing (NGS) projects and related datasets, which have to be processed by Quality Control (QC) procedures before they could be utilized for omics analysis. QC procedure usually includes identification and filtration of sequencing artifacts such as low-quality reads and contaminating reads, which would significantly affect and sometimes mislead downstream analysis. Quality control of NGS data for microbial communities is especially challenging. In this work, we have evaluated and compared the performance and effects of various QC pipelines on different types of metagenomic NGS data and from different angles, based on which general principles of using QC pipelines were proposed. Results based on both simulated and real metagenomic datasets have shown that: firstly, QC-Chain is superior in its ability for contamination identification for metagenomic NGS datasets with different complexities with high sensitivity and specificity. Secondly, the high performance computing engine enabled QC-Chain to achieve a significant reduction in processing time compared to other pipelines based on serial computing. Thirdly, QC-Chain could outperform other tools in benefiting downstream metagenomic data analysis.
Next-generation sequencing (NGS) technologies have become common practice in life science1. Benefited by NGS technologies, research on microbial communities (also referred to as metagenomics) has been revolutionized and accelerated to describe the taxonomical and functional analysis of the collective microbial genomes contained in an environmental sample2.
The very first step of NGS data processing is quality control (QC), yet even this step still faces the limitations in speed as well as difficulties in contamination screening. Metagenomic data, which is composed of NGS data from multiple genomes (usually unknown in advance), faces a more serious problem if data QC could not be performed accurately and efficiently.
Raw metagenomic NGS reads might include different types of sequencing artifacts, such as low quality reads and contaminating reads: (1) Low sequencing-quality reads can significantly compromise downstream analyses. They are the results from imperfect sequencing instrument property and sample preparation experiments such as emPCR3. Quality filtering can vastly improve the accuracy of microbial diversity from metagenomic sequencing4. (2) Contaminations caused by impure samples or unsuccessful sample preparation, may introduce genomes other than microbes in the metagenomic samples. For metagenomic data, high eukaryotic species are usually considered as contaminations, which have to be identified and filtered before further analyses to prevent the erroneous results and conclusions. In addition, it is also possible for metagnomic data to contain contaminating sequences from other microbial communities.
Currently, there are several QC toolkits that could perform metagenomic data quality control. Some representative QC tools include: (1) FastQC (http://www.bioinformatics.babraham.ac.uk/projects/fastqc/), which can evaluate multiple aspects of the raw sequencing data quality, such as per base quality, per base GC content and sequence length distribution. It provides the user a quick overview of whether the data has any problems, which is useful for a rough assessment of the data quality. (2) Fastx-Toolkit (http://hannonlab.cshl.edu/fastx_toolkit/), which is a collection of command line tools for short-reads FASTA/FASTQ files preprocessing, including read length trimming, identical reads collapsing, adapter removing, format converting, etc. (3) PRINSEQ5, which provides more detailed options for some quality control functions. For example, for the duplication filtration, it can trim either exact duplicates or 5′/3′ duplicates. (4) NGS QC Toolkit6, which is another toolkit for NGS data quality control, comprised of tools for QC of sequencing data generated using Roche 454 and Illumina platforms.
However, most of current available tools have some functional limitations in the QC process. For example, FastQC, Fastx-Toolkit, PRINSEQ and NGS QC Toolkit cannot identify de novo contaminating sources, which are usually not available in advance. Moreover, the processing speed of them has become another bottleneck in handling large amounts of NGS data. We previously reported QC-Chain, a fast and holistic NGS data QC package, which can perform fast and de novo contamination screening on NGS genomic data7. Here we compared and evaluated the QC performance of different QC tools for metagenomic data in aspects of accuracy, efficiency and functions. The QC effect of these methods was also assessed on several real and simulated metagenomic data.
Methods
QC tools
Several publicly available NGS data QC tools, including QC-Chain, FastQC, Fastx_Toolkit, NGS QC Toolkit and PRINSEQ were compared in terms of function, accuracy and speed using simulated and real sequencing data. Their QC effect was evaluated by downstream analysis, including metagenomic assembly using IDBA_UD8 and functional annotation using MG-RAST9 with default parameters.
Datasets and Experiments
To assess the performance of the QC tools, both real and simulated metagenomic datasets were used. To generate the simulated data, all reference genomes were downloaded from NCBI (http://www.ncbi.nlm.nih.gov/) and all simulated datasets were obtained by DWGSIM 0.1.8 (https://github.com/nh13/DWGSIM) from the microbial and eukaryotic reference genomes. Pair-ended sequences were created with an insert-size of 500 bp between two ends, an average error rate of 1% and read length of 70–100 bp.
A total of three simulated datasets and two real sequencing dataset were generated (Table 1), with details described as below.
Table 1. Summary of metagenomic datasets used in this study.
| Dataset | Type | # data | Feature | Purpose of test |
|---|---|---|---|---|
| Dataset A | Simulated | 3 | Data with different number of contaminating high eukaryotic species | Accuracy and efficiency of QC-Chain in contamination screening |
| Dataset B | Real | 4 | Data with sequencing artifacts | Efficiency of QC-Chain in read-quality assessment and trimming |
| Dataset C | Real | 3 | Data with different data sizes | Comparison of the speed of different QC tools in read quality assessment and trimming |
| Dataset D | Simulated | 1 | Data for functional analysis | Comparison of the QC effect of different QC tools based on downstream analysis |
| Dataset E | Simulated | 3 | Data with metagenomic contaminations | Evaluation of QC-Chain in meta-meta contamination screening |
Dataset A (simulated dataset)
Dataset A contains three simulated metagenomic data, which were designed to contain fixed diversity of targeting metagenome (involving 10 bacterial genomes) and different number of contaminating species (2, 10 and 15 high eukaryotic genomes), named 2C/10T, 10C/10T and 15C/10T, respectively (Here C and T represent “contaminating and targeting genome”, respectively). These datasets simulated contaminations with different complexity (different number of contaminating genomes and different proportions) and were used to evaluate both the accuracy and efficiency of contamination screening functionality. Specifically, ten microbial genomes, including Clostridium thermocellum, E.coli, Actinomyces naeslundii, Fusobacterium nucleatum, Thermoanaerobacter ethanolius, Porphyromonas gingivalis, Bacteroides salanitronis, Streptococcus mitis, Streptococcus sanguinis and Streptococcus oralis were used as microbial genomes in metagenomic sample, together with some high eukaryotic reference genomes as contaminations. The eukaryotic genomes were selected randomly and cover various phylogenetic distinct species, including human, plant, algae, insect, etc. Details of the dataset A are listed in Table S1 in supporting information File S1.
Dataset B (real saliva microbiota dataset)
Real data usually have multiple sequencing artifacts, therefore, dataset B, which contains four real sequencing data was used to assess the effectiveness of QC-Chain in read-quality assessment and trimming. Human saliva DNA samples from four persons were sequenced by Illumina Hiseq 2000 with average read length of 100 bp and pair end insert size of 400 bp. Details of the dataset B are listed in Table S2 in supporting information File S1.
Dataset C (real dataset with different sizes)
Dataset C contains three real sequencing data (c1, c2 and c3) with different data size of 2.2 G, 5.9 G and 14.0 G, respectively. The DNA was sampled from human saliva and the dataset was used to compare the speed of different QC tools in read quality trimming. Details of the dataset C are listed in Table S3 in supporting information File S1.
Dataset D (simulated dataset with genomic data as contamination)
Dataset D was generated to simulate human oral community with 13 bacterial genomes at the sequencing coverage of 20X. Reads simulated from human genome were integrated as contaminations. It was used to evaluate the QC effect based on downstream functional analysis. Details of the dataset D are listed in Table S4 in supporting information File S1.
Dataset E (simulated meta-meta dataset)
For metagenomic samples, in addition to contaminating genomes from high eukaryotic species, sequences from other microbial community is another possible contamination (also referred to as “meta-meta contamination”). Dataset E contains three simulated data (e1, e2 and e3) by mixing contaminating metagenomic data into targeting metagenomic data (the metagenomic data as research objective). The targeting data used the same simulated human oral community as dataset D at different sequencing coverage of 20X, 14X and 6X, respectively, and the contaminating data simulated human gut environment with 12 bacterial genomes at the sequencing coverage of 2X. Details of the dataset E are listed in Table S5 in supporting information File S1.
All of the experiments were performed on a rack server with Intel dual Xeon E5-2650 CPU (2.0 GHz, 16 cores in total, supporting 32 threads), 64 GB DDR3 ECC RAM and 2 TB HDD (Hard Disk Drive).
Measurements: Sensitivity and Specificity of contamination screening
For metagenomic data, high eukaryotic species are usually identified as contaminations. We measured the sensitivity (True Positive Rate, TPR) and specificity to evaluate the classification performance of QC tools in contaminating species (Formula 1 and Formula 2). Here, species that were classified to those involved in the simulated data were considered as true positive (TP). Species that were identified by QC tool, but not involved in the simulated data were considered as false positive (FP). All eukaryotic species involved in the designed simulated data were considered as ground truth (GT).
 |
 |
Specifically, among the assessed QC tool, only QC-Chain could provide the functionality of contamination identification and genomic contaminating species is identified based on 18S rRNA sequences. The proportion of aligned 18S reads to a species was closely associated with the identity of this species: larger proportion of aligned 18S reads would usually indicate better identification of the species. However, false identifications might arise from the erroneous 18S alignment. Therefore, we set different threshold of “alignment proportion” (defined as the proportion of 18S reads identified from a specific species out of all identified 18S reads by QC-Chain) to test the accuracy of contamination identification. The sensitivity and specificity were calculated with alignment proportion threshold of 0.5%, 1%, 2%, 3% and 4%, respectively.
Measurements: Efficiency
The assessment of QC efficiency consisted of two aspects: (1) the efficiency of quality assessment and trimming, which was performed on real sequencing data (Dataset B) and (2) the efficiency of contamination screening, which was performed on simulated data (Dataset A). Speed of the tested QC tools was compared based on Dataset C, which includes three data with different data sizes. Parameters for the efficiency assessment included base trim to read length of 90 bp, quality filtration to only keep reads that contain 90% of high quality bases (quality score is greater than 20 in Sanger scale), duplication trim, tag sequences filtration and pair-end information retrieval.
To evaluate the detailed efficiency of QC-Chain on different number of CPU cores, we configured the number of thread to be 1, 4, 8, 16, 24 and 32, respectively.
Pilot experiment of meta-meta contamination screening
For metagenomic data, sequence from other microbial community could be possible contamination as well (meta-meta contamination). For meta-meta contamination screening, QC-Chain identified the species in the mixed data based on 16S/18S rRNA by BLAST (http://blast.ncbi.nlm.nih.gov/) based read alignment. Since the coverage of the targeting genomes was usually significantly higher than contaminating genomes, QC could remove the reads identified from low coverage genomes by BLAST, which had high possibility for being contaminating sequences.
Results and Discussion
In this section we have firstly evaluated the performance of QC-Chain, including accuracy and efficiency. Then we have compared the functions and features of different QC tools. The effects of QC on downstream analyses have then been evaluated. Finally the results on screening and removal of meta-meta contaminations have been assessed.
1. Evaluation of the performance of QC-Chain
(1) Accuracy for contamination screening
Here as QC function of contamination screening is only provided in QC-Chain, we have assessed the contamination screening accuracy and efficiency of QC-Chain. The assessments were performed using simulated data (Dataset A), since the background information of simulated datasets, such as the source species of simulated genomes, read length, coverage, and proportion of reads from each source genome is clear.
Sensitivity (TPR)
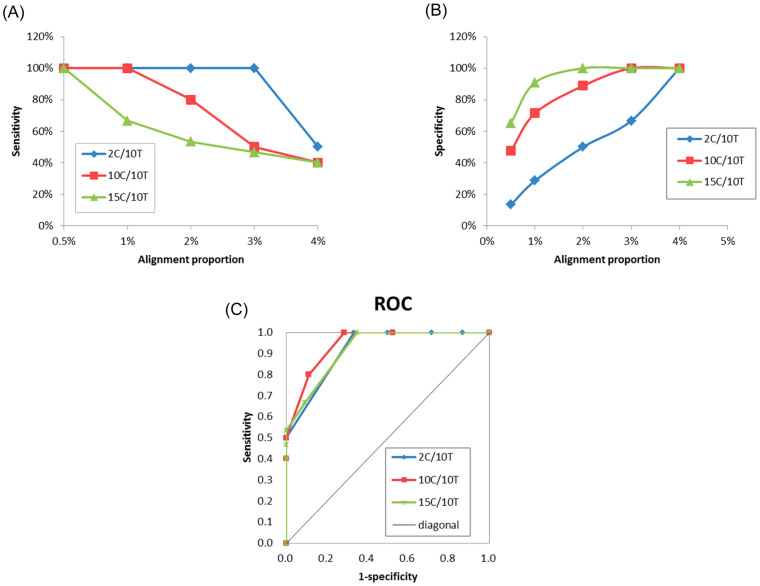
TPR measured the proportion of actual positives, which were correctly identified as such. Generally, under the lowest alignment proportion of 0.5%, the sensitivities for contamination identification of QC-Chain for all the three simulated datasets were as high as 100% (Figure 1(A)). For 2C/10T, which involved two eukaryotic contaminating species, the identification sensitivity remained high at 100% from threshold 0.5% to 3%. For the simulated data with more contaminating species (10C/10T and 15C/10T), all the contaminating species can be identified (TPR = 100%) under a relatively low threshold (0.5 ~ 1% for 10C/10T and 0.5% for 15C/10T) (Figure 1(A)). Therefore, QC-Chain was able to identify all true contamination species in datasets with both few (such as 2C/10T) and many (such as 10C/10T and 15C/10T) of eukaryotic species as contaminations. However, with the increase of alignment proportion threshold, the sensitivity decreased yet showed different decreasing patterns (with turning points at 1% or 3% alignment proportion) based on different simulated datasets (Figure 1(A)).
Figure 1. Accuracy of contamination screening by QC-Chain.
(A) Sensitivity. (B) Specificity. (C) ROC curve. Simulated Dataset A with 2, 10 and 15 contaminating species (2C/10T, 10C/10T and 15C/10T, refer to Table S1 in supporting information File S1) was used as the testing data.
The varying sensitivity was rational. When generating the simulated datasets, the contaminating species with different genome size were randomly selected. For example, in 2C/10T, the genome size of Chlamydomonas reinhardtii is approximately 120 Mbp, while that of the Homo sapiens is as large as 3 Gbp. Therefore, even when generating the simulated reads from each genome using different coverage (0.3× for human and 2× for Chlamydomonas), the absolute number of both the total reads and 18S reads for each species would significantly differ (Table S1 in supporting information File S1). The larger genome size, the fewer 18S reads in the simulated data. Consequently, when the alignment proportion was higher than the proportion of 18S reads of a species, species was filtered and cannot be successfully identified as contaminating species. In 2C/10T, the proportion of 18S reads from Chlamydomonas was approximately 3%. Therefore, when the alignment proportion was set to be 4%, the algae cannot be identified. Similarly, for 10C/10T and 15C/10T, species whose 18S reads proportion was lower than the alignment proportion was filtered, which lead to the decrease of TPR with the increase of alignment proportion.
Specificity
Specificity was used to measure the proportion of the number of true positives out of all the number of identified species by QC-Chain. Generally, the specificity increased with the improvement of alignment proportion. Specifically, for an alignment proportion of 2%, the specificity was 100% for 15C/10T and 88.9% for 10C/10T, respectively. When the alignment proportion was equal to or higher than 3%, the 18S reads were 100% correctly identified with no false positive (Figure 1(B)). In 2C/10T, under the same alignment proportion, the specificity was lower than that of 10C/10T and 15C/10T. Nevertheless, 100% specificity was observed when the alignment proportion was set to 4% (Figure 1(B)).
The primary reason for the lower (than 100%) specificity under certain alignment proportions was the false identifications for 18S reads. It was possible that some of the 18S reads were randomly classified to species sharing similarity on 18S sequences. Theoretically, the false identified species could be filtered by alignment proportion threshold. Therefore, 100% specificity was observed with the alignment proportion of 4% for all the three simulated datasets. However, when the 18S sequences of different species were in high identity, due to the limitation of currently available alignment algorithm that could be employed by QC-Chain, some reads were misclassified. Under certain conditions, the users have to manually exclude some species with highly identical 18S sequence to that of the plausible contaminating species. For example, it was difficult to exactly distinguish human and mouse by 18S sequences alignment, since they have 99% identity in 18S sequences. Therefore, to reduce false identification, we excluded mouse 18S sequences from the reference database and thus removed the interferences from mouse genome. In real case, such discrimination relies on the users' information on both sample background and sequencing experiment environment, under which circumstances contaminations might be induced.
Receiver operating characteristic (ROC) curve
To further evaluate the accuracy of QC-Chain in discrimination of contaminating species, ROC curves were plotted based on the sensitivity and (1-specificity) of the three simulated datasets (Figure 1(C)). The area under the ROC curve (AUC) is an important index for measuring the performance of a classification. The larger the AUC, the better was overall performance of the test to correctly discriminate the contaminating and targeting sequencing species10. For 10C/10T, the AUC was approximately 0.89, indicating well and close to excellent discrimination of contaminating species (Figure 1(C)). For 2C/10T and 15C/10T, both the AUC were approximately 0.75 (Figure 1(C)), which suggested a less accurate discrimination than that for 10C/10T, but was still rational for identification of contaminating species. These results were also consistent with those sensitivity and specificity analyses.
(2) Efficiency analysis
High performance computing for read-quality assessment and trimming by QC-Chain
Generally, real sequencing data may encounter various read quality issues, such as low quality bases, poor quality reads and tag sequences. Besides, the information about potential contaminating species is usually not available. Therefore, we evaluated the efficiency of QC-Chain in read-quality assessment and trimming with real sequencing data. All real data of Dataset B (Table S2 in supporting information File S1) were processed for read-quality assessment and trimming.
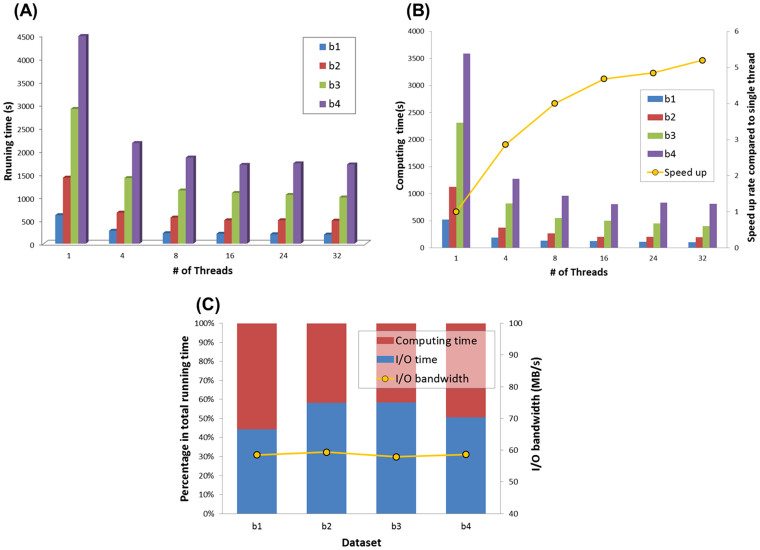
From the analysis of total running times, we observed that for an input data with size of 30 GB, QC-Chain could complete all quality assessment and trimming process within 30 minutes (exact running time was 28m30.14 s). The speed up (>4 times) of parallel computation using 16 threads compared to the time cost based on single thread was very significant (Figure 2(A)); However, speed up based on using more threads seemed to have little boost compared to thread number of 16.
Figure 2. Running time of read-quality assessment and trimming by QC-Chain.
(A) The total running time. (B) Running time and speed up of data computing in RAM. (C) I/O operations time cost based on 32-core threads computing. Real sequencing Dataset B (refer to Table S2 in supporting information File S1) was used as the testing data.
Since the quality control computation was both computation-intensive and data-intensive, we focused on two different types of computation: (a) data computing in RAM, and (b) I/O operations for data loading and writing between RAM and HDD. Then we focused on the running time of these two different processes separately.
Speed up of parallel computing in RAM: Firstly we analyzed the speed up of parallel computing of the quality assessment and trimming (Figure 2(B)). From the results we found that there was a turning point in the average speed-up curve across the 4 datasets (indicated by yellow curve in Figure 2(B)) at thread-number of 16, where the speed up tended to be slowed-down. This was largely due to the reason that our CPU had 16 physical cores, and threads more than 16 will be rotated for scheduling thus would not significantly improve efficiency.
In the quality assessment and trimming steps, processes of base trimming, quality trimming and tag sequence trimming could all be completely in parallel, while duplication trimming could only be computed serially. Therefore, an average speed up of 5.2 times using 32 threads compared to the serial computing was observed among the 4 samples.
Efficient of I/O operations: We also checked the time consumption of I/O operations in this process. Considering that the time cost of I/O operations was same among different threads number, we only evaluated the I/O efficient of 32 threads computing and normalized the bar chart of 32 threads in Figure 2(B), and analyzed the ratio of computing and I/O operations compared to total running time (Figure 2(C)). Yellow curve indicated the I/O bandwidth between RAM and HDD, which was calculated by the average of input bandwidth (input data size/loading time) and output bandwidth (output data size/saving time), and the overall average I/O bandwidth of the 4 real datasets was 58.6 MB/s. From these results, we observed that the I/O operations cost more than 50 percent (also referred to as “I/O rate”, exact I/O rate is 52.91%) of the total computational time on average, indicating that I/O bandwidth limited the computing throughput for massive data.
High performance computing for contamination screening by QC-Chain
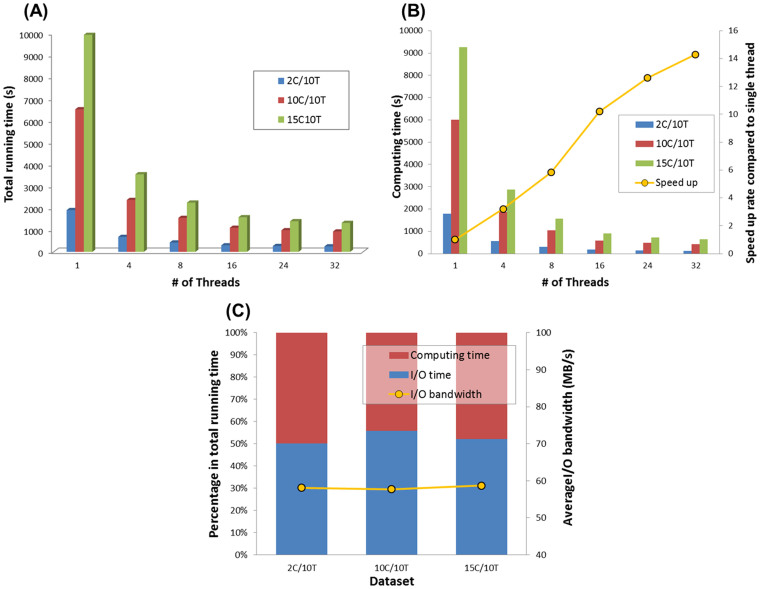
In the contamination screening part, 18S rRNA reads of each simulated data in Dataset A (Table S1 in supporting information File S1) were extracted and mapped to Silva 18S database11 to detect the contaminating species, respectively. The contamination screening on the simulated data 15C/10T (with 20 GB size) can be completed within 25 minutes (running time is 22m4.24s) (Figure 3(A)). We also separately tracked the time cost of data computing and I/O operations similar to those in the previous section.
Figure 3. Running time of contamination screening by QC-Chain.
(A) The total running time. (B) Running time and speed up of data computing in RAM. (C) I/O operations time cost rate of 32 threads computing. Simulated Dataset A (refer to Table S1 in supporting information File S1) was used as the testing data.
Speed up of parallel computing in RAM: For the computing time cost, the inflection point also appeared at the thread-number of 16 in the speed up rate curve (Figure 3(B), indicated by yellow) due to the same reason as the read-quality assessment and trimming. In the computing part of the contamination screening, all tasks can be parallelized to fully utilize the computing resources of multi-core CPU; therefore we got an average speed up of 14.3 on a 16 core CPU compared to the serial computing of contamination screening process with the 3 simulated datasets.
Efficient of I/O operations: Similar to the read-quality assessment and trimming, we evaluated the I/O efficient of 32 threads and showed the percentage of computing and I/O operations in Figure 3(C). Yellow curve showed the average I/O bandwidth was 58.2 M/s among the 3 datasets of Table S1 in supporting information File S1.
Moreover, since the I/O operations took high proportion of total running time in both the read-quality assessment and trimming (average “I/O rate” was 52.91%, Figure 2(C)), while the contamination screening (average “I/O rate” was 52.68%, Figure 3(C)), I/O operations was considered as the bottle-neck of QC-Chain due to the low bandwidth, which could be significantly improved up to 300 M/s by replacing HDD to SSD (Solid State Disk) to accelerate the I/O operation more than 5 times.
2. Comparison of several QC tools
(1) Comparison of functionalities
QC-Chain, FastQC, Fastx_Toolkit, NGS QC Toolkit and PRINSEQ were compared in terms of functions. Most of the QC tools are easily configurable and can export the results in summary graphs and tables. However, they have some differences and limitations in functionalities.
FastQC is a classic and early publicly available QC tool, which aims to provide a QC report that can spot problems that originate either in the sequencer or in the starting library material. However, it lacks read/base processing functions such as length trimming, quality filtration and duplication filtration, thus compromises the QC effect on downstream analysis.
Fastx_Toolkit includes basic QC modules such as read length trimming, format converting, and they are easy-to-install and use. However, it lacks contamination screening functionality, and it has not released new updated version since Feb 2010.
NGS QC Toolkit is suitable for Roche 454 and Illumina platforms. However, similar to Fastx_Toolkit, it lacks contamination screening functionality, and it is complicated to use several scripts in this package when multiple QC procedures are required.
PRINSEQ provides more detailed options for some quality control functions. However, PRINSEQ lacks some essential QC functions such as tag sequence removal.
For another critical QC function of contamination screening, neither of FastQC, Fastx_Toolkit or NGS QC Toolkit can give the possible contaminating information12. PRINSEQ uses principal component analysis (PCA) to group metagenome samples based on dinucleotide abundances, thus it can help to investigate whether the correct metagenomic sample was sequenced from similar environments. However, as samples might be processed using different protocols or sequenced using different techniques, this feature should be used with caution. Moreover, it cannot provide accurate and detailed information of the contaminating species and thus cannot be used to identify genomic contamination. More comparison on function of these QC tools was shown in Table 2.
Table 2. Comparison of the main features of the Next Generation Sequencing data quality control tools.
| QC-Chain | PRINSEQ | NGS QC Toolkit | Fastx_Toolkit | FastQC | |
|---|---|---|---|---|---|
| Availablility | Scripts | Scripts; Web-based | Scripts | Scripts; Web-based | Scripts |
| Language | C++ | Perl | Perl | C++ | Java |
| Input file | FastQ, FastA | FastQ, FastA | FastQ, FastA | FastQ, FastA | FastQ, SAM, BAM |
| Output file | Text; graph | Text; graph | Text, graph, HTML file | Text; graph | Graph, HTML file |
| Operating system | Linux | Linux, Windows, MacOS, BSD, Solaris | Linux; Windows | Linux, MacOS, BSD, Solaris | Linux; Windows; MacOS |
| Parallel computing | multi-thread and multi CPU based | No | multi-thread and multi CPU based | No | No |
| Read-quality assessment and trimming | Yes | Yes | Yes | Yes | Only read- quality assessment |
| Contamination screening | de novo identification | No | No | No | No |
(2) Comparison of contamination screening
Due to huge data size and complex contamination scenario for high-throughput sequencing experiments, to our knowledge, there is no contamination screening function included in contemporary QC methods other than QC-Chain. A potential comparable contamination screening method is the brute-force approach: to annotate the reads by alignment method such as BLAST search, but it is very time-consuming. Currently, random reads selection (RRS) is widely used for contamination screening. The RRS method selects sequences from the original input file randomly with a set rate, and then maps those selected sequences to a reference database for contamination identification. Here we compared the contamination screening accuracy of RRS with QC-Chain. We set the RRS rate to be 0.01%, 0.1% and 1%, and used the NCBI NT (database date: May 07, 2014) as the reference database.
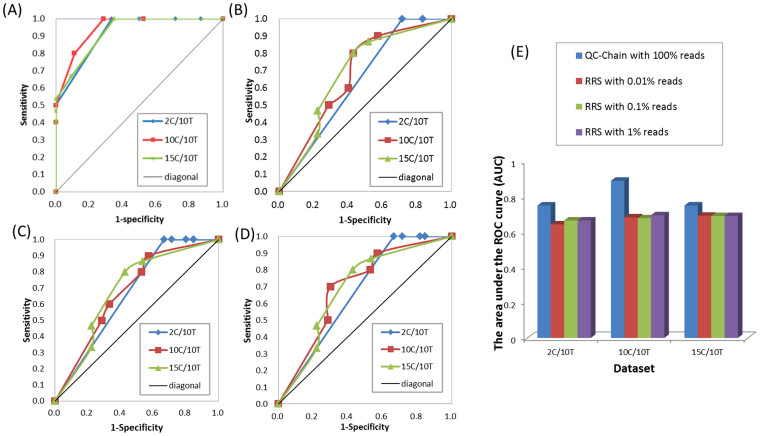
RRS method could also identify the contamination species with high sensitivity when the threshold was set to 0.5% and 1% in all samples (Figure S1 (A–C)). However, the false positive rate of RRS method were quite high, which made the specificity were significantly lower than QC-Chain (at threshold of 2%, the average specificity of 2C/10T was 18.28%, 10C/10T was 65.56% and 15C/10T was, 77.78%), and no 100% specificity was observed in all samples with any RRS rate and threshold of “alignment proportion” (Figure S1 (D–F)). We also calculated the AUC of RRS method with the 3 samples and compared to QC-Chain (Figure 4(A–D)). The average AUC of 3 RRS rate for 2C/10T, 10C/10T and 15C/10T was 0.66, 0.69 and 0.69, respectively (Figure 4), which indicated the much lower performance of contamination screening than QC-Chain (Figure 4(E)).
Figure 4. Comparison of contamination screening accuracy between QC-Chain and Random Reads Selection.
ROC curve of results by (A) QC-Chain (B) RRS with 0.01% reads. (C) RRS with 0.1% reads (D) RRS with 1% reads. (E) Comparison of AUC between QC-Chain and RRS. Simulated Dataset A with 2, 10 and 15 contaminating species (2C/10T, 10C/10T and 15C/10T, refer to Table S1 in supporting information File S1) was used as the testing data.
(3) Comparison of read-quality assessment and trimming
The performance of read-quality assessment and trimming by different tools was compared using the simulated dataset c2. Three general read-quality trimming procedures, including quality filtration, duplication removal and tag sequences filtration were selected to assess the effects of the tested QC tools (Figure 5). Both QC-Chain and Fastx_Toolkit completed all the three functions. NGS QC Toolkit removed low sequencing quality reads and tag sequences, but cannot filter duplications. PRINSEQ can remove duplications, but lacked the other two filtering functions. For different QC tools, there was slight difference in the number of removed reads of each step, because they applied different computational algorithm.
Figure 5. Comparison of read-quality assessment and trimming using different QC tools.
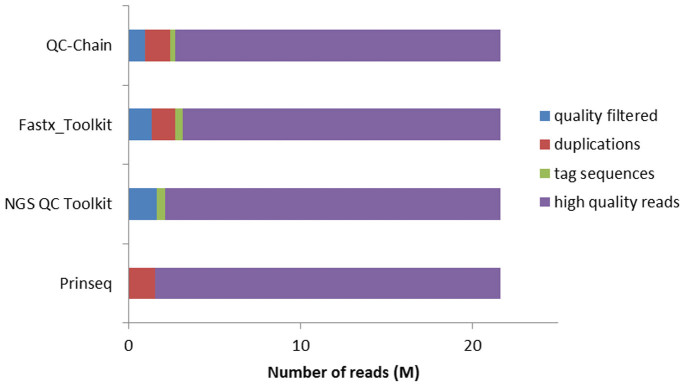
Real sequencing Dataset c2 (refer to Table S3 in supporting information File S1) was used as the testing data.
(4) Comparison of processing speed
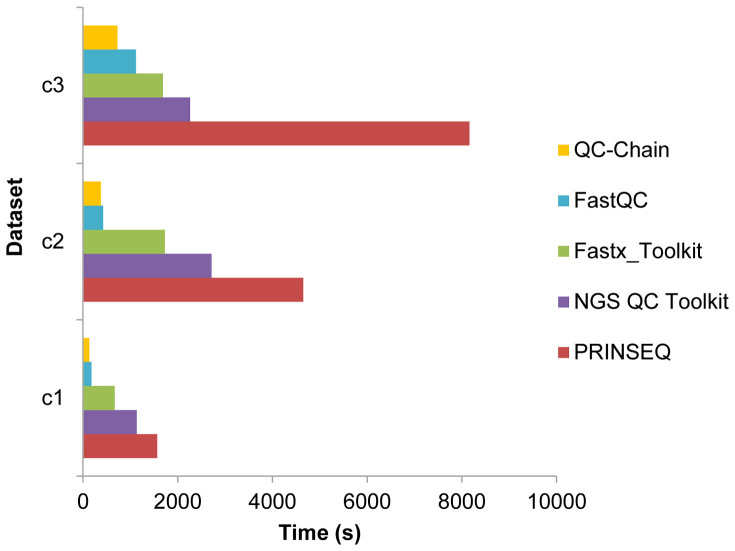
With the rapid increase in sequencing instrument throughput and data size, processing speed of bioinformatics tools has become another bottleneck for the metagenmoic data analysis. We compared the speed of different QC tools using Dataset C (Table S3 in supporting information File S1). QC-Chain was the fastest one among the testing tools, showing an average of 11.7 times faster than PRINSEQ, 6.2 times faster than NGS QC Toolkit and 5.0 times faster than Fastx_Toolkit (Figure 6).
Figure 6. Comparison of the speed of read-quality assessment and trimming using different QC tools.
Real sequencing Dataset C (refer to Table S3 in supporting information File S1), including three data with different sizes of 2.2G, 5.9G and 14.0G, was used as the testing data.
As the processing of each read (or read pairs) was independent, QC-Chain appointed weighted and balanced tasks, each including a suitable number of reads (which was dependent on both the total read number and the assigned CPU core number), to different threads, which were then processed on different CPU cores simultaneously and in parallel. In addition, all procedures were conducted with only one disk I/O operation, which significantly improved the efficiency of analysis, especially for huge dataset. Therefore, QC-Chain could serve as an efficient computational tool to enable fast NGS data QC. NGS QC Toolkit applies multiprocessing and multithreaded approaches as the parallel computing technology. However, similar to Fastx_Toolkit, NGS QC Toolkit realizes different QC functions using several separate scripts, therefore, the I/O operation took place in every step which may significantly prolong the whole running time. PRINSEQ did not apply parallel computing technology, therefore, its speed was very slow, especially when processing data with huge size. By FastQC, although only data quality evaluation (no read processing) procedure was executed, it was still slower than QC-Chain. In addition, only QC-Chain included contamination screening function. Therefore, considering the multiple QC functions, both the speed and efficiency of QC-Chain was apparently superior to other tools.
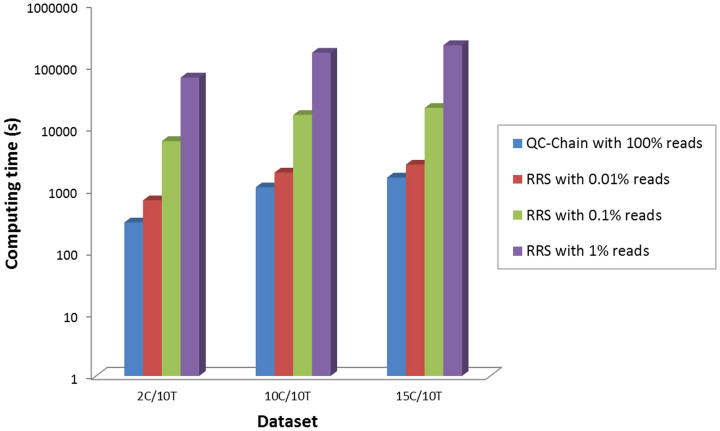
We also compared the running time of QC-Chain with random reads selection (RRS) for contamination screening with Dataset A (Table S1 in supporting information File S1). For the RRS method we used the same selection rate (which are 0.01%, 0.1% and 1%, respectively) and reference database as in the accuracy test, and also set the thread number to 16. From the results in Figure 7 we can observe that the RRS cost 60.15 hours to finish the contamination screening of data 15C10T with selection rate of 1%, while QC-Chain took less than 25 minutes. Thus QC-Chain was 1.87 times faster than the RRS with selection rate of 0.01% on average, 16.20 times faster than RRS with selection rate of 0.1% and 167.55 times faster than RRS when the selection rate was set to 1%.
Figure 7. Comparison of the speed of contamination screening.
The Y-axes was in 10-based-log scale. Simulated Dataset A (2C/10T, 10C/10T and 15C/10T, refer to Table S1 in supporting information File S1) was used as the testing data.
(5) Comparison of QC effects based on downstream analysis
Contamination is a frequently occurring and serious problem for NGS metagenomic data. For microbial community from human body or other species, it is common that reads from host could be sequenced in the sample. For metagenome from open environment, such as soil metagnome, the sample is easy to be contaminated by genomes from eukaryotic species that shares the living environment with them. In addition, contamination could also be induced during the metagenomic sample and sequencing library preparation processes. In most instances, people are not aware of whether there is contamination and what the contamination could be. Therefore, the de novo contamination screening is an absolutely necessary procedure of quality control. Unfortunately, none of the tested QC tools can help to give us such information, except QC-Chain. Dataset D (Table S4 in supporting information File S1), which simulated the human oral metagenomic data with some contaminating reads from human genome, was used to evaluate the effect of QC tools based on downstream analysis results. QC-Chain identified human as the main possible contaminating source by 18S rRNA classification, and removed the contaminating reads as many as possible.
Downstream analyses were performed with the simulated dataset D (pre-QC data, including simulated oral metagenomic and simulated human genomic sequences) and the post-QC data (data processed by QC tool). As a groundtruth, the pure simulated oral metagenomic data (referred to as “pure metagenomic data”) was also analyzed and compared. Notice that as only QC-Chain could perform contamination screening, results based on pre-QC data could be considered as the results from QC tools other than QC-Chain; results based on post-QC data were only produced by QC-Chain; while results based on “pure metagenomic data” could be considered as the control results.
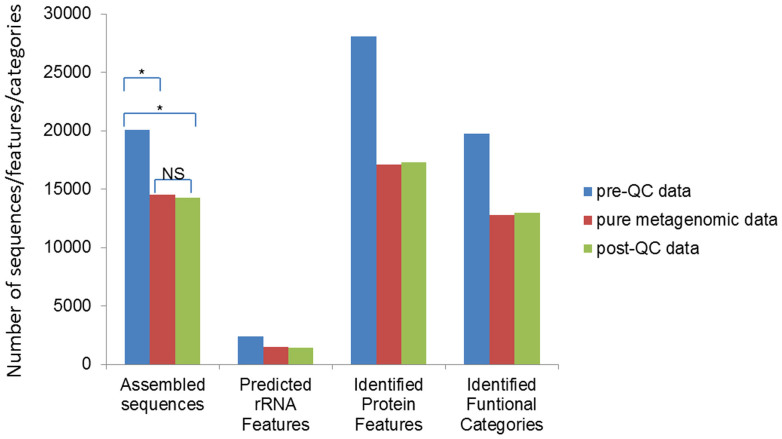
These three sets of data were assembled and then annotated by MG-RAST using the same pipeline, respectively. Significant differences of the assembled sequences, predicted rRNA features, identified protein features and identified functional categories were observed between pre-QC and post-QC data (t-test p-value = 0.030), as well as between pre-QC data and pure metagenomic data (t-test p-value = 0.028) by statistics analysis, while the difference between the post-QC data and pure metagenomic data were not significant (t-test p-value = 0.393) (Figure 8). Apparently, the QC process, specifically the contamination identification and removing process remarkably benefited the downstream analysis, ensuring a reliable analysis result obtained from the post-QC data. On the other hand, the results indicated that the metagneomic data, which may involve contaminating reads from high eukaryotic species cannot be directly used and must be checked by the contamination screening procedure to confirm its purity before further analysis.
Figure 8. Comparison of downstream analysis statistics of Dataset D before and after QC process by QC-Chain.
The sequences were assemble by IDBA_UD and annotated by MG-RAST. Simulated Dataset D (refer to Table S4 in supporting information File S1) was used as the testing data. *: significantly different (t-test p-value < 0.05); NS: not significantly different (t-test p-value > 0.05).
(6) Advanced functionality: Metagenomic contamination screening and filtration in metagenomic data
For metagenomic samples, contamination from metagenomic data (meta-meta contamination) is also a serious concern to the data quality, since they could directly affect the taxonomy analysis results and cause erroneous conclusions. Few QC tools provide meta-meta contamination screening function. PRINSEQ tries to identify microbial community contamination by PCA plots based on dinucleotide abundances, however the accuracy and efficiency are very limited5.
The situation of meta-meta contamination could be very complex, for example, the number of bacterial species in the targeting and contaminating community may vary, and the number of contaminating community could also be different. Here we just try to use QC-Chain to do some preliminary tests based on the most simple simulated meta-meta contaminating dataset with the assumption that the coverage of contaminating metagenome is remarkably lower than that of the targeting metgenome.
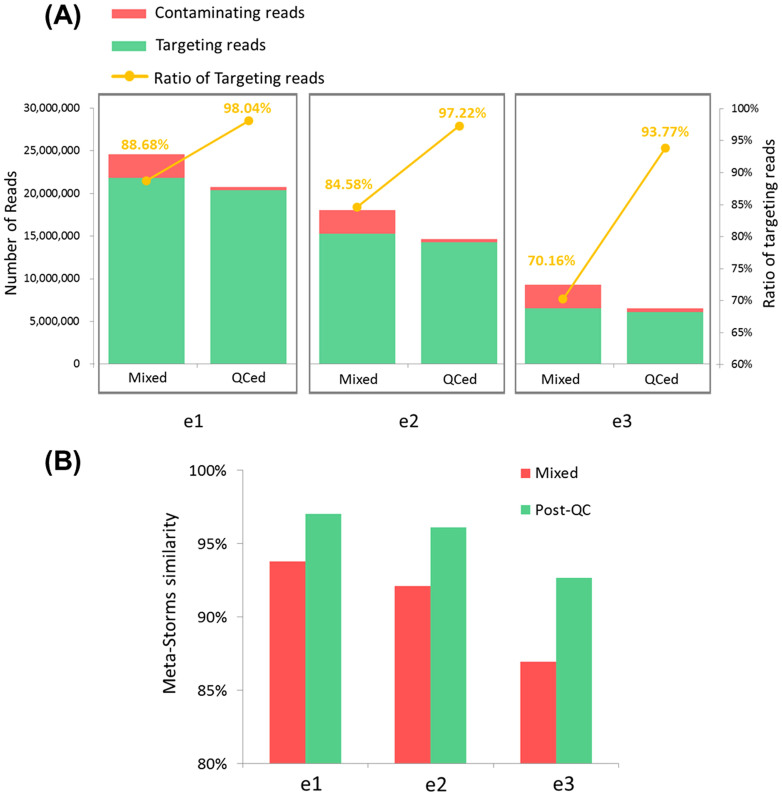
Among the three simulated data in Dataset E, rate of targeting reads was raised up to 96.3% on average by QC-Chain in the post-QC data (Figure 9(A)). We further evaluated the effect of the QC process by downstream comparison analysis. We used Parallel-META13 to generate the microbial community structures, and then calculated the similarity of structures based on Meta-Storms14 with mixed data and post-QC data to the targeting data, respectively. Compared to the similarity between mixed data and targeting data, the post-QC data showed a much higher similarity to the targeting data (Figure 9(B)), which indicated that the quality control processes provided by QC-Chain improved the purity of the input meta-meta data for downstream analysis.
Figure 9. Results of metagenomic contamination screening in metagenomic data by QC-Chain.
(A) The number of targeting and contaminating reads, and the ratio of targeting reads in mixed data and post-QC data. (B) Meta-Storms similarities of mixed data and post-QC data to the targeting data. Simulated Dataset E (e1, e2 and e3, refer to Table S5 in supporting information File S1) was used as the testing data.
3. General principles of using QC pipelines for metagenomic data
The NGS techniques have significantly advanced metagenome research these years. The very first processing step of NGS data, including metagenomic data, is quality control, which requires performing in an efficient and automatic manner. Traits for a high performance QC tool includes (1) high efficiency, which indicates a fast data processing and computation; (2) the ability to identify contaminations with high accuracy, which can identify contaminations from multiple sources and types; (3) holistic solution, that could cover the QC processes from raw reads to ready-to-be-used clean reads.
Conclusion
NGS data quality control is a critical step for follow-up meaningful analyses for metagenomic data. Quality control procedure usually includes identification and filtration of sequencing artifacts such as low-quality reads and contaminating reads. Quality control of metagenomic data for microbial communities is especially challenging.
In this study, the function, accuracy and efficiency of several QC tools and methods were assessed and compared. Among the tested QC tools, QC-Chain could provide a de novo, parallel-computing and extendable solution for quality assessment and contamination screening of metagenomic NGS data. Results on simulated and real metagenomic datasets have shown that QC-Chain is accurate and fast for metagenomic data QC. In addition, it could significantly improve the accuracy of downstream metagenomic taxonomy and function analysis. Therefore, it can serve as a highly efficient QC method for metagenomic data QC.
Current QC tools could be further improved in efficiency, accuracy and compatibility: firstly, the efficiency could be improved for users having advanced machines with GPU or high-performance cluster. Secondly, the accuracy could be improved by analyzing the per-base or per-read quality distribution, and by considering more complex source of contaminations such as viruses (those without general biomarkers). Thirdly, the compatibility could be further improved by smart detection of input file formats or combinations. All these improvements will be important for metagenomic data QC that has been facing with NGS “big data”, and these improved functions are desirable to be implemented in the updated version of QC tools.
Author Contributions
K.N. and Q.Z. conceived the idea. Q.Z., K.N. and X.S. designed the experiments. Q.Z. and X.S. performed the experiments and analyzed the data. X.S. contributed analysis tools. Q.Z., X.S. and K.N. wrote the paper.
Additional information
Datasets: The datasets supporting the results of this article are available at: http://www.computationalbioenergy.org/qc-assessment.html
Supplementary Material
File S1. Supporting information file
Acknowledgments
This work was supported by Ministry of Science and Technology of China [high-tech (863) grant number 31401076, 2012AA02A707 and 2014AA021502]; Natural Science Foundation of China [grant numbers 61103167, 31271410, 31401076 and 61303161]; Chinesisch-Deutschen Zentrum für Wissenschaftsförderung [grant number GZ878].
References
- Mardis E. R. The impact of next-generation sequencing technology on genetics. Trends in genetics 24, 133–141 (2008). [DOI] [PubMed] [Google Scholar]
- Handelsman J. Metagenomics: Application of Genomics to Uncultured Microorganisms. Microbiol Mol Biol Rev 68, 669–685 (2004). [DOI] [PMC free article] [PubMed] [Google Scholar]
- Niu B., Fu L., Sun S. & Li W. Artificial and natural duplicates in pyrosequencing reads of metagenomic data. BMC bioinformatics 11, 187 (2010). [DOI] [PMC free article] [PubMed] [Google Scholar]
- Bokulich N. A. et al. Quality-filtering vastly improves diversity estimates from Illumina amplicon sequencing. Nat Meth 10, 57–59 (2013). [DOI] [PMC free article] [PubMed] [Google Scholar]
- Schmieder R. & Edwards R. Quality control and preprocessing of metagenomic datasets. Bioinformatics 27, 863–864 (2011). [DOI] [PMC free article] [PubMed] [Google Scholar]
- Patel R. K. & Jain M. NGS QC Toolkit: A Toolkit for Quality Control of Next Generation Sequencing Data. PloS One 7, e30619 (2012). [DOI] [PMC free article] [PubMed] [Google Scholar]
- Zhou Q., Su X., Wang A., Xu J. & Ning K. QC-Chain: Fast and Holistic Quality Control Method for Next-Generation Sequencing Data. PloS One 8, e60234 (2013). [DOI] [PMC free article] [PubMed] [Google Scholar]
- Peng Y., Leung H. C. M., Yiu S. M. & Chin F. Y. L. IDBA-UD: a de novo assembler for single-cell and metagenomic sequencing data with highly uneven depth. Bioinformatics 28, 1420–1428 (2012). [DOI] [PubMed] [Google Scholar]
- Meyer F. et al. The metagenomics RAST server - a public resource for the automatic phylogenetic and functional analysis of metagenomes. BMC bioinformatics 9, 386 (2008). [DOI] [PMC free article] [PubMed] [Google Scholar]
- Mason S. J. & Graham N. E. Areas beneath the relative operating characteristics (ROC) and relative operating levels (ROL) curves: Statistical significance and interpretation. Q J ROY METEOR SOC 128, 2145–2166 (2002). [Google Scholar]
- Quast C. et al. The SILVA ribosomal RNA gene database project: improved data processing and web-based tools. Nucleic Acids Research 41, D590–D596 (2013). [DOI] [PMC free article] [PubMed] [Google Scholar]
- Paszkiewicz K. H., Farbos A., O'Neill P. & Moore K. Quality control on the frontier. Frontiers in Genetics 5, 157 (2014). [DOI] [PMC free article] [PubMed] [Google Scholar]
- Su X., Pan W., Song B., Xu J. & Ning K. Parallel-META 2.0: Enhanced Metagenomic Data Analysis with Functional Annotation, High Performance Computing and Advanced Visualization. PLoS One 9, e89323 (2014). [DOI] [PMC free article] [PubMed] [Google Scholar]
- Su X., Xu J. & Ning K. Meta-Storms: efficient search for similar microbial communities based on a novel indexing scheme and similarity score for metagenomic data. Bioinformatics 28, 2493–501 (2012). [DOI] [PubMed] [Google Scholar]
Associated Data
This section collects any data citations, data availability statements, or supplementary materials included in this article.
Supplementary Materials
File S1. Supporting information file


