

Abstract
Brillouin light scattering (BLS) spectroscopy is a technique that is able to detect thermally excited phonons within a material. The speed of propagation of these phonons can be determined from the magnitude of the Brillouin frequency shift between incident and scattered light, thereby providing a measure of the mechanical properties of the material in the gigahertz range. The mechanical properties of the extracellular matrices of biological tissues and their constituent biopolymers are important for normal tissue function and disturbances in these properties are widely implicated in disease. BLS offers the prospect of measuring mechanical properties on a microscopic scale in living tissues, thereby providing insights into structure–function relationships under normal and pathological conditions. In this study, we investigated BLS in collagen and elastin—the fibrous proteins of the extracellular matrix (ECM). Measurements were made on type I collagen in rat tail tendon, type II collagen in articular cartilage and nuchal ligament elastin. The dependence of the BLS spectrum on fibre orientation was investigated in a backscattering geometry using a reflective substrate. Two peaks, a bulk mode arising from phonon propagation along a quasi-radial direction to the fibre axis and a mode parallel to the surface, depending on sample orientation relative to the fibre axis, could be distinguished. The latter peak was fitted to a model of wave propagation through a hexagonally symmetric elastic solid, and the five components of the elasticity tensor were combined to give axial and transverse Young's, shear and bulk moduli of the fibres. These were 10.2, 8.3, 3.2 and 10.9 GPa, and 6.1, 5.3, 1.9 and 8 GPa for dehydrated type I collagen and elastin, respectively. The former values are close to those previously reported. A microfocused BLS approach was also applied providing selection of single fibres. The moduli of collagen and elastin are much higher than those measured at lower frequency using macroscopic strains, and the difference between them is much less. We therefore believe, like previous investigators, that molecular-scale viscoelastic effects are responsible for the frequency dependence of the fibre biomechanics. Combining BLS with larger-scale mechanical testing methods therefore should, in the future, provide a means of following the evolution of mechanical properties in the formation of the complex structures found in the ECM.
Keywords: protein fibres, fibrils, mechanical moduli, acoustic microscopy, hexagonal crystals, Raman
1. Introduction
The extracellular matrix (ECM) is an important component of biological tissues. At a microscopic level, its mechanical properties are important in providing support for cells and in transmitting biomechanical signals, and the macroscopic properties of the extensive ECM of tissues such as tendons, cartilage and blood vessels are central to their biological functions. The ECM consists of networks of fibrous proteins, the collagens and elastic fibres, immersed in a viscoelastic gel, rich in proteoglycans [1]. The collagens are a large family of proteins, characterized by disulfide-bonded triple-helical domains composed largely of proline- and hydroxyproline-containing repeat sequences. In the fibrous forms, of which type I collagen is the best-characterized and most ubiquitous representative, the molecules are regularly assembled both laterally and longitudinally and extensively cross-linked to form hierarchies of fibrils and fibres. Elastic fibres consist of the protein elastin assembled on a skeleton of glycoproteins. The elastin molecule contains an unusually high proportion of hydrophobic amino acids, and the molecules are cross-linked by the condensation of lysine residues to form the unique amino acid desmosine, which acts as a tetravalent cross-link. The elastic fibre has an elastic modulus some two orders of magnitude less than that of collagen [2]. By altering the proportions of collagen and elastin and the architecture of the fibrous networks, it is possible to construct tissues whose mechanical properties are closely tailored to specific physiological requirements (e.g. medial lamellae forming the arterial wall [3,4]). The elegance of these associations has attracted great interest in the biomechanics community, and the realization that diseases ranging from osteoarthritis to atherosclerosis, cancer and diabetes are associated with changes in the mechanical properties of the affected tissue has provided a clinical stimulus to many years of research on the mechanical properties of whole tissues and of purified collagen and elastin matrices. Tumour progression and metastasis are characterized by changes in mechanical properties of cells and their microenvironment which are of considerable interest because they provide information on the pathogenesis of the disease (e.g. concerning the role of matrix stiffness, interplay with cell migration, embedded cells such as fibroblasts, etc.) [5–9]. Our recent work has focused on finding correlations between tissue mechanics and chemical composition from Brillouin and Raman scattering microscopy of human pre-cancerous epithelial tissue [10].
For collagen, extensive experimental and theoretical work has established the hierarchy of mechanical properties from a rather rigid molecule to stiff fibrils, and new microscopic techniques are allowing detailed mapping of the intramolecular and intrafibrillar strain fields [11]. AFM-based [12–15] and microelectromechanical tests [16] have been employed to measure the mechanical properties of collagen fibrils, providing information on the anisotropy of the complex hierarchical structure of collagen. However, for elastin, the picture is more complex and less complete [17]. It has long been recognized that entropic effects, arising from the high degree of conformational freedom provided by the preponderance of small amino acids in the chain, and hydrophobic interactions are likely to be important, but quantitative analysis is difficult. Single molecule measurements on elastin mechanics have recently been reported [18], and there has been extensive molecular modelling. There have also been many experiments on fibre-level mechanics, but even the smallest fibres amenable to direct mechanical testing are sufficiently complex in structure that interpretation in terms of molecular dynamics is challenging.
In this paper, we explore the use of Brillouin light scattering (BLS) to investigate the mechanical properties of elastin and collagen fibres. The applicability of BLS to the study the mechanics of ECM proteins was demonstrated almost 40 years ago, but appears never to have been pursued. In the intervening years, both the importance of the mechanics of the ECM and the complexity of its composition have been amply demonstrated. At the same time, researchers in other fields have significantly refined the instrumentation and methodology of BLS measurements. As a result of these developments, there have been a number of reports suggesting that in vivo BLS measurements of tissue elasticity may be an important diagnostic tool in fields such as ophthalmology [19]. It is hoped that this study will constitute a first stage of investigating how the mechanical properties of the many load-bearing structures encountered in biological tissues are related to their complex hierarchical organization. Such understanding is required, both to address fundamental questions in biomechanics and to underpin attempts to develop BLS as a clinical diagnostic tool.
BLS is an inelastic scattering process in which thermally excited acoustic phonons are detected in the scattering medium [20]. The velocity of propagation of these high-frequency waves provides a measure of the elastic properties of the medium. The first study on biopolymers of which we are aware by Harley et al. [21] measured a microscopic elastic modulus in both type I collagen fibres and in muscle proteins, which they related to the forces of hydrogen bonding along the protein backbone. Later studies by Randall and Vaughan reported the acoustic wave velocity and attenuation of rat tail collagen [22] and the elastic moduli of refractive tissues of the eye [23]. Cusack & Miller [24] determined the angle dependence of both lateral and transverse modes in wet and dry collagen fibres. They fitted their data to the theoretical model of wave propagation within an elastic medium with hexagonal symmetry [25] to determine the five components of the elasticity tensor and thence to determine the axial and transverse Young's moduli and the shear modulus of collagen. As in the previous study, these values were much higher than those determined by mechanical testing of macroscopic specimens. The authors speculated that this is possibly a viscoelastic effect attributable to the different timescales of the two measurement techniques [24]. For polymers, differences in Young's moduli of an order of magnitude between macroscopic stretching and microscopic measurements have been reported [26], and the viscoelastic behaviour has been characterized [27]. The effect of hydration dynamics on the Brillouin spectrum of oriented DNA films, showing a coupling of DNA vibrations to a water relaxation as the main mechanism of phonon damping, has been reported [28–30]. Our recent work on human tissue biopsy related the viscoelastic nature of the sample to the presence of hydration water [10].
In this paper, we determine and compare the mechanical properties of elastin and collagen fibres. In addition to type I collagen, which forms coarse fibres and is the main structural component of tendons, many ligaments, and bone, we investigate type II collagen which is unique to hyaline cartilage. Individual fibres of type II collagen are less than 1 µm in diameter and in consequence their mechanical properties have only been investigated by indirect methods. In this work, we studied intact cartilage, which comprises ca 100- to 130-nm-thick highly oriented type II collagen fibres embedded in a proteoglycan gel. We used experimental configurations in which the samples were placed on a reflective substrate to investigate both the effect of sample orientation relative to a fixed scattering geometry on the BLS spectrum, as required to fully characterize the elasticity tensor [31,32] and, with the use of a scanning BLS microscope (micro-BLS), to obtain spectra of the samples on a microscopic scale. This latter approach has proven invaluable to gain two-dimensional mechanical mapping of biomedical tissue at high spatial resolution [10]. It has potential for in vivo applications in the diagnosis of disease.
2. Methods
2.1. Fibre and tissue samples
Tail tendons were obtained from Sprague–Dawley rats euthanized for other purposes in accordance with EU regulation 1099/2009 and The Welfare of Animals (slaughter or killing) Regulations 1995. Equine metacarpophalangeal joints and bovine nuchal ligaments were obtained from a local abattoir. The rat tail tendons were exposed via a longitudinal incision in the skin and individual (mainly type I) collagen fibres were carefully drawn out with fine forceps, washed in phosphate-buffered saline (PBS; pH 7.4) and frozen. Fibres were fully hydrated in PBS before measurement, unless stated otherwise.
Because fibres of type II collagen are approximately 100 nm in diameter, they were studied in intact articular cartilage from equine metacarpophalangeal joints. Sections of cartilage were cut parallel to the articular surface from the superficial and deep zones, the former containing fibres running parallel to the section plane and the latter perpendicular.
Elastin was prepared by alkali extraction of bovine nuchal ligament using the Lansing procedure [33]. The ligament consists of roughly parallel arrays of fibres approximately 5 µm in diameter (see below) [34]. Measurements were made on single fibres drawn out with fine forceps and on longitudinal sections of the whole ligament cut with a scalpel and stored in PBS.
2.2. Spectroscopy
Duplicate samples (from the same animal) of collagen and elastin fibres, nuchal ligament and cartilage were examined. The morphology of the specimens was investigated using a scanning electron microscope (SEM-FEG LEO 1525, Inlens detector), operating at an acceleration voltage of 5.0 kV, and chromium metallization.
Fibres and tissue sections were removed from the buffer and transferred onto reflective silicon slides for BLS measurement. A glass slide, held in place by four screws, was placed on top of the sample to seal and create a hydrated compartment. A low contact pressure was applied through the screws, thus avoiding damage to the specimen while ensuring good contact between the specimen and silicon substrate. Care was taken to avoid stretching or orientation of the samples during preparation.
The BLS spectrum of wet samples presents a dominant water peak overlapping with the acoustic (parallel-to-surface, PS) mode of interest for the specimen. Equilibration of the sample on the silicon substrate (generally 20 min was sufficient) allowed the loss of excess water, enabling the analysis of mechanical anisotropy for these materials. Equilibration was monitored by measuring spectra until no change was observed in the intensity and frequency of Brillouin peaks between successive spectra (see below). Experiments were conducted at least in duplicate.
BLS spectra were collected with a custom-built system [35] consisting of a single-mode 532 nm solid-state laser operated at 76 mW output power on the sample, a 20 cm achromatic lens to focus and collect light from the sample in a backscattering geometry, a sample mount with goniometer, a tandem-multipass Fabry–Perot interferometer and a photomultiplier detector (figure 1).
Figure 1.

Schematic of the BLS apparatus with backscattering geometry used in the measurements; the incident light emitted by a solid-state laser is sent to the sample through an achromatic lens. The light scattered by bulk acoustic phonons and by those resulting from reflection of light at the substrate surface, which is in contact with the sample, is collected by the lens, filtered by a tandem-multipass Fabry–Perot interferometer and detected by a photomultiplier. FP1 and FP2 indicate the two interferometers constituting the tandem set-up. A polarizer selects the polarization of incident light, and an analyser is used to select the polarization of scattered light. (Online version in colour.)
The configuration employed (figure 2a) with a transparent sample mounted onto an opaque substrate, enables two distinct scattering channels to be accessed within a single BLS experiment (see appendix A).
Figure 2.
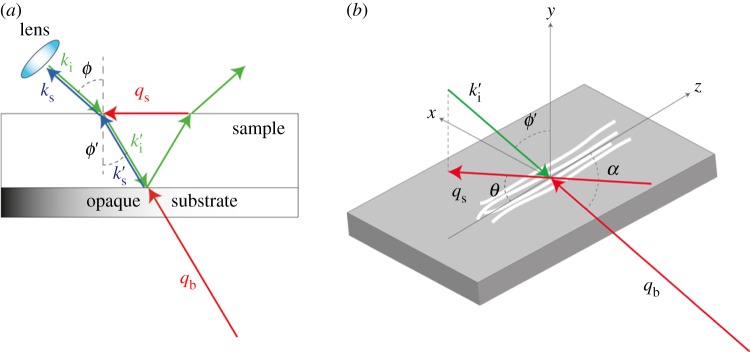
(a) Schematic diagram of the BLS scattering geometry using a specimen in contact with the surface of a reflective silicon substrate. A glass slide (not shown) is placed above the specimen to seal the compartment, and gentle pressure is applied through pads at the corners of the substrate. The incident light (ki) passes through the lens, is refracted at the air–sample interface (k′i) and focused at the sample–substrate interface. The scattered light collected by the same lens (k′s) results from interaction with both bulk phonons (qb) and those travelling PS of the sample (qs). Angles between the directions of light and the normal to the surface are indicated as ϕ and ϕ′. (b) Schematic diagram of the sample and of the adopted coordinate system; z defines the extraordinary axis parallel to the direction of the fibres. Angles θ and α are those between the direction of phonons qs and qb to the z-axis, respectively. ki, k′i, ks, k′s: wavenumbers of the incident and scattered light; qb, qs, wavevectors of the bulk and PS modes, respectively. (Online version in colour.)
In these experiments, a polarizer and analyser were used to select the polarization of incident and scattered light. An unpolarized spectrum, IVU, was measured selecting the vertical (V) direction of incoming light polarization relative to a horizontal scattering plane, and using no analyser (U, unpolarized scattered light) to detect longitudinal acoustic modes. Conversely, by selecting orthogonal polarizations of the incoming (V) and scattered light (H), a depolarized spectrum, IVH, was measured, this latter being more sensitive in detecting transversely polarized modes.
In the samples studied, the fibres were mainly aligned along a given direction. From the acoustic point of view, this gives rise to a hexagonal symmetry, with the extraordinary (z-) axis parallel to the direction of the fibres and all perpendicular directions being equivalent [24,36]. Having the sample mounted onto the silicon slide (figure 2b) enables the complete acoustic characterization of the fibres through the measurement of the velocity of acoustic modes at different angles to the z-direction. This is accomplished by rotating the sample around the direction perpendicular to the plane (y-axis), i.e. by changing the orientation of the phonon wavevector qs, through angle-resolved (θ) measurements in the (x,z) plane while maintaining the scattering angle (2ϕ = 90°) and scattering volume position both fixed.
Accurate focus adjustment on the sample was performed, and the sample was centred with respect to the objective by ensuring alignment during in-plane rotation while maintaining a constant angle of incidence of the excitation light. The two peaks observed in the spectrum at frequencies ωs and ωb give the velocity of the acoustic modes at angles θ and α = arcos (sinϕ′cosθ) to the z-direction, respectively.
GHOST software was used for acquisition and manipulation of the data [37].
BLS spectra were measured over the range –27 to 27 GHz at 0.2 GHz resolution, with a free spectral range of 30 GHz and a collection time of approximately 10 min per spectrum.
Micro-BLS spectra were collected with a scanning BLS microscope already described [10,38]. It essentially consists of a single-mode 532 nm Excelsior diode-pumped solid-state laser operated at 5 mW output power, a Zeiss dark-field objective with a numerical aperture of 0.75 and a long working distance (4.7 mm), and a tandem-multipass Fabry–Perot interferometer. The lateral resolution of the set-up is approximately 250 nm [38]. The spectral resolution is 0.1 GHz. The geometry of the fibres and sections was recorded in (455 nm) LED light microscope images, obtained using the same Zeiss dark-field objective and a CCD camera. To determine the frequency and linewidth of each Stokes peak, the intensity profile was fitted to a damped harmonic oscillator using GHOST software as previously described [10]. A deconvolution of the instrumental function was applied to correct for the finite linewidth of the laser spectrum. As a measure of the attenuation of the acoustic wave, tan(δ), the ratio of the imaginary-to-real part of the elastic modulus, was obtained through the ratio of the fitted linewidth-to-frequency of the bulk peak. Mean values of tan(δ) over the range of angles employed were calculated (table 1).
Table 1.
Elastic tensor coefficients, elastic moduli, Poisson's ratios and tan(δ) of dry fibres and tissues. E|| is the axial Young's modulus; E⊥, transverse Young's modulus; G, shear modulus; K, bulk modulus.
| sample | elastic coefficients (GPa) |
elastic moduli (GPa) |
Poisson's ratios |
tan(δ) | |||
|---|---|---|---|---|---|---|---|
| collagen | c33 | 18.6 ± 0.1 | E|| | 10.2 ± 0.3 | σ13 | 0.43 ± 0.01 | 0.063 ± 0.01 |
| c11 | 14.3 ± 0.1 | E⊥ | 8.3 ± 0.3 | σ12 | 0.32 ± 0.02 | ||
| c44 | 3.2 ± 0.1 | G | 3.2 ± 0.1 | ||||
| c12 | 8.0 ± 0.1 | K | 10.9 ± 0.5 | ||||
| c13 | 9.7 ± 0.2 | ||||||
| elastin | c33 | 11.5 ± 0.2 | E|| | 6.1 ± 0.4 | σ13 | 0.40 ± 0.02 | 0.062 ± 0.01 |
| c11 | 10.4 ± 0.1 | E⊥ | 5.3 ± 0.6 | σ12 | 0.40 ± 0.06 | ||
| c44 | 1.9 ± 0.2 | G | 1.9 ± 0.2 | ||||
| c12 | 6.6 ± 0.2 | K | 8 ± 1 | ||||
| c13 | 6.8 ± 0.3 | ||||||
| ligament | c33 | 10.8 ± 0.1 | 0.059 ± 0.01 | ||||
| c11 | 10.8 ± 0.1 | ||||||
| cartilage | c33 | 13.4 ± 0.2 | 0.080 ± 0.01 | ||||
| c11 | 13.4 ± 0.2 | ||||||
3. Results
3.1. Collagen fibres
Figure 3a shows a scanning electron micrograph of a rat tail tendon fibre; the orientation is such that the single fibrils (100–300 nm in diameter) are essentially aligned along the diagonal line from the upper left to lower right corner of the micrograph.
Figure 3.
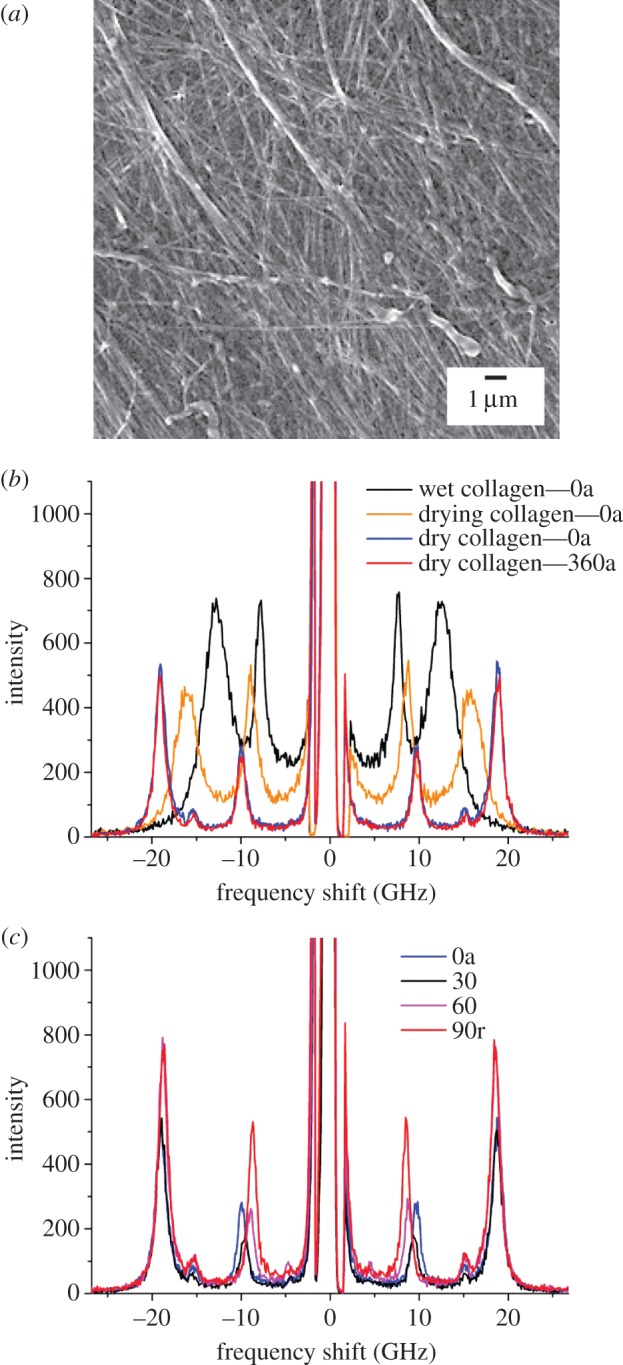
SEM image and BLS spectra of a type I collagen fibre from rat tail tendon. (a) Scanning electron micrograph acquired after the BLS measurement. (b) Spectra at different hydration levels and (c) at different angle θ, in degrees. ‘a’ and ‘r’ refer respectively to axial and radial directions of the exchanged wavevector relative to the fibre axis. Wet, drying, and dry collagen—0a and 360a refer to spectra of the fibre at different times during the experiment, at the beginning, after 21 min, 4 h 16 min and 6 h 2 min, respectively. A blue-shift of the bands is observed upon dehydration. (Online version in colour.)
BLS spectra of this sample are presented in figure 3b,c. Each spectrum corresponds to a specific angle θ of light scattering. Figure 3b shows the effect of dehydration of the collagen fibre on the BLS spectrum measured at θ = 0° (and 360°). For wet collagen, two peaks are observed, one at 7.6 GHz related to the PS mode of the fibre and a broad band at 12.5 GHz owing to the bulk acoustic mode of wet collagen. Upon drying, the two bands shift to higher frequencies reflecting an increased stiffness of the material, and they become narrower hence indicating a decrease in mechanical heterogeneity of the material and/or in the acoustic damping (see below). In the dry specimen, the PS peak occurs at 9.8 GHz, with the bulk mode at 18.9 GHz. Figure 3c shows the dependence of the BLS spectrum of the dry collagen fibre on the angle of rotation, θ. At lower frequency, the PS peak is visible, with a position that red-shifts when going from θ = 0° (phonon wavevector qs parallel to z, the principal axis of the fibre) to θ = 90° (qs orthogonal to z). This shift arises, because the acoustic mode probes different directions of qs, from axial-to-radial orientation, relative to the collagen fibre or fibre bundle, while changing θ (figure 2b). The bulk peak is observed at higher frequency; this only undergoes a small red-shift upon changing θ, as expected for a mode which probes a quasi-radial direction throughout the θ scanning experiment. In fact, the angle α changes from 62° to 90° for θ varying from 0 to 90° (figure 2b).
Figure 4a is a plot of the PS peak frequency of the dry collagen fibre versus angle to the fibre axis, θ (in degrees). The data gave a good fit to a sinusoidal function in this range, indicating the periodicity in acoustic wave velocity at varying angle to the fibre axis. Figure 4b is a plot of the acoustic wave velocity obtained from the PS and bulk peaks as a function of the angles, θ and α, respectively.
Figure 4.
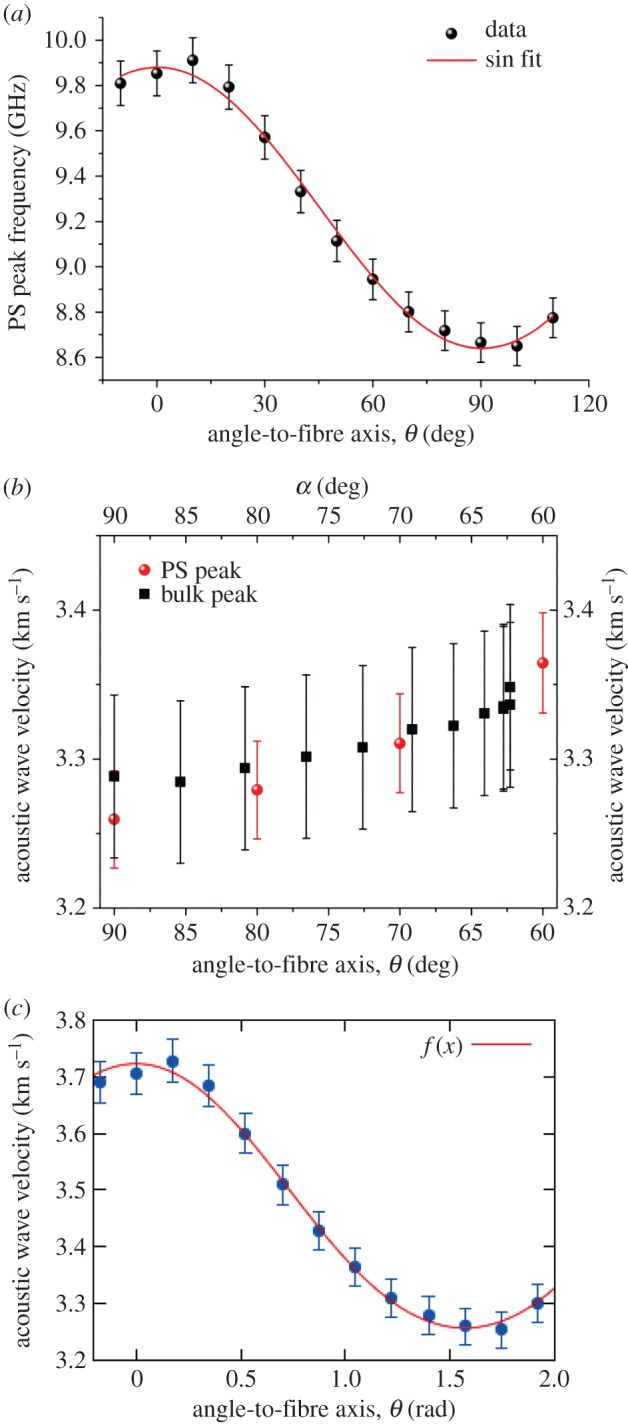
(a) Plot of the frequency of the PS peak in a dry collagen fibre as a function of angle to the fibre axis, θ. Data are fitted to a sinusoidal function with 90° period (R2 = 0.994). (b) PS and bulk acoustic wave velocities as a function of angles, θ and α, respectively (see text). (c) PS acoustic wave velocity versus angle to the fibre axis, θ (in radians), for dry collagen fitted to equation A 1 (appendix A) for wave propagation in a hexagonally symmetric elastic medium. f(x) indicates the resulting fit function (reduced χ2 = 1.9 × 10⁻⁴). (Online version in colour.)
At an angle θ = 40°, the VH spectrum revealed a transversely polarized mode at 4.1 GHz which, normalized to the longitudinal mode frequency at the same angle (9.4 GHz), gives a value of 0.43 in agreement with previously reported data showing weak dependence of transverse mode frequency on angle θ [24].
Equation (A 1) in appendix A was used to fit the acoustic wave velocity derived from the PS mode at different angle θ (figure 4c). The density of the material, 1.35 g cm−3, was taken from reference [24]. The refractive index was determined from the frequency of the two modes, n = 0.707ωb/ωs = 1.51 ± 0.02. The elastic coefficients and the moduli obtained are shown in table 1. The major (σ13) and the second (σ12) Poisson's ratios were also reported; they show positive values and some degree of anisotropy for collagen fibres. Small differences in the elastic constants, moduli and Poisson's ratios were found between this work and previous work by Cusack & Miller [24], with the anisotropy of elasticity c33/c11 being equal to 1.30 ± 0.01 compared with the earlier value of 1.53. This difference is plausibly related to differences in sample preparation.
3.2. Elastin fibres
Electron microscopy analysis confirmed that the elastin specimens from bovine nuchal ligaments were composed of a roughly parallel array of fibres approximately 4–5 µm in diameter (figure 5a). Figure 5b compares the spectrum of dry elastin measured at θ = 0° (axial orientation of the exchanged wavevector) with the equivalent collagen spectrum. The spectrum of elastin shows two bands, the PS mode at 8.2 GHz and the bulk mode at 16.8 GHz, which both red-shift upon rotation from θ = 0° to 90° (figure 5c), although to a lesser extent than the collagen bands. The density of dry-purified elastin, 1.23 g cm−3, was obtained from a previous work [39]. The estimated refractive index, n = 1.54 ± 0.02, is similar to that previously reported (1.534 [34]) as well as to that of dry collagen fibres (above). Fit results for the elastic tensor coefficients and mechanical moduli of elastin fibres (table 1) show lower values to those of collagen. In addition, the anisotropy of elasticity is c33/c11 = 1.11 ± 0.02, smaller than that of collagen fibres. Results show an isotropic Poisson's ratio of 0.4 for elastin.
Figure 5.
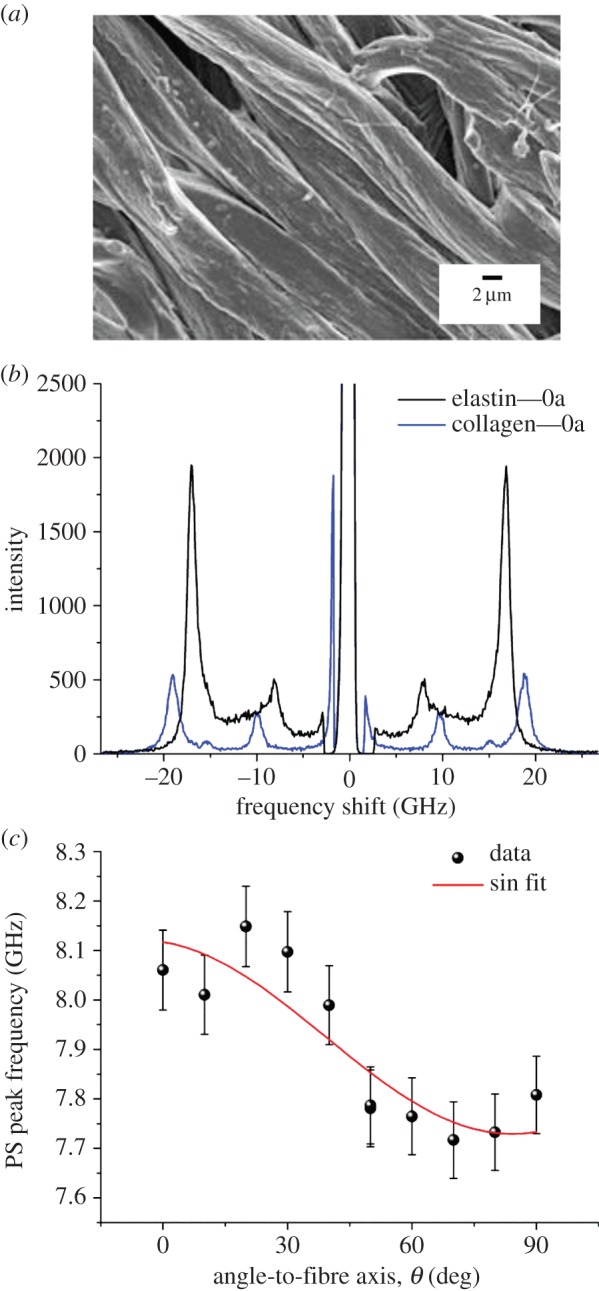
SEM image and BLS spectra of an elastin fibre from bovine nuchal ligament. (a) Scanning electron micrograph collected after the BLS measurement. (b) Spectra of dry elastin fibre measured at θ = 0°. Collagen data are shown for comparison. (c) Plot of the frequency of the PS peak. Fit as in figure 4 (R2 = 0.74). (Online version in colour.)
3.3. Nuchal ligament
The scanning electron micrograph in figure 6a shows that the ligament is composed of a roughly aligned assembly of the fibres analysed above (see §3.2). The lower alignment is reflected into an absence of θ-dependent peak frequencies (figure 6b) and hence of mechanical anisotropy (figure 6c) for these samples. This finding plausibly reflects a lack of preferential orientation in the bundles of fibres forming the ligament and/or the role of interfibrillar constituents—collagen fibrils in vivo, replaced by water or air in our samples. The observed peaks are at 7.9 (PS mode) and 16.8 GHz (bulk mode). The calculated refractive index is 1.51 ± 0.02, comparable to that of dry collagen and elastin fibres. The two coincident elastic constants c33 and c11 were derived in the cases θ = 0° and 90°, respectively, using the density of dry-purified elastin (table 1). Their values are in between the corresponding ones of the mechanically anisotropic elastin fibres.
Figure 6.
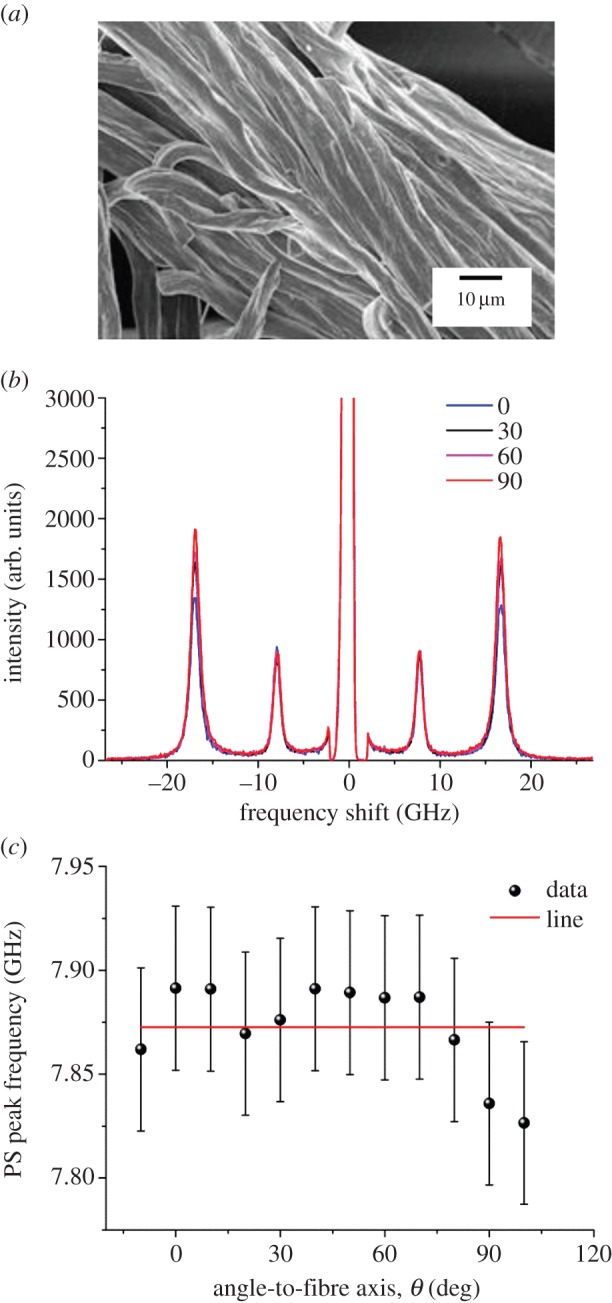
SEM image and BLS spectra of a section of bovine nuchal ligament. (a) Scanning electron micrograph collected after the BLS measurement. (b) Spectra of the ligament measured at different angle θ. Spectra were normalized to the intensity (height) of the PS peak at 7.9 GHz. (c) Plot of the PS peak frequency as a function of angle θ. The line shown is a guide for the eye. (Online version in colour.)
3.4. Cartilage
Figure 7 shows the BLS spectrum of a fully hydrated section of cartilage cut parallel to the articular surface from the deep zone (also shown in figure 8b, spectrum 1). The spectrum of the PBS in which it was stored is also presented for comparison. The presence of a large proportion of water (approx. 70% w/v for intact cartilage [40]) in the cartilage is indicated by a broad peak at 4.8 GHz (the other one at 10.3 GHz being related to a distribution of modes eventually dominated by the PS mode of cartilage; spectrum 16 in figure 8b). Brillouin shifts of the PBS are 4.1 GHz for the PS peak and 7.5 GHz for the bulk peak.
Figure 7.
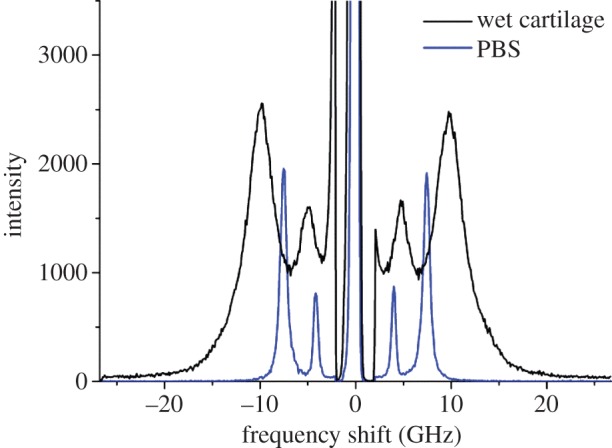
BLS spectra of hydrated cartilage (spectrum 1 in figure 8b) and the PBS solution. Broad peaks are observed for the wet tissue, which indicate a differential effect of water hydration reflected into a wide range of acoustic mode frequencies from differently hydrated domains within the tissue. (Online version in colour.)
Figure 8.

SEM image and BLS spectra of a section of cartilage from equine metacarpophalangeal joint. (a) Scanning electron micrograph collected after the BLS measurement. (b) Spectra measured at different times after the start of dehydration (1), until approximately 12 h after the beginning (16). (The arrow indicates the increase in intensity of the bulk peak in the range 16–25 GHz.) (c,d) Plots of frequency and linewidth derived from curve-fit analysis of the bulk peak as a function of time. (Online version in colour.)
SEM analysis (figure 8a) of sections of cartilage cut parallel to the articular surface from the deep zone showed fibres (of type II collagen) running perpendicular to the section plane. The state of hydration of the samples during BLS measurements was assessed through the plots of frequency (figure 8c) and linewidth (figure 8d) of the bulk peak (figure 8b). The spectra show an increase in intensity of the tissue peaks with time (figure 8b) indicating an increase in fibre packing as the material dehydrates. The frequency of the bulk peak also increased during the course of the experiment, until it reached a plateau at 19.1 GHz (figure 8c), which indicates the stiffening of the material as it dehydrates. The narrowing band width (figure 8d) is indicative of a decrease in mechanical heterogeneity of the material or of a reduction of the acoustic damping related to the progressive slowdown of relaxation processes. No elasticity anisotropy was observed for these specimens, or for sections cut parallel to the articular surface from the superficial zone, which contains fibres running parallel to the section plane for which similar frequencies of BLS peaks were observed. This correlates well with the observation of a homogeneous structure without preferential fibre alignment in the cartilage zones examined (figure 8a). The calculated refractive index is 1.42 ± 0.02, smaller than that of the other samples studied. The elastic constants c33 and c11 were derived from the spectra at θ = 0° and 90°, as before, using the density of wet articular cartilage [41], 1.1 g cm−3 (table 1).
We also estimated the loss tangent, tan(δ), which is a measure of the viscoelastic damping and the mechanical heterogeneity, from the ratio of linewidth to frequency derived from fit analysis of the bulk peaks of all four samples, and results are shown in table 1. While collagen, elastin and ligament have a similar value of tan(δ), approximately 0.06, cartilage has a remarkably bigger value, 0.08. A remnant of hydration (incomplete desiccation in air) from strongly bound water in this particular sample may be the reason for the more effective attenuation of the acoustic waves compared with the other materials. This, indeed, together with the tissue morphology, may lead to increased heterogeneity in viscoelastic properties and therefore to a broader distribution of acoustic mode frequencies measured for articular cartilage.
3.5. Micro-Brillouin spectra
Figure 9 shows micro-BLS spectra of elastin fibres, collagen fibres and cartilage measured using a scanning BLS microscope. The spectra of the same specimens acquired through angle-resolved BLS measurements (θ = 90° radial; see above) are also presented. The frequencies of the bulk modes measured by the two techniques are similar within the limits of spectral resolution (see below). Clearly, the micro-BLS spectra contain no PS peak, because the measurement is performed in a strictly backscattering geometry which only permits observation of bulk longitudinal modes. They also lack a small peak observed for collagen fibres (15.3 GHz) and cartilage (15.2 GHz), and which appears as a shoulder to the bulk peak in the case of elastin (figure 9a). The fact that this signal is found at similar frequency in different samples suggests that it possibly arises from a small remnant of highly hydrated fibres within the samples. This may be an indication of the presence of tightly bound (interstitial [42]) water which is not removed by desiccation under room conditions. The micro-BLS spectra, which were acquired on the same samples (after the BLS spectra), show no evidence of this peak at ca 15 GHz (figure 9). This reflects the ability of microfocused BLS to select the contribution from a single fibre, whereas the (macro-)BLS approach collects scattered light from larger, heterogeneous areas of the sample.
Figure 9.
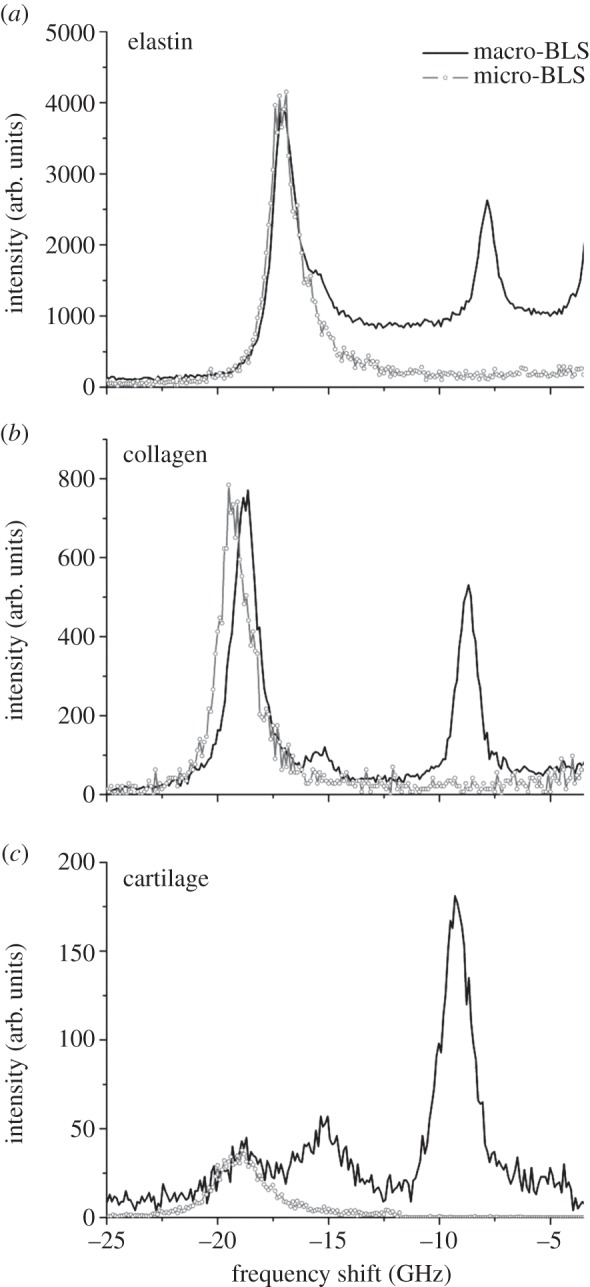
Comparison of BLS and micro-BLS spectra of (a) elastin fibres, (b) collagen fibres and (c) cartilage: angle-resolved BLS experiment with θ = 90° (line), and microfocused BLS (open circles). Micro-BLS spectra were normalized to the intensity (height) of the bulk peak in the corresponding BLS spectra and were less intense owing to the smaller scattering volume.
The comparison between the Brillouin spectra acquired using the two different experimental apparatus enables the length scale dependence of the elastic constants to be assessed. The angle-dependent Brillouin data, acquired averaging over a large scattering volume (focus diameter approx. 40 µm; focal depth approx. 40 µm for the PS modes), and the micro-BLS data, averaged over a smaller scattering volume (focus diameter approx. 0.25 µm; focal depth approx. 1 µm), are in good agreement for the elastin fibres and for the cartilage, indicating that the elasticity of both materials is homogeneous over these scales. On the contrary, the collagen spectra (figure 9b) show a difference—within the spectral resolution—that can be related to the elastic anisotropy of the single fibre or to its hierarchical organization. The peak frequency observed here, approximately 19 GHz, is higher than the average frequency of the fibrous (type I) collagen-rich matrix of human epithelium biopsy analysed by micro-Brillouin mapping [10]. This indicates that other non-collagenous constituents and the structural organization of the ECM contribute to making this tissue ‘softer’ than the single collagen fibres examined here.
For the cartilage with fibres running parallel to the section plane, a micro-BLS spectrum was measured, and compared with that of collagen fibres from the rat tail tendon. Figure 10 shows the two spectra, that of collagen fibres having a peak at 19.2 GHz and that of cartilage with a peak at 19.5 GHz. The difference in peak position (0.3 GHz) may be significant here and ascribed to the difference between type I and type II collagens. Further work using a two-dimensional mapping approach may help to clarify this assignment via fibril-to-fibril comparative analysis.
Figure 10.
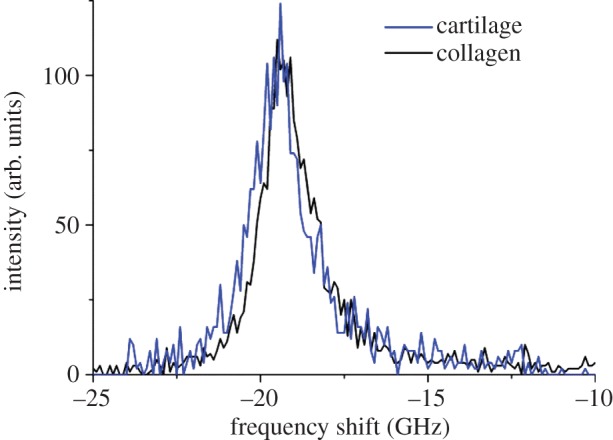
Micro-BLS spectra of articular cartilage and collagen fibres. A difference in peak position of 0.3 GHz is observed, with the cartilage (type II collagen) at slightly higher frequency than the collagen fibres (type I), possibly reflecting the different secondary structure of collagens. (Online version in colour.)
4. Discussion
The collagens and elastin are the principal fibrous, load-bearing components of the ECM and so provide the obvious starting point for this investigation. The intact tendon from rat tail has been studied before. Type I collagen constitutes up to 85% of the dry weight of the tendon (with type III collagen and proteoglycans making up the remaining part) and we have presumed that it dominates the BLS measurements reported here. This assumption, together with investigations of other environmental factors such as pH and ionic strength as well as the effects of pathological changes such as oxidation and glycation, will form the bases of further investigations.
BLS spectroscopy is a technique that measures thermally excited acoustic waves or phonons within a material. Hypersonic waves are detected through Brillouin measurements in the gigahertz region. Sample materials with longitudinal acoustic waves propagating at a velocity of 3 km s−1 give Brillouin spectra with broad peaks in the range 15–20 GHz. The PS modes, at lower frequency, which are detected when using a reflective substrate in a (macro-)BLS approach, are especially useful to obtain a full description of the mechanical anisotropy of highly symmetric materials also when the refractive index is unknown. For the materials studied here, a hexagonal symmetry applies which reflects in five elastic constants. Clearly, there is a strong dependence of the elastic moduli on the frequency of the technique—the higher the frequency, the bigger the moduli [26]—owing to the viscoelastic behaviour of materials such as the protein fibres and tissues analysed here. The presence of tightly bound or interstitial water, which maintains dehydration at ambient conditions, has a remarkable effect on the Brillouin peak frequencies and hence on the acoustic wave velocities, elastic moduli and Poisson's ratios determined. In this study, we investigated dry materials and achieved a full description of their elasticity. For the first time, the elastic constants and moduli of elastin, ligament and cartilage have been reported using BLS spectroscopy. Note that the same measurements carried out under controlled humidity are challenging, because the bulk peak of water overlaps with the PS peak of interest for the material. An alternative sample compartment under consideration in our laboratory should enable controlled humidity within a level which does not prevent the PS peak analysis of mechanical anisotropy to be performed. In addition, micro-BLS two-dimensional mapping enables the distribution of elastic properties of heterogeneous materials to be obtained. This can be coupled to macro-BLS measurements (with reflective substrates) for comparative spatially resolved and angularly resolved analysis. We attempted such analysis here when we compared single micro/macro-BLS spectra of collagen, elastin and cartilage for the radial direction of exchanged wavevectors. The results showed a correspondence between Brillouin peak positions for the bulk mode as well as an additional peak (at ca 15 GHz) in the macro-BLS spectra which can be assigned to a remnant of hydrated fibres within the materials. A similar peak position for the differential materials suggests that water plays the major role in this band shape. This signal is not detected in micro-BLS owing to the higher resolution, which enables single fibres to be selectively analysed.
We followed Cusack and Miller in using a hexagonally symmetric elastic solid model to extract elastic moduli from BLS measurements, and our values showed satisfactory agreement with theirs [24]. However, the ECM contains a large quantity of water, both around the fibres and within small intrafibrillar pores. This has been recognized in the development of poroelastic models both of the macroscopic properties of tissues and of the propagation of sound waves. It may, therefore, be appropriate to consider the use of these models in BLS measurements in the future. The moduli are approximately fivefold higher than those measured at lower frequencies, as noted by Cusack & Miller [24]. The authors' suggestion that the discrepancy arises because of a viscoelastic effect—presence of relaxation mechanisms slower than probed in the hypersonic scale of the BLS measurements—is probably true. It would also be instructive to compare BLS spectra with the low-frequency Raman modes of collagen and other matrix proteins. This would also clarify the effects of water on the structure, and vibrational and relaxation dynamics of these materials [43–45].
There has been a long-standing debate about the extent to which biochemical and structural differences between collagen types give rise to different mechanical properties and physiological functions. Type II collagen is found only in hyaline cartilages, where it forms arcades of fine (submicrometre) fibres. It is only at this level that its mechanical properties have been investigated using indirect methods. Our measurements on intact cartilage found a stronger attenuation of the acoustic waves, measured by tan(δ), relative to the other materials studied here. This can be attributed to a remnant of hydration owing to tightly bound water not removed by air drying which causes a bigger heterogeneity in the viscoelastic behaviour of articular cartilage. It appears that the intrinsic mechanical properties of the type II fibril are similar to those of type I. A more complete picture may result from a mapping approach wherein topological patterns of elasticity at a submicrometre level can be identified.
The function of elastin is to provide tissues such as skin, lung and blood vessels with the requisite long-range elasticity. The organization of elastin molecules to form tissue-specific fibres is much less well characterized than that of collagen and the molecular basis of the molecule's unique long-range elasticity is still incompletely understood. However, the macroscopic elastic modulus of elastin fibres is two orders of magnitude less than that of type I collagen fibres [2]. In contrast, the moduli measured by BLS were only approximately 40% lower. This lends weight to the argument of viscoelasticity of these fibres. The angular dependence of the BLS data was weaker and their values lower than those in type I collagen. This probably reflects the less regular organization (hence lesser mechanical anisotropy) of elastin microfibrils within the fibres that were examined. Because fibres are probed on a submicrometre length scale [46], the differential mechanical properties observed between elastin fibres and the bovine nuchal ligament (from which they were drawn out) may reflect the role of non-elastic constituents and cross-linking of the fibre bundles in determining an absence of elasticity anisotropy for the ligament. In intact tissues, elastin is assembled on a skeleton of microfibrillar glycoproteins, and there is debate as to whether these microfibrils contribute directly to the mechanical properties of the composite elastic fibres. We hope that, in the future, this and similar questions will become accessible through the use of BLS spectroscopy.
Because BLS spectroscopy does not involve contact with, and hence mechanical forces to be applied to, the specimen, it is ideally suited to—and has already been demonstrated for [19]—human in vivo applications, where contact is not possible or desirable. BLS microscopy can become an important tool for routine diagnosis of disease, also in combination with Raman spectroscopy if suitable fibre-optic devices become available [47,48]. Analysis of the elasticity and composition of vascular tissue might, for example, allow identification of diabetes and cardiovascular disease.
Acknowledgement
We thank Dr Alessandro Di Michele for helpful contribution to SEM analysis.
Appendix A
In the BLS experiments, we used the backscattering configuration shown in figure 2a. The incident (ki) light from the laser passes through a lens, is refracted at the air–sample interface (k′i = nki with n the refractive index) and is focused at the interface between the sample and substrate; the scattered light (k′s = nks) can originate both from bulk phonons with wavevector qb = 2nki and, after reflection, from bulk phonons with qs = 2k′i sin(ϕ′) = 2ki sin(ϕ), travelling parallel to the surface (PS modes) [31,32].
A typical BLS spectrum is thus characterized by two doublets, i.e. the Stokes and anti-Stokes parts of the spectrum of light scattered by longitudinal acoustic modes propagating at a velocity VL of approximately 3 km s−1 in the sample, along the two directions given by qb and qs. The peaks in the spectra are localized at frequencies ωb = ±VLqb and ωs = ±VLqs.
The velocity of the acoustic modes can thus be directly obtained from the measured value of ωs and from the scattering geometry (qs = 2ki sin(ϕ)) without the need for a separate evaluation of the refractive index. This condition is usually achieved by using the so-called platelet configuration and a 90° scattering geometry [24]. However, the configuration with the sample mounted onto a reflecting substrate adopted here has the great advantage of being self-aligning because it uses a single lens for both sending and collecting light from the sample. In addition, for isotropic samples or for directions possessing high symmetry, the refractive index of the sample can also be obtained by the frequency position of the Brillouin peaks, through the relationship n = sin(ϕ)ωb/ωs.
Fixing ϕ = π/4, longitudinal acoustic wave velocities were derived as VL = ωs/qs = νλ/√2, ν is the frequency of the mode obtained by curve-fit analysis of the low-frequency peaks (see §2.2) and λ is the excitation wavelength, 532 nm.
The velocity of these waves is expressed by the relation [24]
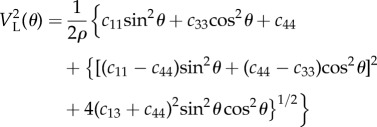 |
A 1 |
where ρ is the density of the material, and c11, c33, c44 and c13 are four of the five elastic constants that characterize systems with a hexagonal symmetry. The fifth constant, c12, can be derived from the approximate relation c12∼c11 – 2c44 [24].
There are two special cases that simplify equation (A 1). As it can be seen in figure 2b, when θ = 90°, qs and qb are both orthogonal to z (θ = α = 90°), hence the acoustic wave velocities giving rise to the two peaks are the same and equal to √(c11/ρ), thus providing the value of c11. When θ = 0°, it is found that VL = √(c33/ρ), hence the second elastic coefficient can be determined.
Moreover, the transverse acoustic wave velocity is given by [24]
| A 2 |
which can be determined from the measurement of the depolarized, VH spectrum. In our experiments, the transverse mode was detected only for collagen fibres at a given angle (θ = 40°). For collagen, it has also been shown that VT has a little dispersion with angle θ [24]. When θ = 0°, VT = √(c44/ρ), but VT(0) ≈ VT(40), so c44 can be derived from the transverse wave velocity. Equation (A 1) was then used to fit the acoustic wave velocity derived from the PS mode at different angle θ with c11, c33 and c44 fixed at the values obtained above and the remaining elastic constant, c13, freely varying. In the case of elastin, for which the transverse mode was not detected, c44 could not be derived by independent measurement. Thus, in the fit to equation (A 1), we used constraints to ensure positive sound velocities in all directions [36]: c11 > |c12| and c44 > 0, and so we determined the remaining constants. The parallel (axial) and perpendicular (transverse) Young's, shear (G) and bulk (K) moduli, and the Poisson's ratios were calculated according to the relations [24,36]
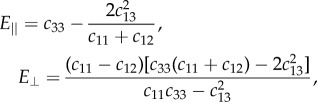 |
A 3 |
The complete data for all four samples studied are shown in table 1.
Funding statement
This study was supported by a research grant from the Italian Autonomous Province of Trento (PAT/GrandiProgetti2012/MaDEleNA, to S.C.).
References
- 1.Mecham RP. 2011. The extracellular matrix: an overview. Berlin, Germany: Springer. [Google Scholar]
- 2.Fung YC. 1993. Biomechanics: mechanical properties of living tissues, 2nd edn New York, NY: Springer. [Google Scholar]
- 3.Palombo F, Cremers SG, Weinberg PD, Kazarian SG. 2009. Application of Fourier transform infrared spectroscopic imaging to the study of effects of age and dietary l-arginine on aortic lesion composition in cholesterol-fed rabbits. J. R. Soc. Interface 6, 669–680. ( 10.1098/rsif.2008.0325) [DOI] [PMC free article] [PubMed] [Google Scholar]
- 4.Palombo F, Shen H, Benguigui LES, Kazarian SG, Upmacis RK. 2009. Micro ATR-FTIR spectroscopic imaging of atherosclerosis: an investigation of the contribution of inducible nitric oxide synthase to lesion composition in ApoE-null mice. Analyst 134, 1107–1118. ( 10.1039/b821425e) [DOI] [PubMed] [Google Scholar]
- 5.Huang S, Ingber DE. 2005. Cell tension, matrix mechanics, and cancer development. Cancer Cell 8, 175–176. ( 10.1016/j.ccr.2005.08.009) [DOI] [PubMed] [Google Scholar]
- 6.Baker EL, Srivastava J, Yu D, Bonnecaze RT, Zaman MH. 2011. Cancer cell migration: integrated roles of matrix mechanics and transforming potential. PLoS ONE 6, e20355 ( 10.1371/journal.pone.0020355) [DOI] [PMC free article] [PubMed] [Google Scholar]
- 7.Katira P, Bonnecaze RT, Zaman MH. 2013. Modeling the mechanics of cancer: effect of changes in cellular and extra-cellular mechanical properties. Front. Oncol. 3, 145 ( 10.3389/fonc.2013.00145) [DOI] [PMC free article] [PubMed] [Google Scholar]
- 8.Mierke CT. 2014. The fundamental role of mechanical properties in the progression of cancer disease and inflammation. Rep. Prog. Phys. 77, 076602 ( 10.1088/0034-4885/77/7/076602) [DOI] [PubMed] [Google Scholar]
- 9.Mouw JK, et al. 2014. Tissue mechanics modulate microRNA-dependent PTEN expression to regulate malignant progression. Nat. Med. 20, 360–367. ( 10.1038/nm.3497) [DOI] [PMC free article] [PubMed] [Google Scholar]
- 10.Palombo F, Madami M, Stone N, Fioretto D. 2014. Mechanical mapping with chemical specificity by confocal Brillouin and Raman microscopy. Analyst 139, 729–733. ( 10.1039/C3AN02168H) [DOI] [PubMed] [Google Scholar]
- 11.Galvis L, Dunlop JWC, Duda G, Fratzl P, Masic A. 2013. Polarized Raman anisotropic response of collagen in tendon: towards 3D orientation mapping of collagen in tissues. PLoS ONE 8, e63518 ( 10.1371/journal.pone.0063518) [DOI] [PMC free article] [PubMed] [Google Scholar]
- 12.Heim AJ, Matthews WG, Koob TJ. 2006. Determination of the elastic modulus of native collagen fibrils via radial indentation. Appl. Phys. Lett. 89, 181902 ( 10.1063/1.2367660) [DOI] [Google Scholar]
- 13.Wenger MPE, Bozec L, Horton MA, Mesquida P. 2007. Mechanical properties of collagen fibrils. Biophys. J. 93, 1255–1263. ( 10.1529/biophysj.106.103192) [DOI] [PMC free article] [PubMed] [Google Scholar]
- 14.Grant CA, Brockwell DJ, Radford SE, Thomson NH. 2008. Effects of hydration on the mechanical response of individual collagen fibrils. Appl. Phys. Lett. 92, 233902 ( 10.1063/1.2937001) [DOI] [Google Scholar]
- 15.Grant CA, Brockwell DJ, Radford SE, Thomson NH. 2009. Tuning the elastic modulus of hydrated collagen fibrils. Biophys. J. 97, 2985–2992. ( 10.1016/j.bpj.2009.09.010) [DOI] [PMC free article] [PubMed] [Google Scholar]
- 16.Shen ZL, Kahn H, Ballarini R, Eppell SJ. 2011. Viscoelastic properties of isolated collagen fibrils. Biophys. J. 100, 3008–3015. ( 10.1016/j.bpj.2011.04.052) [DOI] [PMC free article] [PubMed] [Google Scholar]
- 17.Green EM, Mansfield JC, Bell JS, Winlove CP. 2014. The structure and micromechanics of elastic tissue. Interface Focus 4, 20130058 ( 10.1098/rsfs.2013.0058) [DOI] [PMC free article] [PubMed] [Google Scholar]
- 18.Basser PJ, Schneiderman R, Bank RA, Wachtel E, Maroudas A. 1998. Mechanical properties of the collagen network in human articular cartilage as measured by osmotic stress technique. Arch. Biochem. Biophys. 351, 207–219. ( 10.1006/abbi.1997.0507) [DOI] [PubMed] [Google Scholar]
- 19.Scarcelli G, Yun SH. 2012. In vivo Brillouin optical microscopy of the human eye. Opt. Express. 20, 9197–9202. ( 10.1364/OE.20.009197) [DOI] [PMC free article] [PubMed] [Google Scholar]
- 20.Brillouin L. 1922. Diffusion de la lumière et des rayonnes X par un corps transparent homogène; influence de l'agitation thermique. Ann. Phys. 17, 88–122. [Google Scholar]
- 21.Harley R, James D, Miller A, White JW. 1977. Phonons and the elastic moduli of collagen and muscle. Nature 267, 285–287. ( 10.1038/267285a0) [DOI] [PubMed] [Google Scholar]
- 22.Randall J, Vaughan JM, Cusak S. 1979. Brillouin scattering in systems of biological significance [and discussion]. Phil. Trans. R. Soc. Lond. A 293, 341–348. ( 10.2307/36632) [DOI] [Google Scholar]
- 23.Vaughan JM, Randall JT. 1980. Brillouin scattering, density and elastic properties of the lens and cornea of the eye. Nature 284, 489–491. ( 10.1038/284489a0) [DOI] [PubMed] [Google Scholar]
- 24.Cusack S, Miller A. 1979. Determination of the elastic constants of collagen by Brillouin light scattering. J. Mol. Biol. 135, 39–51. ( 10.1016/0022-2836(79)90339-5) [DOI] [PubMed] [Google Scholar]
- 25.Royer D, Dieulesaint E. 2000. Elastic waves in solids i: free and guided propagation. Berlin, Germany: Springer. [Google Scholar]
- 26.Holliday L. 1975. The stiffness of polymers in relation to their structure. In Structure and properties of oriented polymers (ed. Ward IM.), Springer Series in Materials Science, pp. 242–263. Amsterdam, The Netherlands: Springer. [Google Scholar]
- 27.Fioretto D, Corezzi S, Caponi S, Scarponi F, Monaco G, Fontana A, Palmieri L. 2008. Cauchy relation in relaxing liquids. J. Chem. Phys. 128, 214502 ( 10.1063/1.2932105) [DOI] [PubMed] [Google Scholar]
- 28.Tao NJ, Lindsay SM, Rupprecht A. 1987. The dynamics of the DNA hydration shell at gigahertz frequencies. Biopolymers 26, 171–188. ( 10.1002/bip.360260202) [DOI] [PubMed] [Google Scholar]
- 29.Lee SA, Lindsay SM, Powell JW, Weidlich T, Tao NJ, Lewen GD, Rupprecht A. 1987. A Brillouin scattering study of the hydration of Li- and Na-DNA films. Biopolymers 26, 1637–1665. ( 10.1002/bip.360261002) [DOI] [PubMed] [Google Scholar]
- 30.Tao NJ, Lindsay SM, Rupprecht A. 1988. Dynamic coupling between DNA and its primary hydration shell studied by Brillouin scattering. Biopolymers 27, 1655–1671. ( 10.1002/bip.360271010) [DOI] [PubMed] [Google Scholar]
- 31.Fioretto D, Carlotti G, Palmieri L, Socino G, Verdini L, Livi A. 1993. Structural relaxation in polymeric films studied by Brillouin light spectroscopy. Phys. Rev. B 47, 15 286–15 289. ( 10.1103/PhysRevB.47.15286) [DOI] [PubMed] [Google Scholar]
- 32.Ruta B, Monaco G, Scarponi F, Fioretto D, Andrikopoulos KS. 2011. Brillouin light scattering study of polymeric glassy sulfur. J. Non-Cryst. Solids 357, 563–566. ( 10.1016/j.jnoncrysol.2010.07.028) [DOI] [Google Scholar]
- 33.Soskel NT, Wolt TB, Sandberg LB. 1987. Isolation and characterization of insoluble and soluble elastins. In Methods in enzymology, vol. 144 (ed. Leon WC.), pp. 196–214. San Diego, CA: Academic Press. [DOI] [PubMed] [Google Scholar]
- 34.Lansing AI, Rosenthal TB, Alex M, Dempsey EW. 1952. The structure and chemical characterization of elastic fibers as reveled by elastase and by electron microscopy. Anat. Rec. 114, 555–575. ( 10.1002/ar.1091140404) [DOI] [PubMed] [Google Scholar]
- 35.Comez L, Masciovecchio C, Monaco G, Fioretto D. 2012. Progress in liquid and glass physics by Brillouin scattering spectroscopy. In Solid state physics, vol. 63 (eds Robert EC, Robert LS.), pp. 1–77. San Diego, CA: Academic Press. [Google Scholar]
- 36.Koski KJ, Akhenblit P, McKiernan K, Yarger JL. 2013. Non-invasive determination of the complete elastic moduli of spider silks. Nat. Mater. 12, 262–267. ( 10.1038/nmat3549) [DOI] [PubMed] [Google Scholar]
- 37.Fioretto D, Scarponi F. 2009. Dynamics of a glassy polymer studied by Brillouin light scattering. Mater. Sci. Eng. A 521–522, 243–246. ( 10.1016/j.msea.2008.09.095) [DOI] [Google Scholar]
- 38.Madami M, Gubbiotti G, Tacchi S, Carlotti G. 2012. Application of microfocused Brillouin light scattering to the study of spin waves in low-dimensional magnetic systems. In Solid state physics, vol. 63 (eds Robert EC, Robert LS.), pp. 79–150. San Diego, CA: Academic Press. [Google Scholar]
- 39.Scandola M, Pezzin G. 1980. Density of elastin–water system. In Water in polymers. ACS Symp. Series 127, pp. 225–234. Washington, DC: American Chemical Society. [Google Scholar]
- 40.Maroudas A, Bannon C. 1981. Measurement of swelling pressure in cartilage and comparison with the osmotic pressure of constituent proteoglycans. Biorheology 18, 619–632. [DOI] [PubMed] [Google Scholar]
- 41.Homicz MR, McGowan KB, Lottman LM, Beh G, Sah RL, Watson D. 2003. A compositional analysis of human nasal septal cartilage. Arch. Facial Plast. Surg. 5, 53–58. ( 10.1001/archfaci.5.1.53) [DOI] [PubMed] [Google Scholar]
- 42.Bella J, Brodsky B, Berman HM. 1995. Hydration structure of a collagen peptide. Structure 3, 893–906. ( 10.1016/S0969-2126(01)00224-6) [DOI] [PubMed] [Google Scholar]
- 43.Corezzi S, Caponi S, Rossi F, Fioretto D. 2013. Stress-induced modification of the boson peak scaling behavior. J. Phys. Chem. B 117, 14 477–14 485. ( 10.1021/jp4054742) [DOI] [PubMed] [Google Scholar]
- 44.Caponi S, Fontana A, Rossi F, Baldi G, Fabiani E. 2007. Effect of temperature on the vibrational density of states in vitreous SiO2: a Raman study. Phys. Rev. B 76, 092201 ( 10.1103/PhysRevB.76.092201) [DOI] [Google Scholar]
- 45.Still T, Mattarelli M, Kiefer D, Fytas G, Montagna M. 2010. Eigenvibrations of submicrometer colloidal spheres. J. Phys. Chem. Lett. 1, 2440–2444. ( 10.1021/jz100774b) [DOI] [Google Scholar]
- 46.Cusack S, Lees S. 1984. Variation of longitudinal acoustic velocity at gigahertz frequencies with water content in rat-tail tendon fibers. Biopolymers 23, 337–351. ( 10.1002/bip.360230212) [DOI] [PubMed] [Google Scholar]
- 47.Day JC, Bennett R, Smith B, Kendall C, Hutchings J, Meaden GM, Born C, Yu S, Stone N. 2009. A miniature confocal Raman probe for endoscopic use. Phys. Med. Biol. 54, 7077–7087. ( 10.1088/0031-9155/54/23/003) [DOI] [PubMed] [Google Scholar]
- 48.Day JC, Stone N. 2013. A subcutaneous Raman needle probe. Appl. Spectrosc. 67, 349–354. ( 10.1366/12-06651) [DOI] [PubMed] [Google Scholar]