Abstract
Flight feathers have evolved under selective pressures to be sufficiently light and strong enough to cope with the stresses of flight. The feather shaft (rachis) must resist these stresses and is fundamental to this mode of locomotion. Relatively little work has been done on rachis morphology, especially from a mechanical perspective and never at the nanoscale. Nano-indentation is a cornerstone technique in materials testing. Here we use this technique to make use of differentially oriented fibres and their resulting mechanical anisotropy. The rachis is established as a multi-layered fibrous composite material with varying laminar properties in three feathers of birds with markedly different flight styles; the Mute Swan (Cygnus olor), the Bald Eagle (Haliaeetus leucocephalus) and the partridge (Perdix perdix). These birds were chosen not just because they are from different clades and have different flight styles, but because they have feathers large enough to gain meaningful results from nano-indentation. Results from our initial datasets indicate that the proportions and orientation of the laminae are not fixed and may vary either in order to cope with the stresses of flight particular to the bird or with phylogenetic lineage.
Keywords: rachis, feather, nano-indentation, computed tomography
1. Introduction
Feathers are the most complex integumentary derivatives found in any vertebrate animal [1–3]. Although these structures are now known from fossils comprising almost all major paravian theropod dinosaur lineages [4–8], the β-keratin protein that makes up the feathers of living birds has long been thought to be a unique synapomorphy of the avian lineage (Aves/Avialae depending on usage) [9]. From the fossil record, we know that flight feathers on the forewings of dinosaurs have been evolving since at least the latest Jurassic [10] under two basic evolutionary pressures; to be light enough to facilitate flight and to be strong enough to sustain aerodynamic loading [11,12].
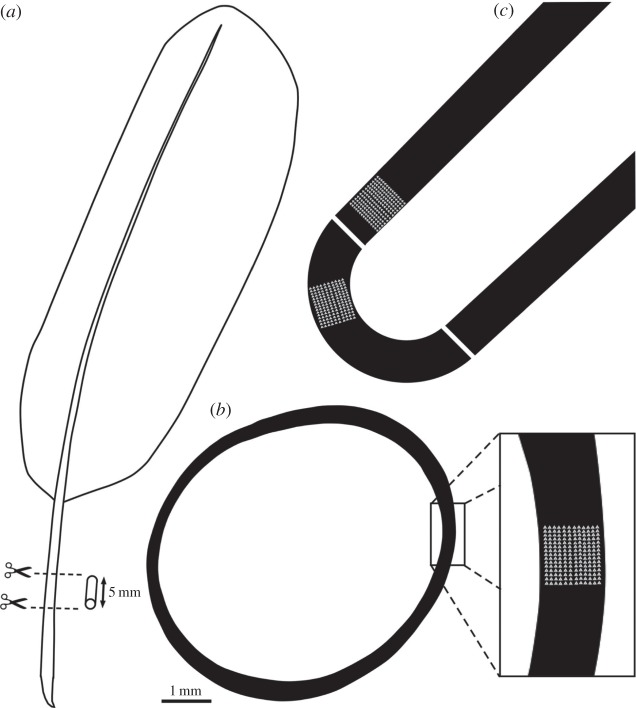
One of the key anatomical features of dinosaur flight feathers is a more-or-less circular central core (figure 1a), the rachis [12]. However, relatively little work has been done on the morphology of the avian rachis, especially from a mechanical perspective. While we know that feather rachises consist of keratin micro-layers, or laminae, the exact number of these layers remains uncertain. Busson et al. [13] reported three laminae (four including a superficial lipid membrane) in a peacock feather and, more recently, Lingham-Soliar et al. [14] reported two functional laminae in chicken feathers. It is also not known whether these keratin micro-laminae are an artefact of development or whether they evolved as a mechanism to cope with multi-directional stresses. While loading at the distal end of a feather is mostly in the dorso-ventral plane [15], the opposite is true at the proximal end where stress is multi-directional and rotatory [15] and transmitted to the skeleton by the muscles and tendons of the postpatagium as well as by direct skeletal articulation [16]. If the presence of laminae is a result of evolution rather than growth, variation in the number of laminae, their thickness and fibre orientation within them might be expected. One might even hypothesize that layers are orientated in such a way as to increase the rachises' resistance to multi-directional stresses.
Figure 1.
(a) The sampling location on a whole feather. (b) A traced cross section shows how replicate indentation maps were positioned on the cross sections of feather samples removed from C. olor, H. leucocephalus and P. perdix. (c) The C. olor section was split again, length ways, to yield a further longitudinal section.
These relationships can be investigated using nano-indentation, a technique that enables small volumes of material to be mechanically characterized. We know that β-keratin has a fibrous, microtubular microstructure [14] embedded in a substantia composed of an amorphous protein [17]. Similar to other fibre composite materials, we therefore expect the mechanical response of the feather β-keratin composite to be very different when tested in different directions [18], which provides an opportunity to identify laminae on the basis of this mechanical variation. Nano-indentation was performed previously by Bachmann et al. [15] on Barn Owl (Tyto alba) and Rock Dove (Columba livia) rachises and yielded values between 5 and 7 GPa. However, only small grids of indents were performed and did not span across multiple laminae (T Bachmann 2014, personal communication). The aim of our study was to determine whether nano-indentation can indeed be used to identify laminae within feather rachises and to investigate differences in the laminae of three primary feathers from a Mute Swan (Cygnus olor), a Bald Eagle (Haliaeetus leucocephalus) and a partridge (Perdix perdix). Ultra high resolution computed X-ray tomography (CT) has also become an increasingly useful tool in materials science. As resolution capabilities become ever smaller it has enabled nano-scale imaging of individual fibres in composite materials, and the use of appropriate software to measure laminar proportions and fibre orientation, which in this case will validate the nano-indentation method.
2. Material and methods
2.1. Sample preparation
The longest primaries (fourth-most distal) were excised from an intact wing of recently deceased birds. It is important that feathers are harvested from the bird because feathers are shed at the end of their mechanical life. Furthermore, the feathers must be fresh, as hydration is known to affect the mechanical properties of keratin [19,20]. Testing the material properties of moulted or dehydrated feathers would yield misleading data.
Sections measuring 5 mm in length (figure 1a) were removed from the feather calami of C. olor and P. perdix as well as from a primary feather of unknown position on the wing of H. leucocephalus. Sections were removed with a band saw at 30% of total length of the entire feather from the base. Sections were then embedded in an 8 : 1 mix (by weight) of Struers' EpoFix and EpoFix hardener inside a cylindrical mould. Each sample was ground down to expose the rachis cross section on fixed-grit papers and auto-polished through progressively finer compounds, finishing with a 1 µm diamond paste. This particular resin was selected because it is too viscous to penetrate samples; in the case of feathers, rachises are also protected from resin impregnation by a lipid membrane. Furthermore, Epofix exhibits cure-induced shrinkage and retreats back from the sample to ensure that the resin matrix does not influence the mechanical properties of the sample.
To further investigate anisotropy within the lamina, the Mute Swan sample was sectioned at 90° (figure 1c) to the original cross section using a Buehler low speed diamond wafering saw. The new longitudinal section's surface was also polished to a 1 µm diamond finish.
2.2. Nano-indentation
Nano-indentation testing was performed on a MicroMaterials Vantage nano-indentation system, capable of resolving force and displacement to 3 nN and 0.001 nm, respectively [21]. The indentations were run in depth control to 500 nm, at a loading rate of 0.05 mNs−1; with a 40 s hold at peak load to reduce the effect of viscoelasticity on the modulus results. The indentations were spaced 15 µm apart to avoid overlapping interaction volumes, with the number of indents varying between feathers to ensure the map spanned the width of the rachis cross section. The diamond area function of the Berkovich diamond tip was calibrated before the first experiment and the indenter was checked on a fused silica standard before each new map. A single map was performed across each feather rachis, with two additional maps on C. olor: one more on the cross section and a corresponding map on the longitudinal section as per figure 1b. Load–displacement curves were evaluated using the method in Oliver & Pharr [22] to provide reduced modulus (Er) values.
2.3. Ultra high resolution computed tomography scanning
We used a Zeiss Xradia Versa XRM-510 X-ray microscope to perform the CT scanning. A matchstick section was removed from the C. olor sample, with the same diamond wafering saw used for longitudinal sectioning. Residual Epofix was removed and the sample mounted directly in the chuck of the CT work piece, surrounded by air. The source to sample distance was 11.4 mm, and source to detector distance 16.9 mm. The X-ray voltage was set to 80 kVp with a current of 87.5 µA, to minimize exposure time. No additional filtration was used on the source.
A total of 2401 equiangular projections were taken in total across the full rotation of the sample, each with an exposure time of 15 s, for a scan time of approximately 10 h (after a warm-up period of 1 h). An Andor CCD camera with a pixel count of 2048 × 2048 was used to capture the projections; 2× binning was used to yield radiographs of 990 × 990 pixels (after ring artefact minimization correction). Using the 20× objective, the achieved resolution was 794 nm per voxel.
3. Results
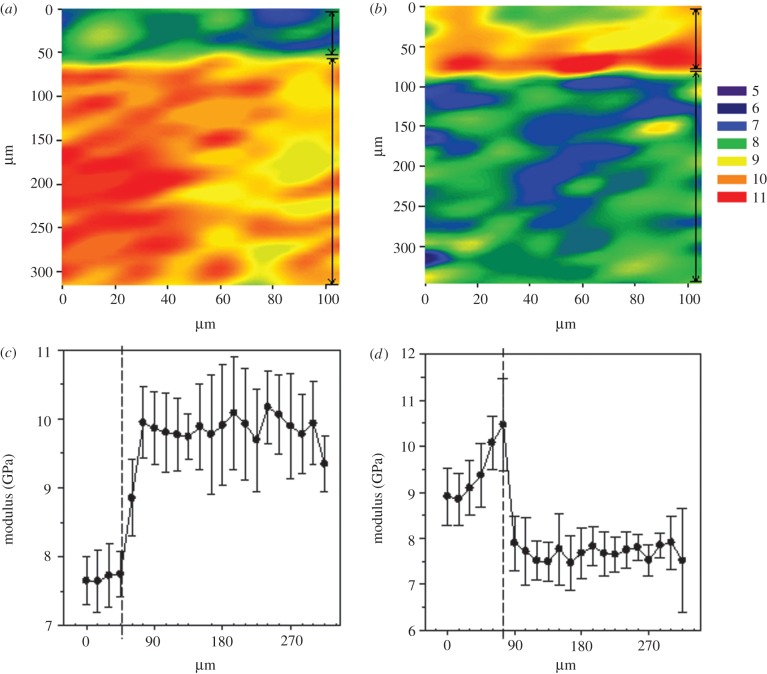
The Er results from indentation maps of the second C. olor calamus cross section and corresponding longitudinal section are shown in table 1. Two laminae were detected in the C. olor calamus cross- (figure 2a,c) and longitudinal sections (figure 2b,d). A Mann–Whitney U test confirms significantly different modulus values between the inner and outer laminae in both orientations U (174) = 9.0, p ≤ 0.001 and U (214) = 331.0, p ≤ 0.001 respectively. The Er results from the outer and inner laminae were reversed when tested in the two different orientations.
Table 1.
Mean modulus values for significantly different laminae (GPa) ± s.d. (3 sig. fig.).
| layer | H. leucocephalus | P. perdix |
C. olor |
||
|---|---|---|---|---|---|
| cross section I | cross section II | long section | |||
| 1 | 8.81 ± 0.39 | 5.86 ± 0.76 | 4.98 ± 0.72 | 7.78 ± 0.44 | 9.46 ± 0.90 |
| 2 | 7.76 ± 0.43 | 7.38 ± 0.76 | 8.31 ± 0.36 | 9.84 ± 0.63 | 7.78 ± 0.56 |
| 3 | 9.33 ± 0.47 | 8.81 ± 0.55 | 9.85 ± 0.52 | ||
| 4 | 9.1 ± 0.40 | ||||
Figure 2.
Nano-indentation contour maps display reduced modulus of the C. olor sample and reveal two mechanically distinct laminae on (a) the cross-sectional approach and (b) longitudinal-sectional approach. This implies a change in the direction of fibre orientation more clearly demonstrated in line graphs of average modulus values along the breadth of the lamina versus distance from the outer edge of the indentation map ± s.d. in (c) the cross-sectional approach and (d) the longitudinal-sectional approach. Decreasing numbered colours correspond to reduced modulus values in GPa. Vertical lines at the right edge of each map, and graph drop lines identify individual layers. Full data are available in the electronic supplementary material.
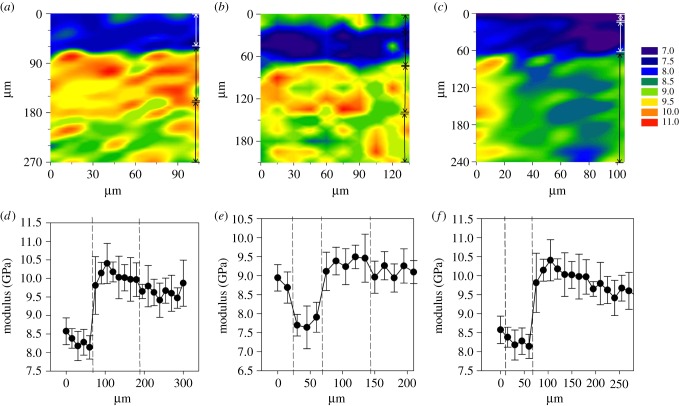
Figure 3 shows cross-sectional indentation maps of the three feathers. Three laminae were detected in P. perdix and C. olor, with a fourth laminae detected in H. leucocephalus. In each feather the laminae Er values were significantly different, confirmed by Kruskal–Wallis tests in C. olor [H(2) = 103.813, p ≤ 0.001], and P. perdix [H(2) = 75.162, p ≤ 0.001] and a one-way ANOVA in H. leucocephalus [F3,146 = 92.941, p ≤ 0.001]. Mean modulus values for each lamina are presented in table 1.
Figure 3.
Nano-indentation contour maps display reduced modulus values (a) C. olor, (b) H. leucocephalus and (c) P. perdix. Decreasing numbered colours correspond to reduced modulus values in GPa. Corresponding line graphs beneath show the average modulus values along replicate rows of indents versus distance from the outside limit of the indentation map ± s.d. in (d) C. olor, (e) H. leucocephalus and (f) P. perdix. Three laminae are seen in C. olor (a,d), and P. perdix (c,f) and four in H. leucocephalus (b,e). Vertical arrow lines at the right edge of each map and graph drop lines identify individual layers. Full data are available in the electronic supplementary material.
Figure 4 shows sample load–displacement curves; one from each layer observed in H. leucocephalus. A typical load–displacement relationship is shown, which conforms to the simple power law [23]
where P = load (max), h = displacement (max), hf = final depth, and α and m are power law fitting constants. In this case, mean values for α = 0.001939 and m = 1.96452. Curves which conform to this power law are well suited to evaluation by the method in Oliver & Pharr [22]. Their method uses the tangential slope (dP/dH) of the unloading phase of the load/displacement line to compute the reduced modulus [23].
where A is the contact area and S is the measured stiffness (dP/dH). Reduced modulus (Er) is used in place of Young's modulus, because calculating a reduced modulus accounts for the compliance of a non-rigid indenter [23]. The indenter was calibrated on fused silica before each array of indentations.
Figure 4.
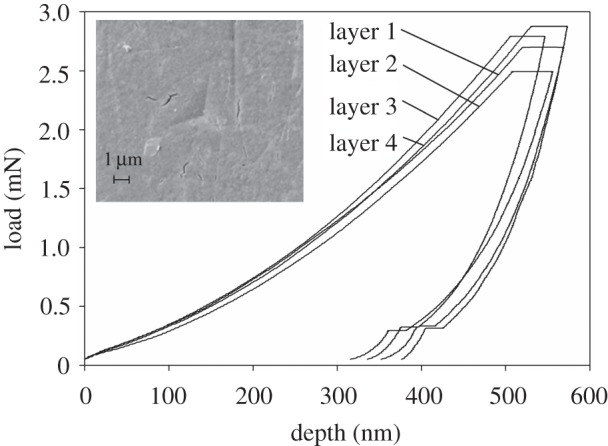
Sample load–displacement curves from the four layers seen in the H. leucocephalus section, and an SEM image of an indentation.
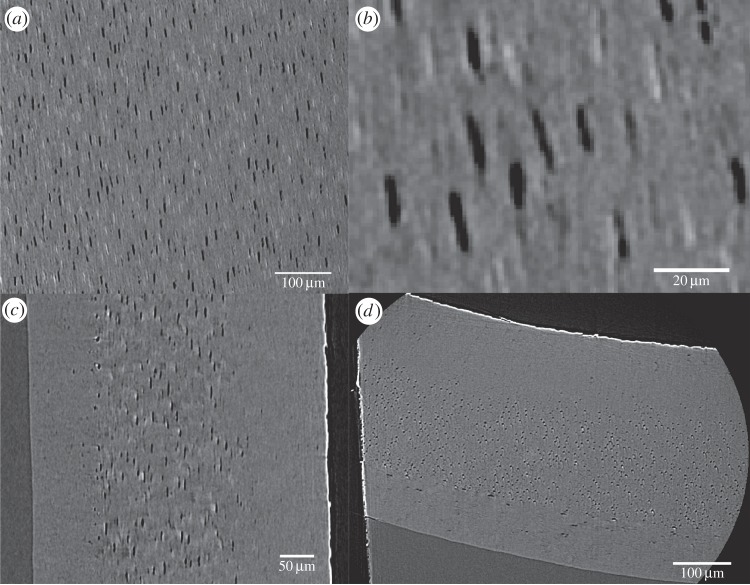
High-resolution CT of a matchstick sample of C. olor confirms fibre orientation anisotropy identified by the nano-indentation. Figure 5 shows three clear layers within the rachis cross section, represented graphically in figure 6. The outer layer of circumferentially oriented layers is directed approximately 45° relative to the middle layer of longitudinal fibres. The fibres of the innermost layer are directed between 5° and 10° relative to the middle layer and also run longitudinally.
Figure 5.
Ultra high resolution CT scanning of a sample from C. olor. (a) A view of the central layer clearly shows oriented fibres. The darker fibres are of higher density than the grey amorphous embedding protein. (b) A close-up shows individual fibres. The fibres measured here are approximately 3 μm in diameter/9.5 μm in circumference. (c) A section through the sample shows three layers. The fibres of the outer layer are end-on. (d) The whole sample is seen, this time from a different viewpoint. The fibres of the central layer are now end-on and differential fibre orientation is confirmed.
Figure 6.
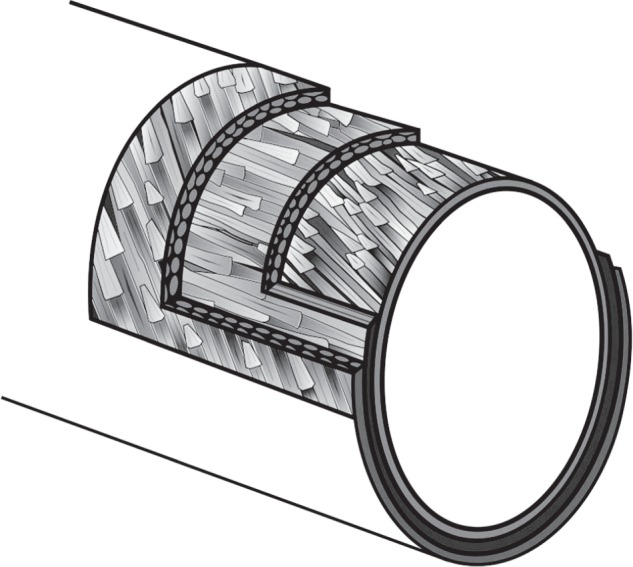
A schematic of multiple laminae of differentially oriented fibres.
4. Discussion
Our study is the first to use nano-indentation mapping to identify laminae in bird feather rachises. This technique, however, relies on the differing orientations of the β-keratin fibres within the laminae identified by Lingham-Soliar et al. [14] and their resulting anisotropy for differentiation. This mechanical anisotropy was demonstrated in the modulus results, with the same two laminae identifiable in the longitudinal section as in the cross-sectional approach, but with reversed Er values. The Er values reflect the resistance of the material within the indent interaction volume to elastic deformation. Beam theory suggests the highest Er values would result from indenting the fibre axes parallel to loading while the lowest would be measured while indenting from a perpendicular approach [24]. The CT scan confirms this hypothesis. Our findings thus corroborate previous works [14] which have demonstrated that laminae contain differentially orientated β-keratin fibres in an amorphous protein substantia. In all five datasets we have produced, there is deviation around mean Er for a particular line of indentations across a rachis section, resulting from inhomogeneity within the matrix of the laminae. The 500 nm indentations interrogate an interaction volume equivalent to a half-sphere with a 5 µm radius. The β-keratin fibres are relatively stiff compared to the inter-fibre matrix and so the output values will vary depending on the material within the interaction volume.
Previous work by Bachmann et al. [15] used nano-indentation to investigate the innermost laminae of the rachis of T. alba and C. livia (T Bachmann 2014, personal communication). Evidence from this study means it is likely that the mechanical differences reported Bachmann et al. [15] between feathers are caused by extrinsic differences in fibre orientation rather than a change in the mechanics of the intrinsic properties of the constituent β-keratin. Modulus values reported after larger tissue bending tests [15,25,26] are not comparable to our study because they test the structure as a whole and therefore incorporate all the laminae. The mechanical values of the β-keratin protein itself currently remain unknown.
We identified two laminae in one of the C. olor cross sections and its corresponding longitudinal section. This agrees with the configuration observed by Lingham-Soliar et al. [14]. By contrast, our technique identified three laminae in replicate maps on another cross-sectional sample of C. olor and in P. perdix but recognized four laminae in H. leucocephalus. Three rachis laminae (four including an outer lipid membrane) have previously been reported in a peacock feather using X-ray microdiffraction [13]. Busson et al. observed two ‘feather’ laminae with a thin (25 µm) amorphous protein lamina in between. Figure 2a,b does arguably show a thin lamina at the interface although it is more likely that none of the indentations landed directly on this proposed amorphous lamina and this is an artefact of the graphing software's interpolation algorithm.
The scanning electron microscope (SEM) image presented by Lingham-Soliar [14] after microbial degradation does show Busson et al.'s [13] two ‘feather’ laminae but the nature of the degradation combined with their imaging method make it difficult to distinguish the amorphous lamina from the embedding substantia. It should be noted that we do not observe an amorphous lamina in between fibre laminae on any nano-indentation maps, nor in the CT scan, all of which show an abrupt transition from one fibrous lamina to another.
If a third ‘feather’ lamina was missed by this approach there are a number of possibilities: it may be difficult to differentiate laminae if the matrix-degradation leaves fibres loose and able to change their orientation slightly, or at least enough to hide subtle variations in orientation. Alternatively, if differences in orientation are subtle to begin with they might not be sufficiently different enough to diffract Busson et al.'s X-rays, or even show up on our modulus mapping; if the two innermost laminae are at similar orientations to the indenter tip despite being relatively different, they may also have been reported as a single lamina in the second indentation of C. olor. Further work is clearly needed to compare and contrast the two approaches as neither Lingham-Soliar et al. [14], nor Busson et al. [13] reported the location in the wing from where they sampled feathers. It is possible that the number of rachis laminae also varies along the wing.
Although our sample is limited, the number of laminae appears to vary according to flight style as opposed to phylogeny. C. olor is an anseriform, uncontroversially among the first of the taxa we examined to diverge from the neoavian lineage along with galliforms (Galloanserae of many workers). P. perdix, Gallus gallus and Pavo sp. (the peacock) are all Galliformes [27]. Our other sampled taxon, H. leucocephalus, is an accipitriform, which diverged later from the neoavian lineage.
If the number of laminae were a systematic variable, we would expect to see the number of laminae becoming fewer or greater over evolutionary time. This is not the case and so it is more likely the laminar configuration varies to cope with differing demands of flight styles. H. leucocephalus is a glider and spends most of its time soaring. C. olor is a much heavier continuous flapper, which must ask much more of its feathers, especially during marine take-off because it cannot jump. The galliforms tested here are all burst flyers that are not capable of sustained flight and must flap the wings frantically to get off the ground. These differences in flight style would require the feather rachises to perform very differently in the way they respond to aerodynamic stresses and this performance may be a limiting factor in galliforme flight ability. However, without a much larger study it would be difficult to imply whether phylogeny does not impact rachis configuration because flight style and phylogeny are correlated.
Great care should be taken when considering chicken feathers' resistance against aerodynamic loading because this evolutionary pressure has long been removed. Chickens became domesticated and lost their ability to properly fly approximately 5000 years ago [28]. With such a small effective population and strong artificial selection it might be possible that chicken feathers have changed in recent evolutionary history.
5. Conclusion
The method we develop here is quicker and easier than the microbial degradation approach of Lingham-Soliar et al. [14]. The CT scan validates the method and proves the link between Er values and fibre orientation. The implications of our results compared with those of previous studies are that the number, and/or thickness, of laminae varies around the circumference of the rachis, along the feather's length and between phylogenetically diverse taxa and/or birds of differing flight styles. More work is required to determine the origins of this variation.
Supplementary Material
Acknowledgements
We thank Bob Jones and John Ford (University of Southampton Ocean and Earth Sciences) for help with sample preparation and Kate Davis (National Oceanography Centre) for her help in creating figure 6. Slimbridge Wildfowl Trust in Gloucestershire provided a C. olor carcass, Eagle Heights in Kent provided a H. leucocephalus feather and Lee Dart of Newhouse Game in Hampshire provided a P. perdix carcass. The National Oceanography Centre is a CITES Registered Scientific Institution entitled to the exemption provided by Article VII, paragraph 6, of the Convention. CT scanning took place in the µ-vis X-ray Imaging Center (University of Southampton School of Engineering and the Environment). We thank Richard Pearce for his expertise and help in the use of the SEM facilities at the National Oceanography Centre.
References
- 1.Lucas AM, Stettenheim PR. 1972. Avian anatomy: integument (Agricultural handbook 362). Lansing, MI: United States Department of Agriculture. [Google Scholar]
- 2.Chuong C-M, Chodankar R, Widelitz RB, Jiang T-X. 2011. Evo-Devo of feathers and scales: building complex epithelial appendages. Commentary Cheng-Ming Chuong, Rajas Chodankar, Randall B Widelitz 0, 449–456. [DOI] [PMC free article] [PubMed]
- 3.Lingham-Soliar T. 2013. Feather structure, biomechanics and biomimetics: the incredible lightness of being. J Ornithol. 155, 323–336. ( 10.1007/s10336-013-1038-0) [DOI] [Google Scholar]
- 4.Ji Q, Ji S. 1997. On discovery of the earliest bird fossil in China and the origin of birds. Chin. Geol. 233, 30–33. [Google Scholar]
- 5.Zhou Z, Wang X, Zhang F, Xu X. 2000. Important features of caudipteryx-evidence from two nearly complete new specimens. Vert. PalAsiat. 38, 241–254. [Google Scholar]
- 6.Ji Q, Norell M, Gao K, Ji S, Ren D. 2001. The distribution of integumentary structures in a feathered dinosaur. Nature 410, 1084–1088. ( 10.1038/35074079) [DOI] [PubMed] [Google Scholar]
- 7.Xu X, Guo Y. 2009. The origin and early evolution of feathers: insights from recent Paleontological and Neontological data. Vert. PalAsiat. 47, 311–329. [Google Scholar]
- 8.Xu X, Zheng X, You H. 2010. Exceptional dinosaur fossils show ontogenetic development of early feathers. Nature 464, 1338–1341. ( 10.1038/nature08965) [DOI] [PubMed] [Google Scholar]
- 9.Greenwold MJ, Sawyer RH. 2013. Molecular evolution and expression of archosaurian β-keratins: diversification and expansion of archosaurian β-keratins and the origin of feather β-keratins. J. Exp. Zool. B Mol. Dev. Evol. 20, 393–405. ( 10.1002/jez.b.22514) [DOI] [PubMed] [Google Scholar]
- 10.Hu D, Hu L, Zhang L, Xu X. 2009. A pre-Archaeopteryx troodontid theropod from China with long feathers on the metatarsus. Nature 461, 640–643. ( 10.1038/nature08322) [DOI] [PubMed] [Google Scholar]
- 11.Clark CJ. 2009. Courtship dives of Anna's hummingbird offer insights into flight performance limits. Proc. R. Soc. B 276, 3047–3052. ( 10.1098/rspb.2009.0508) [DOI] [PMC free article] [PubMed] [Google Scholar]
- 12.Nudds RL, Dyke GJ. 2010. Narrow primary feather rachises in Confuciusornis and Archaeopteryx suggest poor flight ability. Science 328, 887–889. ( 10.1126/science.1188895) [DOI] [PubMed] [Google Scholar]
- 13.Busson B, Engström P, Doucet J. 1999. Existence of various structural zones in keratinous tissues revealed by X-ray microdiffraction. J. Synchrotron. Radiat. 6, 1021–1030. ( 10.1107/S0909049599004537) [DOI] [Google Scholar]
- 14.Lingham-Soliar T, Bonser RHC, Wesley-Smith J. 2010. Selective biodegradation of keratin matrix in feather rachis reveals classic bioengineering. Proc. R. Soc. B 277, 1161–1168. ( 10.1098/rspb.2009.1980) [DOI] [PMC free article] [PubMed] [Google Scholar]
- 15.Bachmann T. 2012. Flexural stiffness of feather shafts: geometry rules over material properties. J. Exp. Biol. 215, 405–415. ( 10.1242/jeb.059451) [DOI] [PubMed] [Google Scholar]
- 16.Pennycuick CJ. 2008. Modelling the flying bird, pp. 105–135. London, UK: Elsevier. [Google Scholar]
- 17.McKittrick J, Chen P-Y, Bodde SG, Yang W, Novitskaya EE, Meyers MA. 2012. The structure, functions, and mechanical properties of keratin. JOM 64, 449–468. ( 10.1007/s11837-012-0302-8) [DOI] [Google Scholar]
- 18.Vinson J, Sierakowski R. 2002. Anisotropic elasticity and composite laminate theory. Behaviour of structures composed of composite materials, 2nd edn Dordrecht, The Netherlands: Kluwer Academic Publishers. [Google Scholar]
- 19.Bertram JE, Gosline JM. 1987. Functional design of Horse hoof keratin: the modulation of mechanical properties through hydration effects. J. Exp. Biol. 130, 121–136. [DOI] [PubMed] [Google Scholar]
- 20.Tombolato L, Novitskaya EE, Chen P-Y, Sheppard FA, McKittrick J. 2010. Microstructure, elastic properties and deformation mechanisms of horn keratin. Acta Biomater. 6, 319–330. ( 10.1016/j.actbio.2009.06.033) [DOI] [PubMed] [Google Scholar]
- 21.MicroMaterials. NanoTest vantage: next generation nanomechanics, pp. 1–8. Wrexham, UK: MicroMaterials. [Google Scholar]
- 22.Oliver WC, Pharr GM. 2011. Measurement of hardness and elastic modulus by instrumented indentation: advances in understanding and refinements to methodology. J. Mater. Res. 19, 3–20. ( 10.1557/jmr.2004.19.1.3) [DOI] [Google Scholar]
- 23.Oliver WC, Pharr GM. 1992. An improved technique for determining hardness and elastic modulus using load and displacement sensing indentation experiments. J. Mater. Res. 7, 613–617. ( 10.1557/JMR.1992.1564) [DOI] [Google Scholar]
- 24.Mallick PK. 1999. Polymeric matrix composites. In Handbook of materials selection for engineering applications (ed. Murray GT.), pp. 314–333. New York, NY: Marcel Dekker Inc. [Google Scholar]
- 25.Purslow P, Vincent J. 1978. Mechanical properties of primary feathers from the pigeon. J. Exp. Biol. 72, 251–260. [Google Scholar]
- 26.Bonser R, Purslow P. 1995. The Young's modulus of feather keratin. J. Exp. Biol. 198, 1029–1033. [DOI] [PubMed] [Google Scholar]
- 27.Hackett SJ, et al. 2008. A phylogenomic study of birds reveals their evolutionary history. Science 320, 1763–1768. ( 10.1126/science.1157704) [DOI] [PubMed] [Google Scholar]
- 28.Ren S. 1995. Gongyuan qian wuqian nian qian Zhongguo xinshiqi wenhua de jixiang zhuyao chengjiu (The main achievements of Chinese Neolithic cultures before 5000 b.c., in Chinese). Kaogu (Archaeology) 328, 37–49. [Google Scholar]
Associated Data
This section collects any data citations, data availability statements, or supplementary materials included in this article.


