Abstract
Background:
There are some evidences that control the blood sugar decreasing the risk of diabetes complications, and even fatal. There are so many studies, but they are mostly cross-sectional and ignore the trend and hence it is necessary to implement a longitudinal study. The aim of this prospective study is to find the trend of glycosylated hemoglobin (HbA1c) over time and the associative factors on it.
Methods:
Participants of this longitudinal study were 3440 eligible diabetes patients referred to Isfahan Endocrine and Metabolism Research Center during 2000-2012 who are measured 2-40 times. A linear mixed model was applied to determine the association between HbA1c and variables, including lipids, systolic, diastolic blood pressure and complications such as nephropathy, and retinopathy. Furthermore, the effect of mentioned variables on trend of HbA1c was determined.
Results:
The fitted model showed total cholesterol, retinopathy, and the method of therapy including oral antidiabetic drugs (OADs) plus insulin and insulin therapy decreased the trend of HbA1c and high-density lipoprotein, weight, hyperlipidemia and the method of therapy including diet, and OADs increased the trend of HbA1c.
Conclusions:
The present study shows that regular visits of diabetic patients as well as controlling blood pressure, lipid profile, and weight loss can improve the trend of HbA1c levels during the time.
Keywords: Hemoglobin A1c, linear mixed models, longitudinal study, trend, type 2 diabetes
INTRODUCTION
One of the health problems in the world is diabetes which is the most common metabolic, chronic and noncommunicable disease and leads to complications and morbidity, decreases quality of life and even death of patients.[1,2] According to estimates of the World Health Organization, if effective action is not taken to prevent diabetes, the number of people suffering from this disease will have increased to 7 million in Iran by 2030. With the prevalence over 8%, Iran is the region with the highest rate of diabetes in the world. Diabetes is the ninth and third leading reason of death among men in Iran and in the world, respectively.[3,4]
The risk of many serious health problems and other diseases are increased by diabetes.[5] Currently, the development of diagnostic and therapeutic facilities for diabetes patients has led to increasing the survival rates and decrease the prevalence of complications of diabetes. Many complications such as ischemic heart disease, stroke, retinopathy, nephropathy, neuropathy, and albuminuria can be prevented by controlling the blood sugar. However, the complete prevention of complications is not possible.[4]
The most conventional methods for measuring blood sugar are fasting blood sugar (FBS), 2-h postprandial blood sugar, and glycosylated hemoglobin (HbA1c). Although FBS is a more reliable method to diagnose diabetes, HbA1c serves as a marker for average blood sugar levels over the past trimester. Moreover, the average life span of blood cells is a more stable method for long-term controlling of diabetes.[6] American Diabetes Association (ADA) recommends that people with diabetes should control their HbA1c at least every 6 months and have regular medical check 2-4 times a year.[7]
Nowadays, there are many pharmaceutical and dietary therapies to improve glycemic control in order to prevent the progression of chronic complications of diabetes. Recognizing the relationship between diabetes complications and the control of blood sugar is the goal of diabetes treatments to achieve HbA1c in the normal range.[4] Many variables affecting HbA1c, as a stable remark of blood sugar, have been investigated in cross-sectional studies, but the nature of the trend of HbA1c along the time is uncertain. Cross-sectional studies are not satisfying to answer these questions. Only through longitudinal-design studies and considering the potentially confounding factors these relationships can be identified. Therefore, it is necessary to run a specified longitudinal study.
Although longitudinal studies need more time, expenses, organizing, continual follow-up, and more sophisticated analysis in compression with cross-sectional studies, they are significantly recommended in order to investigate the possible relationship.[8]
Given the importance of sugar control in preventing complications of diabetes, this study was designed to investigate the trend of HbA1c, as an index of controlling blood sugar levels, and their affecting factors in type 2 diabetes patients using a mixed model.
METHODS
Study design and participants
In this longitudinal study, the data were collected from Isfahan Endocrine and Metabolism Research Center. The data were collected from follow-up diabetes patients referred to this center since 2000. Among the nearly 15,000 patients from 2000 to 2012, 3440 were considered eligible to take part in the study, with minimum 2 and maximum 40 and mean 11 (SD = 7) measuring. Therefore, 36,385 records were created. Inclusion criteria were type 2 diabetes over 30-year-old who had attended the training classes, at least had been referred to the center twice during the time of study and once a year, and had HbA1c test at each referral. Diabetes individual were diagnosed by ADA criteria (fasting plasma glucose ≥ 126 mg/dl or oral glucose tolerance test ≥ 200 or random glucose ≥ 200, and symptom).[9]
Variable assessment
The variables such as age, sex, duration of diabetes, body mass index at the first visit, history of certain diseases during the follow-up, the type of treatment, systolic blood pressure (SBP) and diastolic blood pressure (DBP), and blood lipids including cholesterol (CHOL), triglyceride (TG), high-density lipoprotein (HDL), low-density lipoprotein (LDL), and creatinine as independent variables and HbA1c as a dependent variable are recorded. The new variable that define is age at beginning of diabetes (ABD) calculated from age at the first visit minus duration of diabetes. Moreover, four treatments containing diet, insulin, oral antidiabetic drugs (OADs), and OADs plus insulin as independent variables are used.
Statistical analysis
One of the most basic methods to explain statistical relationships are modeling that could be used to understand the distribution of the response variables. Analysis of mixed models with random effects is an important and useful method for modeling and analyzing the longitudinal data and repeated measurements. Linear mixed models are able to account the correlations of response variables within the units by taking random variables for units’ levels including correlations between observations over time.[10] Since the occurrence of missing data in longitudinal studies is possible, analysis of unbalanced designs and missing data is one of the advantages of this model.[8]
Another advantage of longitudinal studies is separating the effects of individual differences of time effects that are not possible in cross-sectional studies.[11] These studies were usually formed to examine the differences in the experimental units in different times and locations or to evaluate the trend and its influencing factors.[12]
Because of the unequal referrals of patients and missing data in this study, the data set is unbalanced. Therefore, the mixed effects model is used to fit the model as a proper modeling for unbalanced repeated measuring designs. First of all, in the present of all factors as fixed effects, random effects, and the appropriate degree of the model were examined using the Akaike information criterion (AIC), Bayesian information criterion (BIC), and likelihood-ratio (LR) test.
All potential influencing response factors and their interaction with time terms were entered in the model. In addition, to avoid the confounding effect of complications and type of treatment, these variables and their interaction with time terms were included. Backward elimination regression method with F and t-statistics for deleting ineffective factors was applied. At this stage, the correct choice of eliminated parameters of the model and its validity were confirmed using the AIC, BIC, and LR test. The nonstructured covariance as the covariance structure model is used. Interpretation diagrams were applied to show the significance of the interactions.
In order to analyze the collected data, statistical software such as STATA 12 IC (StataCorp LP, USA) for modeling and the statistical package R (version 2.13.2, R Development Core Team) for diagrams with P < 0.05 as a significant level were used.
RESULTS
The mean follow-up period was 50 (SD = 24) months with 11 (SD = 7) refers. About 39% (38.7%) were males. The mean age at baseline was 51 (SD = 9) and 49 (SD = 8.5) (P < 0.001) years for male and female respectively.
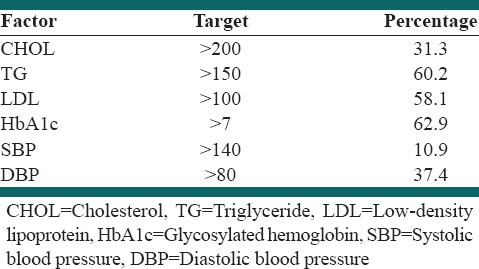
About 55.8% of the participants achieved the target of SBP < 140 mmHg and DBP < 80 mmHg, whereas 71.3% of them had hypertensive blood pressure levels [Table 1].
Table 1.
Target value for hyperlipidemia, hypertension, and hyperglycemia and proportion of patients reaching these target value

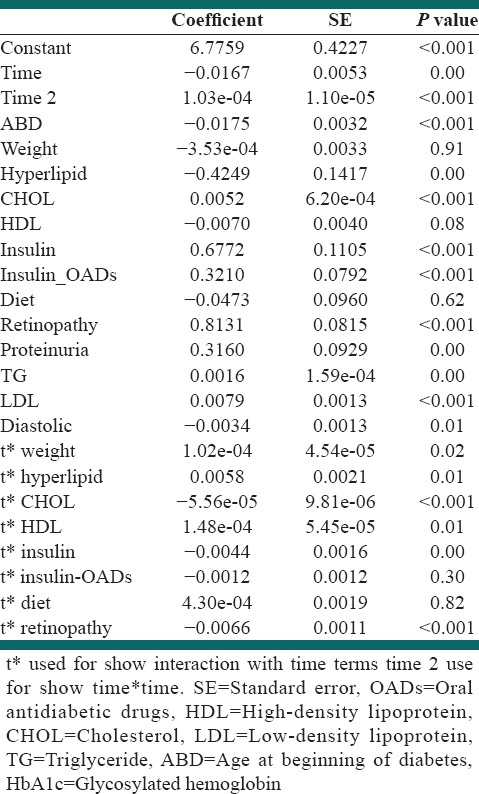
Estimated parameter including time, weight, ABD (age at the first visit minus duration of diabetes), blood lipids, DBP, treatments and complications (proteinuria and retinopathy) for all significant covariates and interactions in the final model are presented in Table 2. HbA1c values in present of other factors increased by increasing LDL (P < 0001), TG (P = 0.00), and proteinuria (P = 0.00), whereas decreased by increasing DBP (P = 0.01) and age of catching diabetes (less ABD) (P < 0.001).
Table 2.
Mixed model results and its coefficients and significant levels for different variables with HbA1c as response variable

Diastolic, LDL, TG, proteinuria, and ABD-by-time interaction term were not significant in this model. It can be indicated that there were no significant differences in the changes of HbA1c values for the different levels of these variables over the time.
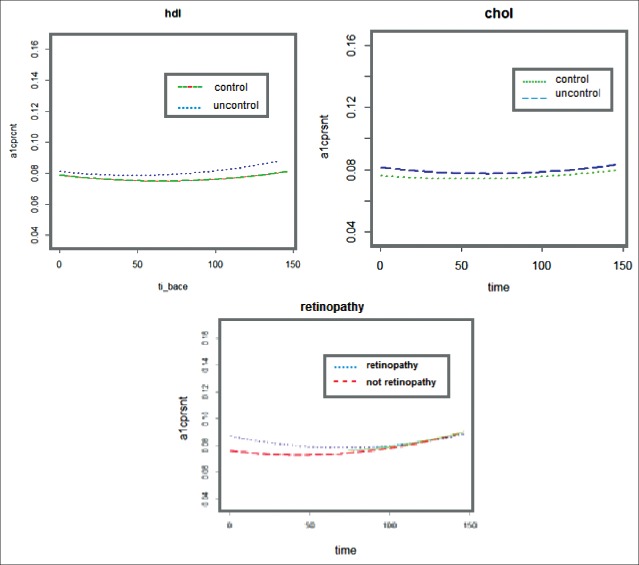
In addition, the model showed that more HbA1c level was detected in the case of more CHOL level, and also in the case that they had retinopathy at baseline. Moreover, higher HbA1c level is followed by lower weight, HDL, and hyperlipidemia at baseline. To have a better interpretation of the interaction terms, their graph has been represented. As it could be seen [Figure 1], the adjusted mean HbA1c values were significantly higher for patients with uncontrolled lipids (CHOL and HDL) in comparison with patients with controlled lipids at all-time points, but there was a different trajectory between controlled and uncontrolled groups that are confirmed the significancy interaction terms of these parameters by-time as it is demonstrated in Table 2 (P < 0.001, P = 0.01, respectively). The similar graphs can show the significancy interaction terms of hyperlipidemia and weight by-time that is presented in Table 2.
Figure 1.
Trend of HbA1c against CHOL, HDL, and retinopathy for controlled and uncontrolled groups
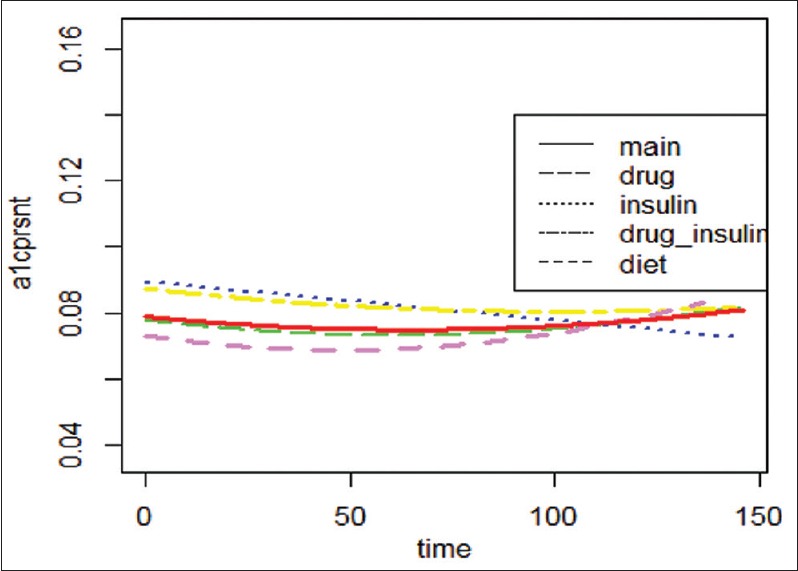
As it has shown in Table 2, there are more HbA1c levels for insulin treatments, OADs plus insulin, OADs, and diet therapeutic regiments at baseline, respectively. The treatment-by-time interaction terms were significant in this model. Therefore, it can indicate that there were significant differences in the changes over the time of HbA1c values for the different treatments. Figure 2 shows adjusted for time mean HbA1c values for different treatments. Although insulin has higher HbA1c values at baseline, it has less HbA1c values at the end of the study. As well, diet with lower HbA1c values at baseline has higher HbA1c values at end. Insulin has higher a velocity followed by OADs plus insulin, and the velocity of diet is a lower than other treatments.
Figure 2.

Adjusted for time Mean HbA1c Values for treatments of Type 2 Diabetes at all time points
DISCUSSION
The main purpose of the diabetic care and therapy is to achieve appropriate and acceptable blood sugar level to reduce the complications, morbidity, and mortality of diabetes. To measure HbA1c as a measurement of average blood sugar over the past 3 months is a more stable method to control diabetes. The main objective of this study was to investigate the risk factors affecting HbA1C control that are the most important factors in the development of diabetes complications.
The results of this study emphasize the importance of control of blood lipids (total CHOL, TG, and LDL), DBP, and weight to manage diabetes. The results also showed that age of diabetes, different groups of treatments, and the risk of comorbidities such as retinopathy, proteinuria, and hyperlipidemia influenced the HbA1c level and its trend.
Increased blood lipids are associated with increasing of HbA1c except for HDL that is inversely associated with the HbA1c. The results of this study are consistent with the results of most other studies in the field.[13]
In this study, the participants with more referrals had better diabetes control. It might be said that more referrals cause the importance of self-controlling the diabetes or the better treatments by doctor because of more monitoring of the patients.
Initial improvement in blood pressure can control diabetes and prevent its complications but should be maintained in moderation to achieve the desired results. Many cross-sectional and longitudinal studies have shown a positive association between blood pressure and HbA1c.[14,15] In this study, lower DBP is significantly associated with increasing HbA1c levels, maybe it is because of blood pressure medication or severe heart disease in some patients.[16,17,18,19]
It was found that increasing HbA1c level was associated with retinopathy and proteinuria. The findings of the study are consistent with the findings of prospective observational studies of 23 hospital based clinics carried out by Irene et al. in England, Scotland, and Northern Ireland. They found that HbA1C levels were significantly associated with diabetes complications, that is, to say that reduction of HbA1C levels leads to reduction diabetes complications.[20] As it could be seen [Figure 1], although retinopathy patients had higher HbA1c values at baseline, patients with lower velocity were more successful in controlling diabetes in comparison with other patients. Because eye is one of the main parts of the body, it seems that the fear of eye complications can lead to better diabetes control and more referrals of patients.
There are too many studies that present risk factors, which are associated with diabetes or diabetes improvement. Results of almost all of the studies are the same and indicate that reduced weight, lipid serum (CHOL, TG, and LDL), better control of blood pressure, fewer age and duration of diabetes, and increase HDL as the effective factors on diabetes control. The results of the study are in line with the results of prior studies. Because of the restriction of data collection just the baseline information of some variable are used in this study. Measuring the demographic variables such as weight, waist circumferences, hip circumferences, LDL, HDL, and detailed of the patient's history risk of complications during the time instead of just one especial time is recommended. Considering these factors, more research over time and repeated measurements can be more informative for more conclusion with respect to the findings of other cross-sectional studies. It enables us to find trend of the association factors on trend of HbA1c. There are some other factors such as smoking, abdominal obesity, race, microalbuminuria, education, and occupation that are surveyed in other studies that are not paid attention to. It is recommended to examine some other mental and social demographic variables such as smoking, climate, education and awareness of diabetes and diabetes diet and exercise in the longitudinal studies.[21,22,23,24,25,26,27,28,29]
Other studies, mostly been cross-sectional, have examined the relationships between diabetes and one or more factors. Considering the virtues, this study is based on longitudinal analysis and mixed models that consider missing data and enable the researcher to compare the groups, and examine the trend. Moreover, using the various variables together in one model and taking the relationships between them into account, the large sample size, and 10-year patient's follow-up are other strengths of this study. One of the limitations of this study was the irregular visit patients.
CONCLUSIONS
The present study shows that regular visits of diabetic patients as well as controlling blood pressure, lipid profile, and weight loss can improve the trend of HbA1c levels during the time. The results also shows that age of diabetes, different groups of treatments, and the risk of comorbidities such as retinopathy, proteinuria, and hyperlipidemia influenc the HbA1c level and its trend.
Footnotes
Source of Support: Nil
Conflict of Interest: None declared.
REFERENCES
- 1.Hosseini SM, Tazhibi M, Amini M, Zareei A, Hashemi HJ. Using classification tree for prediction of diabetic retinopathy on type II diabetes. J Isfahan Med Sch (IUMS) 2010;28:15–24. [Google Scholar]
- 2.Sadeghi MA, Kharazmi E, Javanbakht M, Alireza BM. Economics cost of diabetes in type II diabetic patients. PAYESH. 2012;11:443–9. [Google Scholar]
- 3.Khaledi S, Moridi G, Gharibi F. Survey of eight dimensions quality of life for patients with diabetes type II, referred to Sanandaj diabetes center in 2009. J Fasa Univ Med Sci. 2011;1:29–37. [Google Scholar]
- 4.Mahmoudi A. Effects of self care planning on reduction of A1C hemoglobin in adults with diabetes mellitus. Med Sci J Islam Azad Univ Tehran Med Branch. 2011;16:171–6. [Google Scholar]
- 5.Amini M, Khadivi R, Haghighi S. Study on economic costs of diabetes in NIDDM patients at Isfahan. Iran J Endocr Glands Metab. 2002;4:97–104. [Google Scholar]
- 6.Ghazanfari Z, Haghdoost AA, Alizadeh SM, Atapour J, Zolala F. A comparison of HbA1c and fasting blood sugar tests in general population. Int J Prev Med. 2010;1:187–94. [PMC free article] [PubMed] [Google Scholar]
- 7.Mohammadi AH, Esmaeili N. Quality of diabetescontrol with hemoglobin A1c and blood glucose. J Qazvin Univ Med Sci. 2001;4:1–2. [Google Scholar]
- 8.Twisk JW. Cambridge, UK: Cambridge University Press; 2003. Applied Longitudinal Data Analysis for Epidemiology: A Practical Guide. Illustrated, revised ed. [Google Scholar]
- 9.Association AD. Standards of Medical Care in Diabetes—2013. Diabetes Care. 2013;36(Suppl 1):S11–66. doi: 10.2337/dc13-S011. [DOI] [PMC free article] [PubMed] [Google Scholar]
- 10.Fitzmaurice G, Davidian M, Verbeke G, Molenberghs G. Boca Raton, USA: Florida, CRC Press; 2008. Longitudinal Data Analysis. [Google Scholar]
- 11.Enders CK. New York: The Guilford Press; 2010. Applied Missing Data Analysis. Illustrated ed. [Google Scholar]
- 12.Mansourian M, Kazemzade A, Kazemi I, Zayeri F, Sohelian M. Using mixed models with flexible random effects for determining the best diabetic macular edema treatment. J Isfahan Med Sch (IUMS) 2011;29:86–94. [Google Scholar]
- 13.Khan HA, Sobki SH, Khan SA. Association between glycaemic control and serum lipids profile in type 2 diabetic patients: HbA1c predicts dyslipidaemia. Clin Exp Med. 2007;7:24–9. doi: 10.1007/s10238-007-0121-3. [DOI] [PubMed] [Google Scholar]
- 14.Adler AI, Stratton IM, Neil HA, Yudkin JS, Matthews DR, Cull CA, et al. Association of systolic blood pressure with macrovascular and microvascular complications of type 2 diabetes (UKPDS 36): Prospective observational study. BMJ. 2000;321:412–9. doi: 10.1136/bmj.321.7258.412. [DOI] [PMC free article] [PubMed] [Google Scholar]
- 15.Bilgin R, Donma O, Sagliker Y. Glucose, glycated hemoglobin and fructosamine levels in essential hypertension. Biochem Mol Biol Int. 1993;31:1129–33. [PubMed] [Google Scholar]
- 16.Amini M, Mohammadi M, Hosseinpor M. Glycosylated hemoglobin in patients with essential hypertension. Iran J Diabetes Lipid Disord. 2002;1:115–118. [Google Scholar]
- 17.Inoue Y, Kaku K, Kaneko T, Matsumura S, Nakayama H, Yoshizaki Y, et al. Antihypertensive and metabolic effects of doxazosin in hypertensive patients with concomitant non-insulin-dependent diabetes mellitus. J Int Med Res. 1996;24:138–46. doi: 10.1177/030006059602400118. [DOI] [PubMed] [Google Scholar]
- 18.Shionoiri H, Gotoh E, Ito T, Hata T, Iwatsubo H, Takegawa K, et al. Long-term therapy with terazosin may improve glucose and lipid metabolism in hypertensives: A multicenter prospective study. Am J Med Sci. 1994;307(Suppl 1):S91–5. [PubMed] [Google Scholar]
- 19.Torlone E, Britta M, Rambotti AM, Perriello G, Santeusanio F, Brunetti P, et al. Improved insulin action and glycemic control after long-term angiotensin-converting enzyme inhibition in subjects with arterial hypertension and type II diabetes. Diabetes Care. 1993;16:1347–55. doi: 10.2337/diacare.16.10.1347. [DOI] [PubMed] [Google Scholar]
- 20.Stratton IM, Adler AI, Neil HA, Matthews DR, Manley SE, Cull CA, et al. Association of glycaemia with macrovascular and microvascular complications of type 2 diabetes (UKPDS 35): Prospective observational study. BMJ. 2000;321:405–12. doi: 10.1136/bmj.321.7258.405. [DOI] [PMC free article] [PubMed] [Google Scholar]
- 21.Bonakdaran S, Taghavi M. Cardiovascular risk factors in type 2 diabetic patients in Mashhad City. Iran J Endocrinol Metab (IJEM) 2010;12:1–6. [Google Scholar]
- 22. Esmaiilnasab N, Afkhamzade A, Ebrahimi A. Cross sectional study of risk factors in type 2 diabetes in the diabetes center in Sanandaj. J Epidemiol Spec. 2010;6:39–45. [Google Scholar]
- 23.GHanbariyan A, Hajipor R. Evaluation of risk factors for noncommunicable diseases in pre-diabetes: Tehran Lipid and Glucose Study. Iran J Endocrinol Metab. 2004;6:1–2. [Google Scholar]
- 24.Harati H, Hadaegh F, Saadat N, Azizi F. Population-based incidence of type 2 diabetes and its associated risk factors. J Iran Diabetes Lipid. 2013;8:357–46. doi: 10.1186/1471-2458-9-186. [DOI] [PMC free article] [PubMed] [Google Scholar]
- 25.Rezaianzadeh A, Namayandeh SM, Sadr SM. National Cholesterol Education Program Adult Treatment Panel III Versus International Diabetic Federation Definition of Metabolic Syndrome, Which One is Associated with Diabetes Mellitus and Coronary Artery Disease? Int J Prev Med. 2012;3:552–8. [PMC free article] [PubMed] [Google Scholar]
- 26.Schwedes U, Siebolds M, Mertes G SMBG Study Group. Meal-related structured self-monitoring of blood glucose: Effect on diabetes control in non-insulin-treated type 2 diabetic patients. Diabetes Care. 2002;25:1928–32. doi: 10.2337/diacare.25.11.1928. [DOI] [PubMed] [Google Scholar]
- 27.Stamler J, Vaccaro O, Neaton JD, Wentworth D. Diabetes, other risk factors, and 12-yr cardiovascular mortality for men screened in the Multiple Risk Factor Intervention Trial. Diabetes Care. 1993;16:434–44. doi: 10.2337/diacare.16.2.434. [DOI] [PubMed] [Google Scholar]
- 28.Turner RC, Cull CA, Frighi V, Holman RR. Glycemic control with diet, sulfonylurea, metformin, or insulin in patients with type 2 diabetes mellitus: Progressive requirement for multiple therapies (UKPDS 49).UK Prospective Diabetes Study (UKPDS) Group. JAMA. 1999;281:2005–12. doi: 10.1001/jama.281.21.2005. [DOI] [PubMed] [Google Scholar]
- 29.Zahedi F, Larijani B. Assessment of risk of coronary artery disease in patients with type 2 diabetes based on Framingham study: A cross-sectional study of risk factors. Iran J Diabetes Lipid Disord. 2001;1:73–82. [Google Scholar]


