Abstract
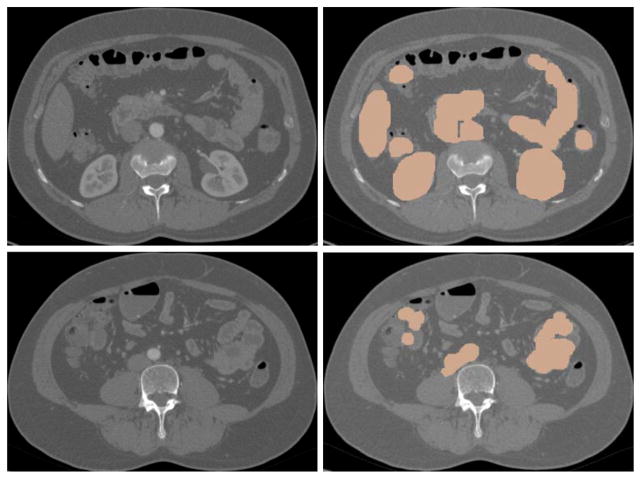
Due to its importance and possible applications in visualization, tumor detection and pre-operative planning, automatic small bowel segmentation is essential for computer-aided diagnosis of small bowel pathology. However, segmenting the small bowel directly on CT scans is very difficult because of the low image contrast on CT scans and high tortuosity of the small bowel and its close proximity to other abdominal organs. Motivated by the intensity characteristics of abdominal CT images, the anatomic relationship between the mesenteric vasculature and the small bowel, and potential usefulness of the mesenteric vasculature for establishing the path of the small bowel, we propose a novel mesenteric vasculature map-guided method for small bowel segmentation on high-resolution CT angiography scans. The major mesenteric arteries are first segmented using a vessel tracing method based on multi-linear subspace vessel model and Bayesian inference. Second, multi-view, multi-scale vesselness enhancement filters are used to segment small vessels, and vessels directly or indirectly connecting to the superior mesenteric artery are classified as mesenteric vessels. Third, a mesenteric vasculature map is built by linking vessel bifurcation points, and the small bowel is segmented by employing the mesenteric vessel map and fuzzy connectness. The method was evaluated on 11 abdominal CT scans of patients suspected of having carcinoid tumors with manually labeled reference standard. The result, 82.5% volume overlap accuracy compared with the reference standard, shows it is feasible to segment the small bowel on CT scans using the mesenteric vasculature as a roadmap.
Index Terms: Image segmentation, small bowel segmentation, vessel tracing, vesselness enhancement
I. Introduction
The small bowel is the part of the gastrointestinal (GI) tract between the stomach and the colon where much of the digestion and absorption of food takes place. It represents 75% of the length (>20 feet) and 90% of the surface area of the GI tract [1]. Early diagnosis of small bowel diseases is a diagnostic challenge for three main reasons [1, 2]. First, symptoms of small bowel diseases such as tumors are vague and nonspecific for most of the patients. Second, the deep location of the small bowel is beyond the reach of most flexible endoscopes. Third, the small bowel twists and turns along its length to form multiple complex loops, a configuration which makes it difficult to investigate. The absence of symptoms and the failure to perform a proper diagnostic test contribute to an average delay in diagnosis of 6 to 8 months [3].
Several imaging techniques are available for small bowel disease diagnosis, such as small bowel follow-through, enteroclysis, endoscopic tests and computed tomography (CT) [4]. Small bowel follow-through is time-consuming and achieves poor distention of the bowel. Enteroclysis is uncomfortable for patients and time-consuming. The reliability of capsule endoscopy (CE) remains unclear because of limitations in its field of view, frame rate and incomplete small-bowel transit [4]. Because of the convenience of performing and the efficiency for diagnosis compared to other techniques, CT has become one of the primary methods for the diagnosis of small bowel pathology [1, 4]. To evaluate the small bowel using CT, radiologists need to visually examine the CT scans slice-by-slice. The interpretative procedure is time consuming and error-prone because of the variability of disease presentation. Automatic segmentation of the small bowel in a 3D volume could help address such limitations. It is very useful for visualization, tumor detection, localizing exact relative position of tumors in the small bowel and pre-operative planning.
To our knowledge, there are no existing methods to segment the entire small bowel on 3D CT scans. It is very challenging to segment the small bowel directly on CT scans for four main reasons. First, the small bowel is in close apposition to other abdominal organs, such as muscle, vessel, kidney and liver, on CT scans. Second, the small bowel has an intensity distribution and texture that are similar to those of other abdominal organs on CT scans. Third, the small bowel has a very complex configuration, with twists and turns along its entire length. Fourth, the small bowel is mobile and configuration on two scans of the same patient may be significantly different. These four characteristics make it very challenging to distinguish the small bowel from other organs or to predict its location even with a very complex model. Image segmentation were proposed for many applications, a recent survey can be found [5]. Methods such as region growing [6], the deformable models, level sets [6], graph cuts [7] and watershed algorithms [8] are sensitive to noise, contrast and edge information, and cannot be applied to small bowel segmentation because of intensity similarity and close proximity to other organs. While model-based methods [9], including template-based methods and statistical model-based methods, require the similarity between the learned model and the test data, they cannot be used to segment the small bowel which moves and changes its shape continuously. There are also some other methods using supervised or statistical driven methodologies [5] for image segmentation. Their performance relies on the discrimination power of the extracted pixel-wise or region-based features. They cannot solve the problem but can be used to adjust or improve the segmentation results which will be discussed in detail in Section IV.
As discussed above, direct segmentation of the small bowel on CT scans is very challenging. In our previous work [10], we showed that one can approach the problem by performing an easier segmentation of the mesenteric vasculature as a roadmap to segment the small bowel. This paper is an extension of our previous works. We provide a more thorough theoretical discussion and experimental evaluation, and improve the result by introducing muscle segmentation, major artery tracing, vessel reconnection and colon removal. The motivation for using the mesenteric vasculature-guided method rests upon three important factors. First, following administration of intravenous contrast agents, blood vessels are much brighter than the small bowel on CT scans. Consequently, the segmentation of the vessels is easier than that of the small bowel. Second, there are strong anatomic relationships between the mesenteric vasculature and the small bowel as shown in Fig. 1, eg, the small bowel is located at the margins of the mesenteric vessels. So, we can localize one side of the small bowel (the side of the mesenteric sheet) if we can localize the extremal points of the mesenteric vessel tree. The third and most important is that the mesenteric vasculature provides benefits for the desired clinical application. It is clinically useful to separate the small bowel into its three parts (the duodenum, the jejunum and the ileum) and to estimate the path of the small bowel for tumor localization. As the small bowel has complex and variable configuration, it is difficult to “colormap” the path of the small bowel directly. However, the structure of the mesenteric vessel tree is relatively stable, and follows the same organization as do the named parts of the small bowel. Therefore, segmenting the mesenteric vasculature necessarily defines the order of the small bowel segments to which it is attached.
Fig. 1.
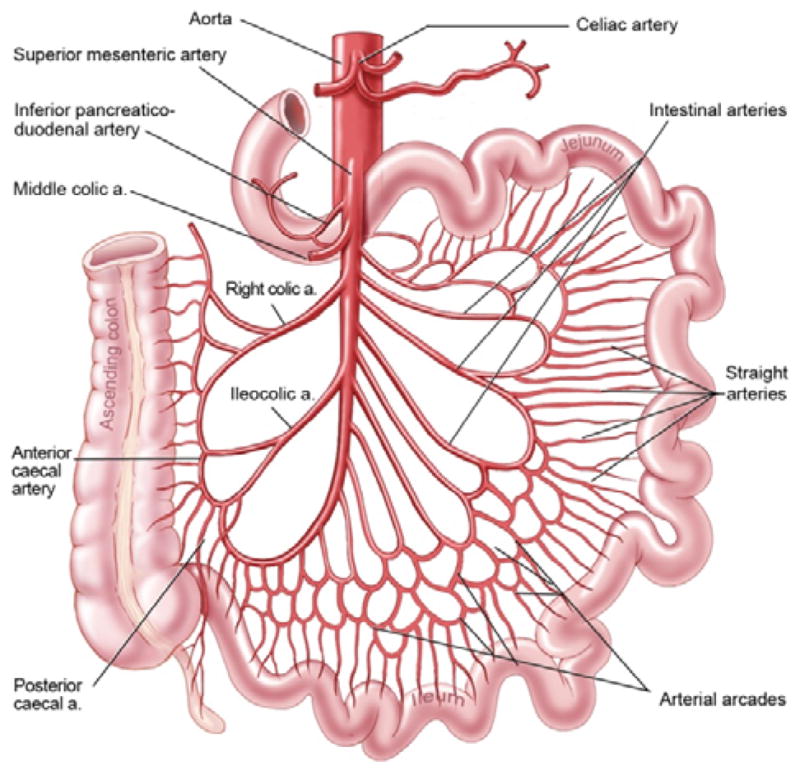
Anatomic configuration of mesenteric vasculature and intestines.
In this paper, we present a novel mesenteric vasculature-guided method for small bowel segmentation on high-resolution contrast-enhanced CT angiography (CTA) scans. It detects the larger superior mesenteric artery (SMA) branches, segments the smaller mesenteric artery branches, constructs a map from these branches and then segments the small bowel using the map. The contributions of our work focus on three aspects. First, a multi-linear vessel tracing method under the Bayesian inference framework was proposed to segment the larger arteries. Second, smaller mesenteric vessels were segmented by multi-scale, multi-view vesselness enhancement filters on maximum intensity projection (MIP) images followed with effective methods to remove non-vessel line-structures and non-mesenteric vessels. Third, a novel vessel map-guided framework was proposed to segment the small bowel. Experimental results support the use of the mesenteric vasculature as a roadmap to segment the small bowel on CTA scans.
The remainder of this paper is organized as follows. The materials are described in Section 2. The presented method is discussed in Section 3. Section 4 analyzes the experimental results using abdominal CT scans. Finally, Section 5 summarizes this paper.
II. Materials
The data set consisted of high-resolution abdominal CT angiograms of patients suspected of having small bowel carcinoid tumors at a single research hospital. Data acquisition and analysis were conducted under an Institutional Review Board (IRB) approved protocol. CT scans were acquired following oral administration of 3 bottles Volumen and intravenous administration of 130 ml Isovue-300 with 5 ml/sec injection rate and 30 second delay (the injection rate and delay may change a little according to patient’s weight). The scanning parameters were section collimation 1.0-mm, reconstruction interval 0.5 mm, 512×512 matrix and in-plane pixel dimensions of 0.86 mm to 0.94 mm depending on the participant’s body size. The original CT scan data includes chest, abdominal and pelvis regions, and the abdominal region with all the small bowels was manually truncated for analysis.
The mesenteric vasculature of one case and the small bowel of 11 cases were manually labeled in the 3D volume using Vascular Editor software [11] as the reference for evaluation. With Vascular Editor, the images were reviewed slice-by-slice with the aid of multiplanar reconstructions, and the paths of the small bowel or vessels were carefully traced in the 3D volume. Each segment of vessel or small bowel is determined by its centerline and corresponding diameter and labeled as a set of tubular segments which approximate the small bowel path and diameter. With this tubular reference standard, it is possible to miss bits of small bowel having varying diameter within a tubular segment. One example is shown in Fig. 2. One medical student and two board-certified diagnostic radiologists independently labeled five, one and five small bowel paths, respectively. We are aware of the fact that our dataset is unique and the number of patients is limited. It is because that our work is the first attempt to segment the entire small bowel on CT scans, and that it is very time consuming to label the data. It took the medical student two weeks to label the mesenteric vasculature of one case, and several days to accurately label the small bowel path of one case. To improve the accuracy of the reference data, a post-doctoral fellow reviewed all the reference data slice-by-slice along the labeled tubes and fixed most errors.
Fig. 2.
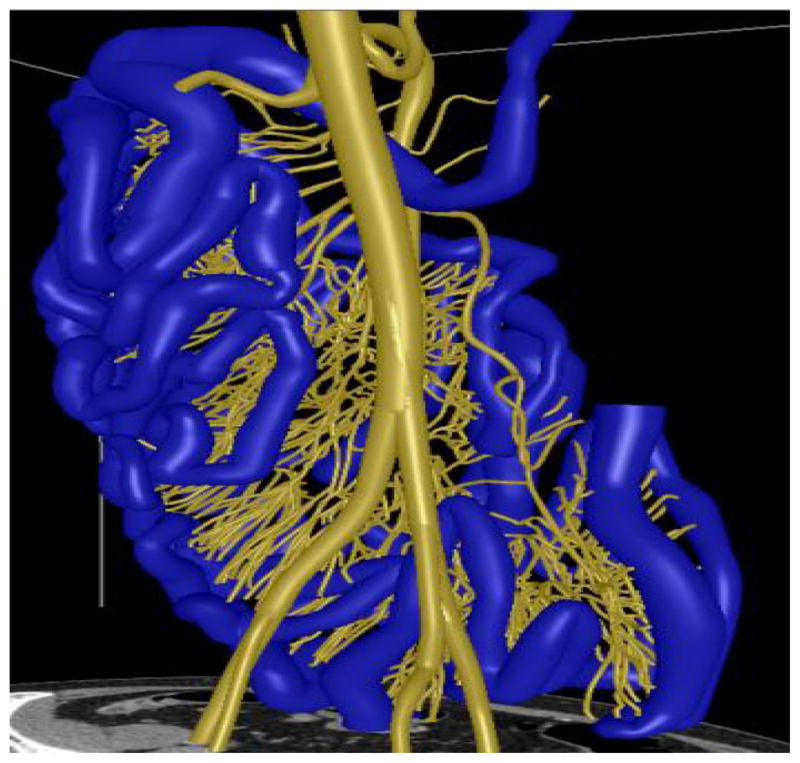
3D models and the manually labeled paths of the mesenteric vasculature (yellow) and the small bowel (blue).
III. Methods
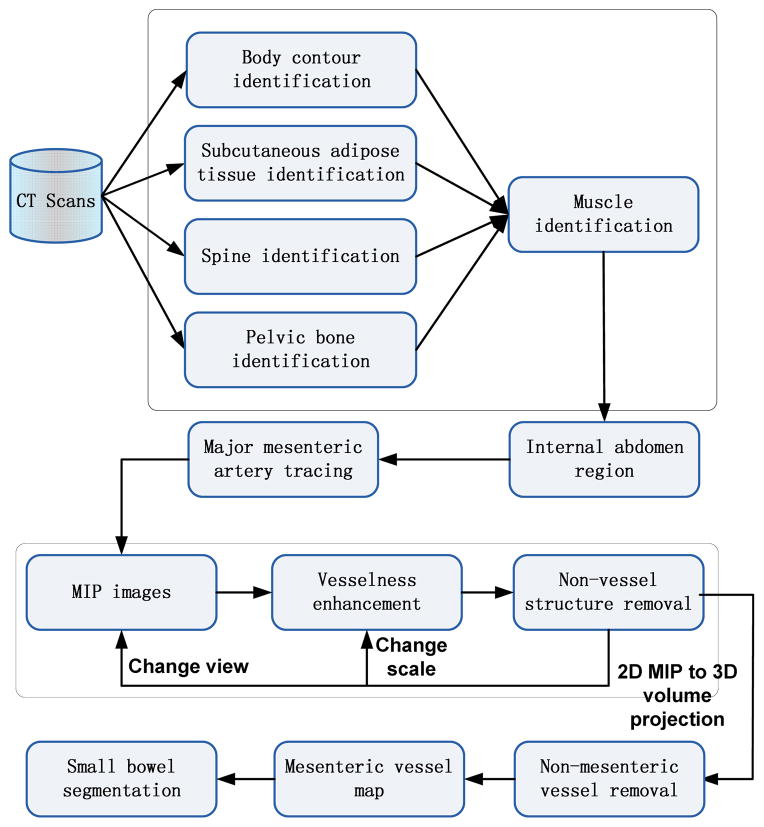
The flowchart in Fig. 3 provides an overview of the method. It mainly consists of five necessary steps. First, the internal abdomen region is automatically identified to localize the searching region. Second, the major mesenteric arteries are segmented using a vessel tracing method. Third, vesselness enhancement filters are used on MIP images to segment all abdominal vessels. Fourth, mesenteric vessels are distinguished from other vessels by calculating a local distance map, and vessel bifurcation points are linked to generate the mesenteric vessel map. Finally, the small bowel region is segmented employing the mesenteric vessel map.
Fig. 3.
System architecture
A. Internal Abdomen Region Identification
Identification of the internal abdomen region, which includes identifying the body contour, subcutaneous adipose tissues (SAT), bones and muscle, is a necessary step to reduce computational cost and false positives for small bowel segmentation. It is also required for surgical planning and abdominal organ recognition and evaluation [12, 13]. Since both the mesenteric vasculature and the small bowel are located within the internal abdomen region, identifying and removing anatomic structures outside this region will reduce greatly the computational cost and false positive rates. The structures to be removed include SAT, muscles and bones. False positives on such structures are much harder to remove later in the image processing pipeline. The principle behind vessel segmentation is to detect line-like or tube-like structures in the 3D CT volume while there are many non-vessel line-like structures within regions of SAT fat and muscles. Second, it is hard to distinguish small bowel from closely apposed muscle. The small bowel has similar intensity range compared to muscles on CT scans, and the small bowel and muscle touch each other in some places. Thus, it is very likely to misidentify part of muscles as small bowel and vice versa. Third, it is necessary to remove bones, such as spine, ribs and pelvis, to avoid obscuring vessels and small bowel on the MIP images.
Similar to our previous work [10], the procedure is executed slice-by-slice with context constraints to identify the body contour [14], SAT fat [14], spine [15], ribs and pelvis one-by-one using our previous methods. In this work, we further improved the results of vessel and small bowel segmentation by identifying and removing the abdominopelvic muscles. Muscle is segmented and removed by combining an atlas model with an active contour model [16]. For each patient, pre-defined muscle atlas models were first initialized at different body locations. Then, an active contour model was used to refine the internal muscle wall boundary slice-by-slice. The muscle wall was further smoothed using contextual information, i.e., the muscle thickness of the current slice is a weighted average of adjacent and current slices.
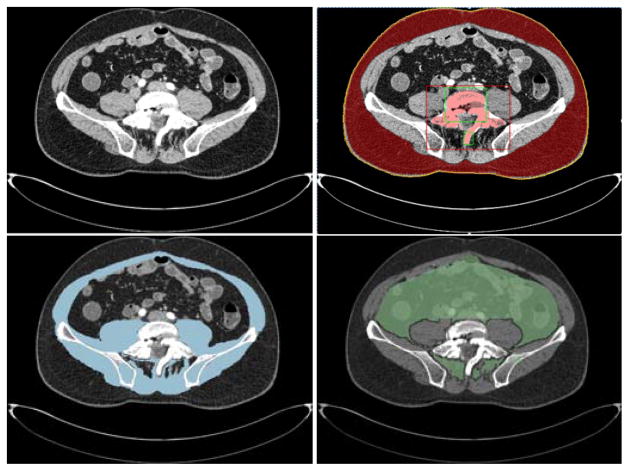
Fig. 4 shows the procedure and results of internal abdomen segmentation after excluding regions of undesired structures on an example data. On a PC with Intel Xeon 2.66GHz CPU and 12 GB RAM, bone, fat and muscle segmentation for a 500 slice data need 30 seconds, 30 minutes and 30 minutes, respectively.
Fig. 4.
An example of internal abdomen identification. From left to right and top to bottom: a) original CT slice, b) identification of body contour (yellow), SAT segmentation result (red) and spine segmentation result (pink), c) muscle segmentation result (blue), d) internal abdomen region (green).
B. Major Mesenteric Artery Tracing
As the method uses the mesenteric vasculature as a roadmap to segment the small bowel, we need to build the vessel tree by only segmenting mesenteric vessels. However, within the internal abdomen region, there are some vessels which do not belong to the mesenteric vasculature, that is, they do not supply the small bowel. It is very difficult to distinguish the mesenteric vessels from other vessels. We make use of the knowledge that the mesenteric vasculature arises entirely from the superior mesenteric artery, a major branch of the abdominal aorta. With this prior anatomical knowledge, we first identify the SMA, and then detect the remaining mesenteric branches connecting to the SMA. The presence or absence of a connection to the SMA can be used as the criterion to distinguish mesenteric vessels from other vessels. In this subsection, we discuss our method to segment the large arteries. Because of its importance and numerous applications in computer-aided diagnosis (CAD) systems, many methods have been proposed for vessel segmentation, especially for large vessels [17, 18]. Among them, tracking-based methods have been used widely and achieved satisfying results [19] for large vessel segmentation. Tracking-based methods have advantages in handling leakages, occlusions, discontinuities, and variations in vessel size and shape [19, 20].
In this subsection, the abdominal aorta and the superior mesenteric artery and their distal branches are segmented using a vessel tracing method based on a multi-linear subspace vessel appearance model and Bayesian inference. Here, there are two reasonable assumptions. First, there is a well-defined centerline along the vessel tube. Second, the vessel diameter changes slowly over a short range. That is, although the appearance manifold of the entire vessel may be nonlinear and complex, we assume that the manifold of a short piece of vessel is linear. A problem encountered when tracing long vessels is that they exhibit large variations in direction, intensity, shape and size. Consequently, traditional tracking-based vessel segmentation methods using linear models will fail. The multi-linear subspace vessel appearance model in our work can handle these variations. During tracing, vessel segment locations are predicted and vessel appearance models are updated adaptively. The matching between two successive steps is formulated as a probability optimization problem under the Bayesian inference framework, where a particle filter is applied to reduce computation [21]. Similar to other tracking-based approaches, our method applies local operators on a focus known to be a vessel segment and tracks it along the vessel tube. The method starts from an initial point, and identifies vessel segments iteratively in the 3D volume by estimating vessel model parameters. It consists of the following steps: initializing the start point automatically, learning the multi-linear subspace model of vessel segments, predicting states and updating models using Bayesian inference, post-processing for smoothness and refinement.
To initialize the start point, the beginning (top) of the abdominal aorta is detected around the center of the first slice followed by thresholding. Then a short vessel segment following the initial point is detected using 3D region growing within a pre-defined length. In the middle cross section of the vessel segment, dozens of seeds are placed on radial lines crossing the center as shown in Fig. 5. In theory, the more seeds that are placed, the better the performance of vessel tracing. In our implementation, the number of seeds is proportional to the vessel diameter and set empirically. Section IV has more discussion about the selection of the number of seeds. For each seed, we construct a generalized cylinder (GC) model which can be denoted by M = (x, y, z, r, l, θx, θy, α}, where x, y, z denote the spatial position of the seed, r, l denote the radius and length of the model, θx, θy denote the rotation angle in x and y direction respectively, α denotes the size scale. Each cylinder model has its own position, size and direction. The final binary mask of vessel derives from the combination of all these cylinder models. Every seed (cylinder model) is tracked individually so that all branches can be visited, and information from all seeds will be integrated to generate the final tracking result.
Fig. 5.
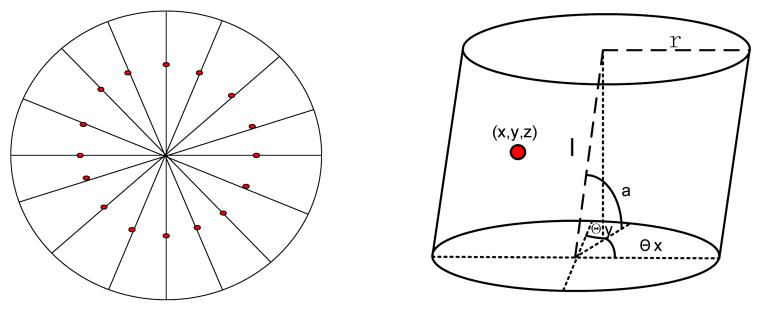
Initialization of vessel appearance model. The left one shows placing seeds (red points) on the middle cross section of a vessel segment, the right one shows generalized cylinder model for one seed.
1) Multi-linear Subspace Modeling
In this subsection, we present an appearance modeling approach, which employs nonlinear models and can preserve most of the appearance variations. To represent variations of vessel appearance, we learn a multi-linear subspace model, which is different from traditional models which solve problems in single linear space.
Given a particular vessel segment which is visited by a seed (cylinder model) in n steps, we first calculate its weighted intensity values. Let xi ∈ ℝd denote a feature vector, usually named observation, consisting of weighted intensity values at step i, where d is the number of voxels inside the vessel segment, i.e., the dimension of the feature vector. Let X = {x1, x2, … xn} ∈ ℝd×n denote an observation set of the vessel segment visited by this seed in n steps, that is, the vessel propagates n steps from the beginning to the end, and one observation is recorded for each step. Supposing that the entire appearance manifold constructed by X can be represented by K linear subspaces, we cluster X into K subsets X = {X1, X2, …, XK}, where Xi ∈ ℝd×ni, ni is the number of observations in the ith subset and it satisfies . The value of K reflects the extent of variation in the vessel segment which is visited in n steps. It is set empirically with the value which is the tradeoff between computation cost and performance, and will be discussed in detail in Section IV.
For each subset Xi, a linear subspace model is learned. To eliminate the influence caused by the mean of training data, Xi is centered to , where mi ∈ ℝd×1 is the mean of the observation set Xi. To represent the vessel segment accurately, the subspace preserving most variations in should be achieved. The cost function is defined as follows [21]
| (1) |
where Si is the scatter matrix of , which is defined as , pi is the number of principal components we want to preserve in the subspace. The larger pi is, the more variations of observations can be preserved by this subspace. It can be defined by the following criterion:
| (2) |
where ε is a pre-defined threshold.
The solution of Eq. 1 is the orthogonal eigenvectors of Si corresponding to the first pi largest eigenvalues of Si. We can use the singular value decomposition (SVD) method to get the projection matrices , which correspond to the first pi largest singular values { } of Si. The singular value matrix is denoted by . With the solution of Eq.1, the learned subspace of Si can be represented by its mean mi and the projection matrix Ui. Given a test sample (the feature vector of a new vessel segment) x and the centered result xc = x − mi, the projection of xc onto the subspace can be computed as
| (3) |
The reconstruction of x using this subspace can be defined by
| (4) |
For K subsets, we compute K linear subspaces. Then the appearance model learned from X can be denoted by Å = {A1, …, AK}, where Ai = {mi, Ui}|i = 1, … K.
2) Appearance Model Updating
Since a vessel and its surroundings keep changing in orientation, intensity and scale, an appearance model learned from the first portion of the vessel cannot handle variations in the entire vessel. So, we need to update the learned appearance model adaptively when new vessel segments are localized.
Given the current appearance model Å = {A1, …, AK} and the feature vector of the new localized vessel segment x, appearance model will be updated according to x. If x belongs to certain subspace Ai ∈ Å, x will be added into Ai. If not, a new subspace will be generated to replace the subspace Aj ∈ Å which has the largest reconstruction error. Let denote the updated appearance model, where is the normalized mean of the ith subspace in model A. A test sample can be represented by x = Aa, where a = [1, a1, …, api]is the reconstruction coefficient vector, then
| (5) |
The reconstruction error is calculated as
| (6) |
For any i, if RE is smaller than some pre-defined threshold ε, x will be added into Ai and Ai is adjusted by updating its mean and projection matrices with x; if there is no i satisfying REi < ε, we will construct a new subspace and use it to replace subspace Aj. The mean of the new subspace is , the projection matrix is initialized as . The appearance model is updated at each step.
3) Tracking by Bayesian Inference
For tracking-based methods, the state (parameters of cylinder models) needs to be estimated. The state estimation of vessel tracking is formulated under the Bayesian inference framework, where a hidden Markov model is used to optimize the tracking result. Given the observation set Xn = {x1, …, xn}, the cylinder model Mn at step n can be determined by the Maximum A Posteriori (MAP) estimation:
| (7) |
where p(Mn|Xn) can be inferred by the Bayesian theorem in a recursive manner:
| (8) |
where p(Mn|Xn−1) = ∫ p(Mn|Mn−1)p(Mn−1|Xn−1)dMn−1. It is time consuming to compute the MAP estimation directly. To reduce computation cost, a particle filter is adopted to estimate the state sequence. Using the particle filter, the posterior p(Mn|Xn) is approximated by a finite set of samples { } with corresponding importance weights { }. The candidate sample is drawn from an importance distribution and the weight of the ith sample is
| (9) |
Because of the Markov property, we have . Given the cylinder model parameter set Mn = (x, y, z, r, l, θx, θy, α}, each parameter in Mn is modeled independently with a Gaussian distribution around its counterpart in Mn−1, then we have p(Mn|Mn−1) = N(Mn;Mn−1, Σ), where Σ is a diagonal covariance matrix whose elements are the corresponding variances of cylinder model parameters. p(xn|Mn) is the probability of the model generating xn. It can be defined as
| (10) |
Then, we can calculate the MAP estimation and the estimated result will adjust and generate the new vessel segment model.
Beside appearance model and Bayesian inference, tracking speed, errors in tracking, bifurcation and termination condition for vessel tracing are further discussed. First, the moving distance (tracking speed) of each tracking step along the tangential direction of the vessel tube is fixed for all vessel cylinder models. Second, all tracked and updated cylinder models in each tracking step constitute a new vessel tracking result. During tracking, each seed with corresponding cylinder model is tracked independently. After each tracking step, the updated cylinder models have different size, location and orientation and generate a big region. Thresholding within vessel intensity range is used in this region to separate vessel voxels from background. With the thresholded result, cylinder models covering few vessel voxels are reset using the center of the thresholded region, and parameters of other well fitted cylinder models are updated with the best orientation within a pre-defined range. Third, bifurcation is solved by simultaneous tracing procedure of multiple seeds which is demonstrated in Fig. 6. As our vessel tracing is applied to large well-enhanced arteries (Fig. 6), tracking failure is infrequent, and will be fixed after model updating in error adjustment. As shown in Fig. 5, cylinder models are initialized with seeds which are not placed in the center and at different orientations. As these cylinder models are tracked independently, they will follow different trajectories during tracking, and go to different branches when facing a bifurcation. As each seed is traced independently, the seeds will go to different branches based on matching when there is a bifurcation. In theory, all branches will be visited by enough seeds if a large amount of seeds are used. The simultaneous multi-seed tracing method can handle bifurcation by itself. Fourth, the tracing procedure will be terminated by evaluating the fitness between tracked models and image data p(M|X), i.e, how well the image data support the hypothesis of the existence of a vessel. It terminates when the possibility of the best “matched” region among all candidates to model is below a certain pre-defined threshold, p(M|X) < τ.
Fig. 6.
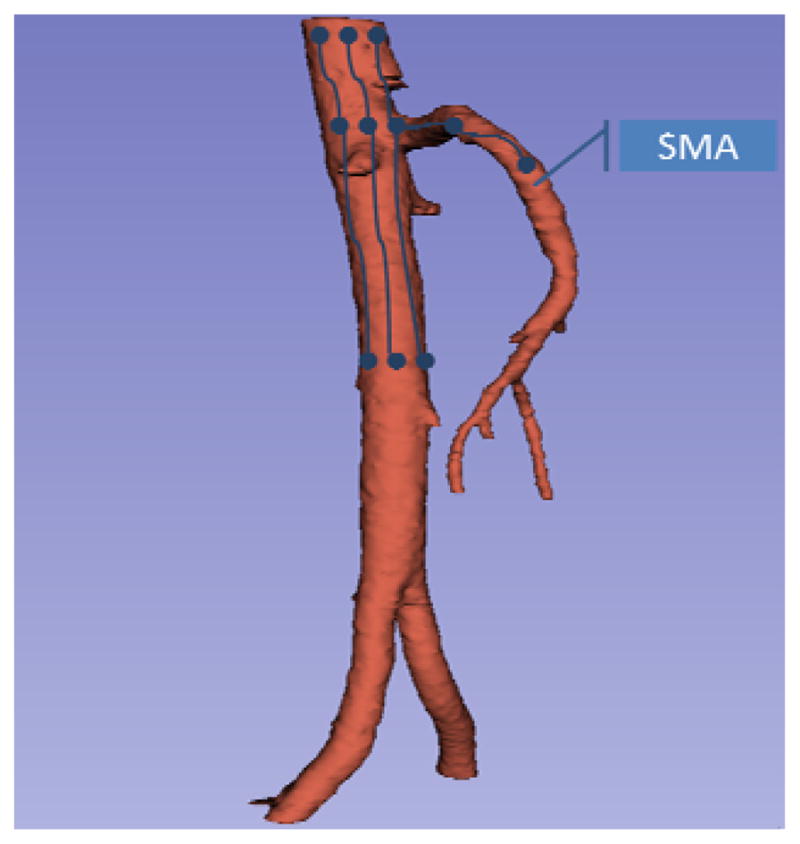
Demonstration of the procedure of major artery tracing. The blue points are seeds, blue lines present the evolution of seeds, and the red mask is the vessel tube for example data.
C. Small Mesenteric Vessel Segmentation
To find the extremas of the mesenteric vessel tree, small mesenteric vessels need to be segmented. Segmenting small vessels is very challenging because of the low image contrast, high tortuosity, complex surroundings and small size of these vessels. As vessels become smaller, the effect of the contrast agent will be weakened and the image contrast of vessels will be low. Small vessels do not have a clear tube-like structure in the 3D volume, and have complex configuration, such as bifurcations, loops and intersections. In addition, the surrounding structures in the abdominal region are complex, as vessels may be close to liver, kidney, small bowel, colon and un-removed muscle. Because of these complexities, the traditional vessel segmentation methods, which are proposed mainly for large vessels, will fail.
Vesselness enhancement filters tend to work better for delineation of small vessels than other vessel segmentation methods [22, 23]. They can enhance objects with specific structures while suppressing other objects, and even better multi-scale filters can work well over a large size range of vessels. However, vesselness enhancement filters tend to fail to detect some of mesenteric vessels with small size and low contrast, which may present discontinuities in 3D volume. While MIP was proposed to capture the geometric structure in a single image, MIP extracts high-intensity structures from volumetric data and makes the structures prominent. So, it will be easier to detect the small vessels on MIP image than from the original 3D data using vesselness enhancement filters. On MIP, the projection value is given by the maximal voxel intensity along the projection line. Since we have already excluded SAT, muscle and bones, we can avoid some possible effects of occlusion on MIP images. In this subsection, an automatic method based on multi-view, multi-scale vesselness enhancement filter on MIP images is introduced to extract small mesenteric vessels on high-resolution abdominal CTA scans.
We first partition the CT volume into overlapping slabs, which move voxel-by y-voxel in the 3D volume. Slab thickness is empirically set to 16 mm. The thickness of the slabs greatly impacts the performance of vessel segmentation. When the thickness is small, small vessels are not sufficiently prominent on the MIP and are hard to segment using enhancement filters. When the thickness is large, occlusions by other organs and overlap of vessels occur. So, a proper thickness which can cover the size range of mesenteric vessels while reducing occlusions should be used. In Section IV, we will show the effect of the slab thickness on the performance of MIP-based small vessels segmentation using experimental evaluation. Then, one MIP image is generated from one slab by extracting the maximal voxel intensity along the projection line within the slab. Meanwhile, the spatial coordinates of voxels with maximal intensity value are stored and used for backprojecting the vessel mask from 2D to 3D volume, that is, the depth information of voxel on the MIP is stored. To segment vessels within a large size range, multi-scale filters must be used one-by-one. To reduce possible occlusions, detected major arteries and large-scale vessels during the last step are excluded before generating new MIP image set, and small-scale filters are used to segment vessels on the new MIP images. To compensate for the loss of spatial information and possible occlusions of MIP images, it is necessary to view the data from multiple view points. That’s why multi-view method is used in our work. By rotating and resampling the 3D coronal volume, MIP images are generated iteratively for each view point and used for vessel segmentation on multiple scales.
Among vesselness enhancement filters, Frangi’s line-structure filter [22], a multi-scale vesselness enhancement filter, has been used widely and achieved gratifying results. The Frangi’s filter requires calculation of a second-order local Hessian matrix and its eigenvalues. The Hessian matrix for each pixel is computed by convolution with the second order derivatives of a Gaussian with scale σ
| (11) |
where I(x, y) is the image intensity at pixel (x, y). Its corresponding eigenvalues are λ1 and λ2 (|λ1| ≤ |λ2|). Line-like structures satisfy the following criterions: λ1 = −1/σ2 < 0, λ2 = 0. The Frangi’s vessel likeliness measure for 2D images is defined as
| (12) |
where , and β, c are thresholds which control the sensitivity of the line filter to the measure RB and S respectively. Frangi’s filters are used iteratively from coarse to fine scales on every view MIP image set. In each step, vessels detected at the coarser scale are excluded and MIP images are re-generated.
1) Non-vessel Line Structure Removal
While enhancement filters are designed to detect objects with specific structures other than specific organs or tissues, Frangi’s filters work well for all kinds of line structures. Many non-vessel line structures will be detected. They are not vessels but have line-structures, most of them are located at the boundaries of abdominal organs and tissues. These non-vessel line structures must be removed before we build the mesenteric vessel map. From Fig. 7, we can see that there are significant difference between vessel regions and non-vessel regions. The vessel will be projected on the MIP into a narrow band or line with highest intensity in the center. The intensity profile of vessel regions on the MIP image approximate Gaussian distribution peaking at the center (Fig. 7), i.e., there is a bright line in the center which divides the region into two symmetric parts. Non-vessel regions have clear boundaries which divide the region into two parts with different histograms, i.e., one part is bright and the other is dark. Given detected line (vessel centerline or boundary centerline) in the candidate region, we will model the intensity profile perpendicular to the line. That is, the 2D candidate region is projected and normalized into 1D intensity values. The Gaussian characteristics of vessel regions is measured and used to distinguish vessel structures from non-vessel structures.
Fig. 7.
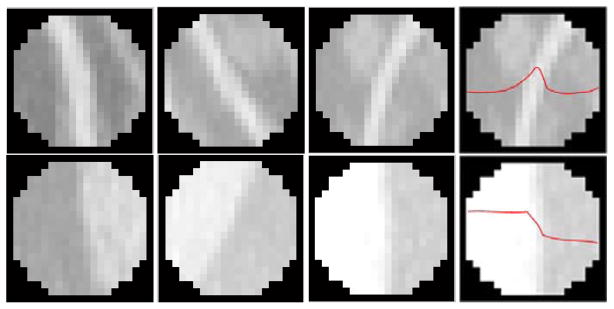
Examples of line-like structure regions. The first row images are vessel regions, and the second row images are non-vessel regions. The last column images are intensity profile of regions.
The intensity distributions of the test region and vessel reference regions are defined as p(x)~N(μ, Σ) and q(x))~N(μ0, Σ0), respectively, where N(·) means Gaussian distribution, μ is the mean and Σ is the variance. The distance between the test and reference is measured by the Kullback-Leibler distance [24]:
| (13) |
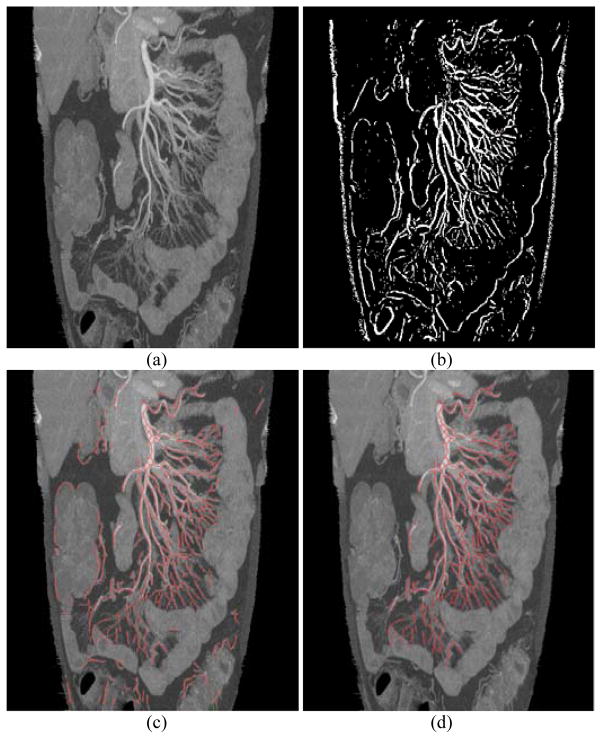
where EP[·] is the expectation under the density p(·), k is a constant. Given current vessel size scale σ, parameters of reference model are learned from positive vessel regions. Gaussian parameters of μ and Σ are estimated for every test region at the same scale σ as reference. Test candidates with large distance from the references at all size scales will be considered as non-vessels. Non-vessel line structure removal results are shown in Fig. 8c (non-vessel removal, center-line detection and morphological operations are executed). Similar to vesselness enhancement, non-vessel removal is executed on multi-scale and multi-view MIP images.
Fig. 8.
Mesenteric vessel segmentation. a) MIP image excluding external abdomen structures and bones, b) vessel enhancement using Frangi’s filters, c) vessel centerlines (red) after non-vessel removal, d) final vessel centerlines (red) after non-mesenteric vessel removal.
After non-vessel line structure removal, vessel mask detected on 2D MIP images are backprojected into 3D volume. A depth index for each pixel on MIP image is stored when we build the MIP images. If one pixel on MIP image is detected as vessel pixel, we place a vessel voxel at the same location on the slice corresponding to the depth index. To avoid discontinuity in 3D volume, we also classify voxels within a neighborhood region of each vessel voxel into vessel voxels or non-vessel voxels according to the intensity similarity between each voxel and the vessel voxel, where the size of the neighborhood region is determined by the scale used to detect vessels. The vessel mask segmented on each scale is backprojected into 3D volume independently and are merged directly in the 3D volume. The independent projection eliminates the effect of occlusions and influences of close vessel voxels. The vessel masks segmented on different views will be merged using weighted summation, where weights are set manually. After mask merging, 3D smooth operations (dilation and erosion) are used to fill small gaps and remove outliers. A smooth 3D vessel mask will be generated.
2) Non-mesenteric Vessel Removal
As we use mesenteric vasculature as reference to segment the small bowel, any non-mesenteric vessels and non-vessel structures outside the range of mesenteric vasculature should be removed because they will bring many false positives to the results of small bowel segmentation. However, vesselness enhancement filters cannot distinguish mesenteric vessels from non-mesenteric vessels, and they are applied to the entire internal abdomen region. As shown in Fig. 8c, many vessels supplying organs other than the small bowel are segmented. To remove non-mesenteric vessels, anatomical knowledge that all mesenteric vessels connect to SMA directly or indirectly is used. The result of major mesenteric artery tracing is first integrated, and then non-mesenteric vessels are removed by evaluating the connectivity between SMA and vessels detected by Frangi’s filters. If the vessel connects to SMA, it is a mesenteric vessel. If not, it will be classified as a non-mesenteric vessel and will be removed. In this subsection, we conduct non-mesenteric vessel removal in the 3D vessel mask using modified local distance map [25].
With the vessel mask, a local distance map is calculated from the top of SMA. A distance map is an image (or volume) where the value of each pixel (voxel) is the distance from this pixel (voxel) to the nearest pixel (voxel) belonging to a given set or object (mesenteric vessel). Our local distance map has three kinds of values, 0 denotes non-vessel voxels, 1 denotes mesenteric vessel voxels, values bigger than 1 are intermediate values denote the distance between this voxel to the nearest voxel belonging to mesenteric vessels. Distance map calculation and voxel classification are executed simultaneously. First, one point at the top of the superior mesenteric artery is initialized, and the value of this voxel is set to 1. A distance threshold is pre-defined, and it is also used as the size of local sliding window. Second, within the local window centering at the initialized point, the distance values between voxels belonging to vessels (any detected vessels) and the initialized point are calculated. Third, distance values are thresholded to indicate mesenteric vessel voxels or non-mesenteric vessel voxels using the pre-defined threshold. The local window slides and propagates along vessel branches in 3D space until all detected vessel voxels are classified. One result is shown in Fig. 8d, where the vessels supplying colon, liver and muscle are removed.
D. Small Bowel Segmentation
As discussed, there are strong anatomical relationship between the mesenteric vasculature and the small bowel. Mesenteric vessels supply the small bowel along the mesenteric sheet, which can be seen as the surface spanned by extremas of the mesenteric vasculature. The side of the small bowel that touches the mesenteric vessels is called the “mesenteric” side, and the opposite side is called the “anti- mesenteric” side. So, the mesenteric side can be localized once we find all of the extremas of the mesenteric vasculature. The idea is to segment the small bowel using region growing methods with a large number of initial seeds (the extremas of the mesenteric vasculature). Since there are a large number of seeds well-localized by the vessel tree, the small bowel segmentation is well-initialized.
The performance of small bowel segmentation relies greatly on the accuracy and number of seeds. As shown in Section IV, missing some small vessels does not adversely impact the small bowel segmentation, while false seeds can adversely impact the segmentation. From the experimental results, we can see that if we can control the false positive rate of the vessel segmentation, acceptable small bowel segmentation will be derived.
1) Building the Mesenteric Vessel Map
As shown in Fig. 8d, there may be discontinuities in the segmented vessels. It is difficult and unreliable to localize extremas of the mesenteric vasculature from these unconnected segments directly. Instead of the method using chains of bifurcation points in our previous work [10], we try to generate a complete vessel tree and find the leaves of the tree to localize the expected extremas.
Extraction an accurate vessel tree is limited by the complex structure of vessels and the performance of vessel segmentation. Fortunately, as shown in Fig. 9, we can localize accurately the extremas of the mesenteric vasculature even when errors occur when we reconnect vessel segments to build the vessel tree. So, it is not necessary to build the accurate vessel tree at the smallest vessel level to localize the locations of the vessel extremas points. We can build a “sketchy” vessel tree, which has accurate branch direction and end points (including root, leaf and bifurcation points) of vessel segments, and is tolerant a few errors in the middle portion of the vessel tree. We know that all extremas locate at the end point of the leaf branches/segments of the vessel tree. So, it turns to localizing all leaf branches and their end points. The vessel tree can be encoded as a graph G = {V, E}, where V is the set of vertices which correspond to end points of vessel segments, E is set of edges which correspond to the vessel segment between end points.
Fig. 9.

Illustration of different reconnection procedures.
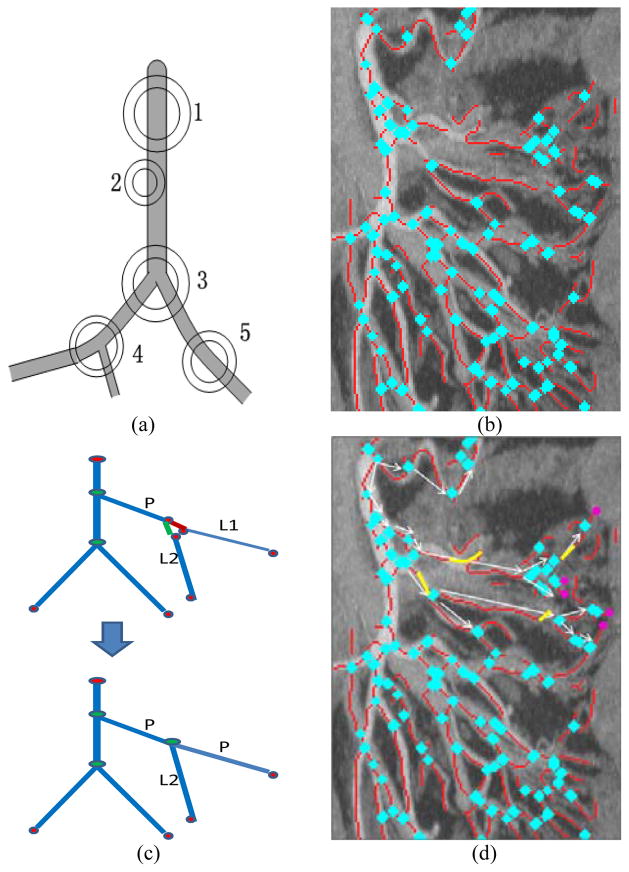
We modified a simple and efficient connected component method [26] to detect vessel bifurcations and end points on MIP images. A hollow circle centered at certain pixel with inner radius rin and outer radius rout is placed. Then the number of connected components inside the hollow circle is counted. As shown in Fig. 10a, a hollow circle centered at a bifurcation point (such as points 3 and 4 in Fig. 10a) should have three or more components, while that of other points have one or two connect components. The method is easy to be implemented and performs well. A result of bifurcation point detection is shown in Fig. 10b. Then, end points but not bifurcation points of vessel segment are detected. With detected end points and bifurcation points, disconnected vessel segments are reconnected by evaluating the orientation and distance between vessel segments as shown in Fig. 10c and Fig. 10d. With the reconnection, corresponding endpoints were converted to bifurcation points, while the others remain as root and leaf nodes of the vessel tree. With the reconnected complete vessel tree, we can encode the vessel tree using a graph. Starting from the root point of the mesenteric vasculature which is initialized as the top of the SMA, we first find the nearest bifurcation points in a pre-defined distance, and then evaluate the connectivity between the root point and these near bifurcation points as shown in Fig. 10d. If a bifurcation point connects to the root point directly, then we add this point as a node in the graph, and add the vessel segment between the point and the root point as an edge in the graph. We then move to the next set of bifurcations. After all bifurcation points are added into the graph, extremas are localized along the vessel segments attached to the leaf nodes as the pink points in Fig. 10d. The extremas and corresponding edges are further added into the graph, and the complete vessel tree is achieved.
Fig. 10.
Building the mesenteric vessel tree. a) Schematic showing bifurcation (3, 4) and non-bifurcation (1, 2, 5) points. b) Bifurcation point detection results for the image shown in Figure 8 (blue points; only part of Fig. 8 is shown for better display), (c) illustration of reconnection procedure (d) Build the vessel map by filling gaps (yellow) and localizing the extremas of the mesenteric vessel tree (pink), only procedure of several branches and extremas are shown, which is used to show the idea not the result.
2) Small Bowel Localization
As discussed above, the mesenteric side of the small bowel is located along extremas of the mesenteric vasculature (Fig. 11). From Fig. 11, we can see that the small bowel region is homogeneous within a certain intensity range. Starting from the mesenteric side of the small bowel, we can identify the other side of the small bowel (the “anti-mesenteric” side) using fuzzy-connectedness (FC) [27] according to intensity and shape. Regions between these two boundaries and close to mesenteric vessels are connected as the expected small bowel region. The small bowel region has high contrast compared to air and fat regions, and has low contrast compared to muscle, colon, liver, and kidney. So, the FC-based region growing will not leak into air and fat regions, but may leak into other organs. Considering the anatomic relationships between the small bowel and the mesenteric vasculature, leaked regions far away from mesenteric vessels will be removed. That is, following shape analysis and connected component analysis, candidate regions far away from all of leaf mesenteric vessels are removed. As shown in Fig. 11, although it leaks into the colon, only part of the colon close to the mesenteric vessels is kept.
Fig. 11.
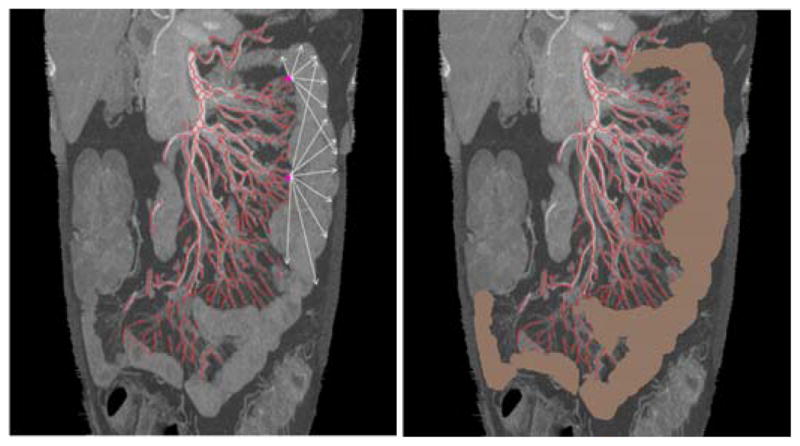
Small bowel boundary detection and region segmentation. The left one shows directions (arrows) of region growing away from extremal points. The right one shows the final small bowel segmentation.
E. Performance Evaluation Method
To assess the capability of our vessel segmentation method, two kinds of standard error metrics were used, overlap and accuracy [20]. We define the manually labeled reference volume A and automatically segmented volume B. Overlap measures, such as precision (mean of volume overlap), recall (true positive fraction) and false positive rate (FPR) are defined as Eqs. 14–16. Two accuracy measures based on distance measurement are defined as Eqs. 17–18: average distance (AD) between the reference standard and the segmented centerline and average distance inside vessel (ADI) which excludes segments whose radius is larger than the reference standard, the later one eliminates the effect of outliers. These evaluation measurements are based on a point-to-point correspondence between the reference standard and the segmented results.
| (14) |
| (15) |
| (16) |
| (17) |
| (18) |
To assess the capability of the small bowel segmentation method, false positive rate (FPR) defined in Eq. 16, volume overlap (VO) and Dice coefficient (DC) [28] defined as Eqs. 19–20 were used. To further assess the capability of the segmentation method and to improve the performance in future, the distribution of false positives (portion rate defined in Eq. 21) is evaluated based on one manually justified case, where the results were reviewed slice-by-slice and the false positive mask was manually labeled as colon, small bowel, muscle and other organs.
| (19) |
| (20) |
| (21) |
IV. Experimental Results
To implement the method, several parameters should be set, such as the number of seeds for vessel tracing, the thickness of slab for generating MIP images, the numbers of scales and views for vesselness enhancement and some pre-defined threshold values. In the experiments, these parameters were set empirically as described in this section and applied to all cases in our database which contains a variety of body compositions and bowel configurations. To address the entire range of vessel sizes and contrasts in abdominal CT angiography data sets, major artery tracing and multi-scale vesselness enhancement were combined in this work. The 3D coronal volume was resampled 4 times to create 4 views, each offset from the other by a 45° rotation about the craniocaudal axis. Vesselness enhancement was conducted on each view independently. By checking all of the data, we can see that the diameter of mesenteric vessels fall in the range of 1 mm – 10 mm. According to the performance of Frangi’s filter, experiments were conducted at 4 scales for Frangi’s filtration. Pre-defined threshold values, such as threshold values to evaluate matching in tracking, distance, orientation and binarization in Frangi’s filters, were set empirically, 0.73, 5 mm, 18°, 0.6–0.8.
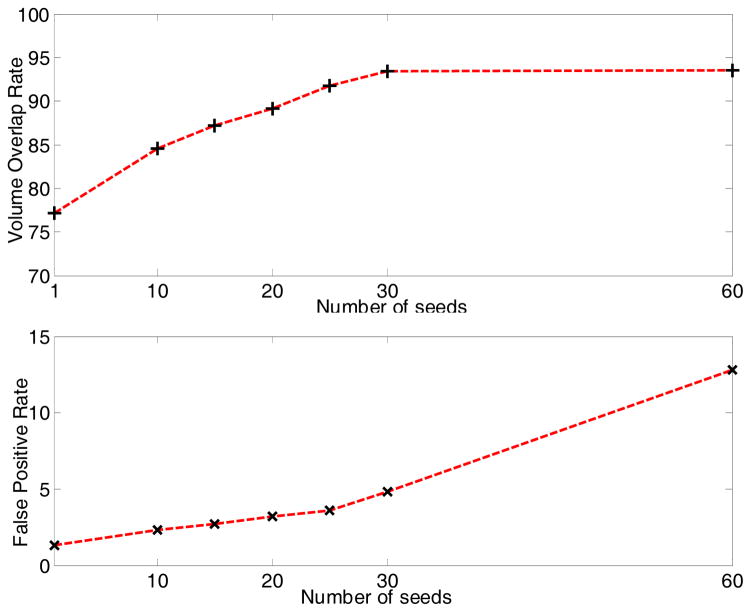
For major artery tracing, the number of seeds affects both the tracing accuracy and computation cost. Experiments for evaluating the effect were conducted. In vessel tracing, each seed was tracked independently. The computation time will increase linearly with the number of seeds, and the cost is acceptable with dozens of seeds. The accuracy (recall defined in Eq. 15) and false positive rate are shown in Fig. 12. We aim to detect three branches of the abdominal aorta (right common iliac artery, left common iliac artery and superior mesenteric artery as shown in Fig. 6) using vessel tracing. Ideally, each branch needs one seed for tracing. To guarantee every branch can be visited by at least one seed, at least 3 seeds should be used. However, we know that more seeds will result in better performance in theory. To choose an appropriate number of seeds, we made a tradeoff between tracing performance and computation cost. As shown in Fig. 12, the recall rate does not increase anymore when there are more than 30 seeds, while there are more false positives. When the number of seeds increases further, the overlap of ground truth and segmentation result (numerator of Eqs. 14–15) approaches the ground truth, and more false positives are segmented. So, the precision will decrease while recall does not, and the false positive rate will increase. Considering the computational cost as well, we set the number of seeds for vessel tracing to be 30 in our experiment.
Fig. 12.
The accuracy of major artery tracing.
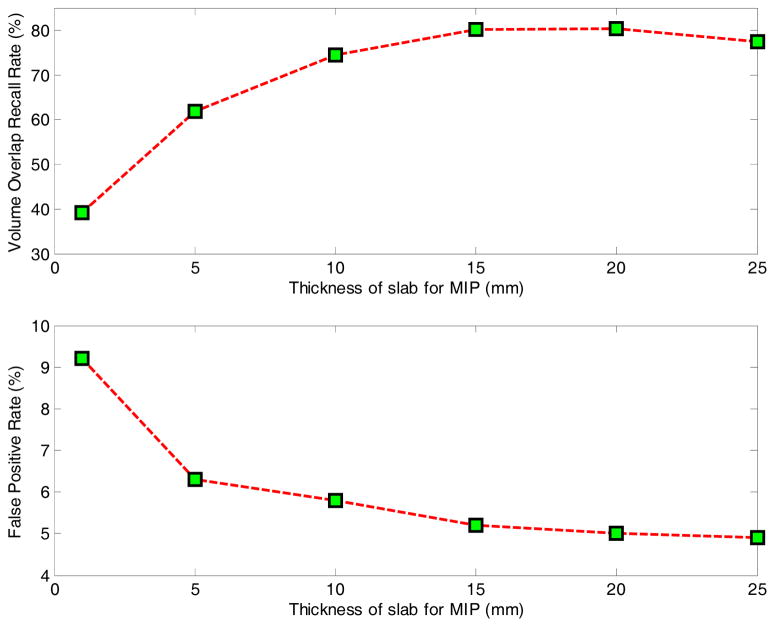
In vesselness enhancement, different thicknesses of slab for building MIP images were evaluated independently. Thickness values of 1, 5, 10, 15, 20 and 25 mm were tested, and the results are shown in Fig. 13. From the results, we can see that when the thickness is very small, such as smaller than 5 mm, vessels in 3D cannot generate clear line structures in 2D image which leads to low volume overlap, while noise cannot be eliminated sufficiently, contributing to many false positives. When the thickness is too large, occlusions of vessels lead to reduced performance. In our experiments, we set the slab thickness to 16 mm.
Fig. 13.
The accuracy of small vessel enhancement result.
For the segmentation of the mesenteric vasculature, the purpose is to segment the vessel centerlines as accurately as possible. The experimental results of mesenteric vessel segmentation are shown in Fig. 8, Fig. 16 and Table I. From the figures whose total width is around 440 mm, we can see that the system can automatically detect small mesenteric vessels with diameter approximately 1 mm. As shown in Fig. 16, the large vessels have smoothed mask compared to small ones because of the small size, low contrast and noises of small vessels. The large vessel mask preserves most of the variations of the vessel appearance such as at locations with protuberance and bifurcations. The mask for small vessels has thorns and disconnections in some places, but they preserve the path compared to the reference. Performance evaluations of vessel tracing for major arteries, vesselness enhancement for small vessels, and the segmentation of the entire vessel tree were conducted independently, and the statistical results of mesenteric vasculature segmentation on one case is shown in Table I. From the table, we can see that more than 83% mesenteric vessels were detected. Furthermore, the recall rate of vessel tracing for major arteries and vesselness enhancement for small vessels were 93.4% and 80.4%, respectively. That is, most missed vessel segments happen on small vessels because of low image contrast and small size of the vessels. Our result tends to present a smaller vessel mask than the truth; this is the reason why average distance and average distance inside vessel are very close.
Fig. 16.
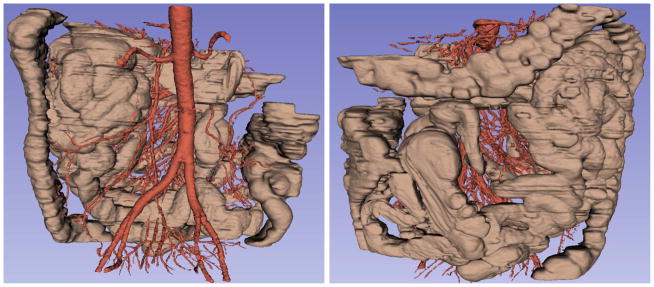
The segmentation result of the small bowel (brown) and the mesenteric vasculature (red) on 3D volume, the same case in anterior and posterior coronal views.
TABLE I.
SEGMENTATION RESULTS OF THE MESENTERIC VASCULATURE.
| Volume Overlap (%) | Accuracy (mm) | ||||
|---|---|---|---|---|---|
| Precision | Recall | FPR | AD | ADI | |
| Vessel Tracing | 95.1 | 93.4 | 4.8 | 1.2 | 1.1 |
| Vesselness enhancement | 94.1 | 80.4 | 5.0 | 1.1 | 1.1 |
| Final Segmentation | 94.5 | 83.8 | 4.9 | 1.1 | 1.1 |
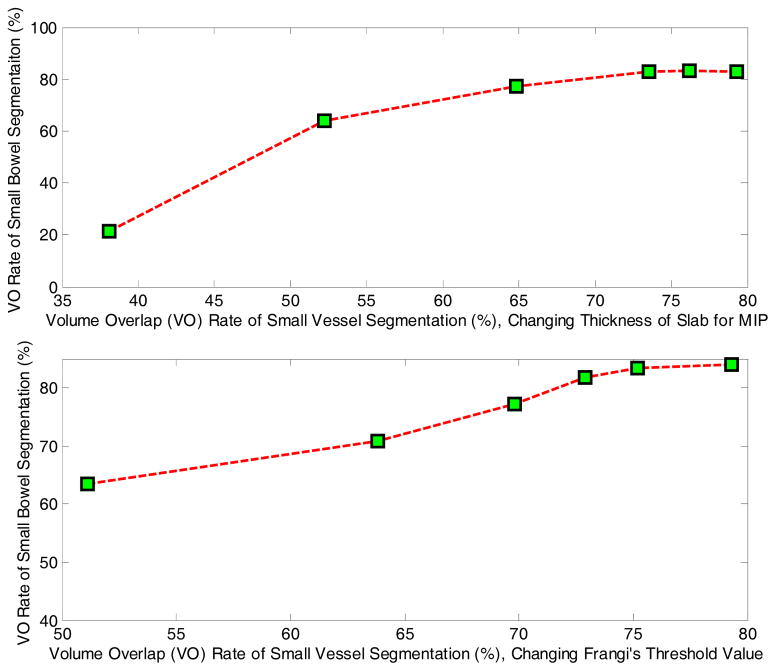
As discussed in the Methods, the performance of small bowel segmentation relies on the performance of mesenteric vasculature segmentation. But the extent of dependence (sensitivity) is not clear. To evaluate the sensitivity of small bowel segmentation on vessel segmentation, experiments with different accuracies of small vessel segmentation were conducted independently, as the performance of vessel tracing for major arteries is stable for different cases. We tested two parameters which can affect the performance of vesselness enhancement, one is the thickness of slab for building MIP images, and the other is the threshold value in Frangi’s filter. The corresponding results are shown in Fig. 14, and we can see that there is no significant improvement of small bowel segmentation when the volume overlap of vessels is above 72%. That is, the performance of small bowel segmentation is stable whenever we can get adequate vessel segmentation. This is the reason why our results rely more on extremas of vessels than on the accurate segmentation of vessels.
Fig. 14.
The accuracy of small bowel segmentation. The top figure is the result by changing the thickness of slab for building MIP images. The lower one is the result by changing the threshold value in Frangi’s filter.
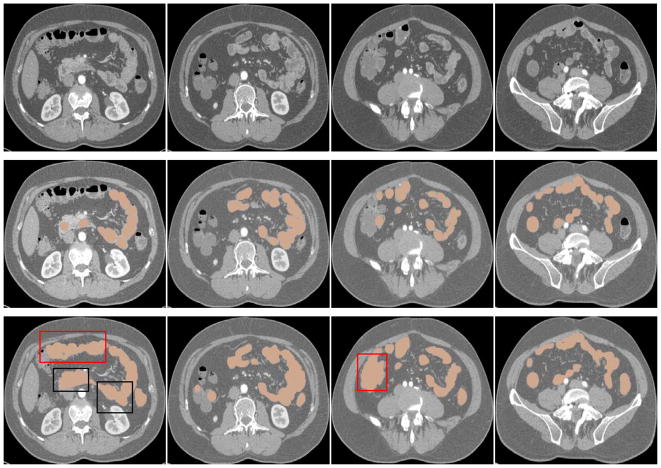
For the segmentation of the small bowel, the purpose is not segmenting the path (centerline) of the small bowel but the small bowel region as accurately as possible. The extraction of the small bowel path will be developed in near future. The experimental results (with fixed parameters) of small bowel segmentation for 11 cases are shown in Fig. 15–16, and Table II. From Fig. 15 and Table II, we can see that the method can segment most of expected small bowel regions, with high Dice’s coefficient and high false positive rate. From the 3D results shown in Fig. 16, we can see that the segmented small bowel region has the similar spatial configuration compared to the manually labeled data as shown in Fig. 2.
Fig. 15.
The segmentation result of the small bowel on axial-view slices. The first row images are the original CT scans, the second row ones are the manually labeled small bowel regions (brown), and the third row ones are automatically segmented results of small bowel regions (brown). Regions specified by red rectangles indicate false positives in colon regions, and regions of black rectangles indicate false positives in small bowel regions.
TABLE II.
SEGMENTATION RESULTS OF THE SMALL BOWEL (%).
| VO | DC | FPR | |
|---|---|---|---|
| Case 1 | 83.5 | 87.5 | 25.2 |
| Case 2 | 86.9 | 89.8 | 22.9 |
| Case 3 | 77.2 | 79.2 | 18.7 |
| Case 4 | 80.2 | 80.3 | 19.0 |
| Case 5 | 83.4 | 84.4 | 18.9 |
| Case 6 | 86.7 | 89.7 | 20.5 |
| Case 7 | 82.1 | 84.5 | 20.8 |
| Case 8 | 83.4 | 84.9 | 22.4 |
| Case 9 | 73.4 | 78.7 | 17.6 |
| Case 10 | 81.7 | 83.7 | 21.6 |
| Case 11 | 79.9 | 80.4 | 25.9 |
| Total | 82.5 ± 3.1 | 84.5 ± 4.8 | 19.7 ± 3.9 |
To study the causes of false positives to improve segmentation performance, the locations of the false positives were determined. Each false positive was double-checked visually and labeled by its location, such as colon, muscle or other organ. Some of the “false positives” were found to in fact be small bowel which was not properly annotated in the ground truth. Small errors in the reference standard of the small bowel mask are unavoidable given the complicated tortuosity and continually varying size of the small bowel on CT scans. Thus, it is not surprising that some bits of small bowel could be missing from the reference standard yet detected by the algorithm, leading to false positives that are actually on the small bowel. As shown in Table III, most false positives belong to the colon (Fig. 15 – 16). The false positives belonging to colon, muscle and other organs are mainly caused by intensity similarity, leakage of the region growing algorithm, and the existence of vessels around these organs. Colon and muscle have almost the same intensity distribution as the small bowel. Many vessels along the side of the colon were incorrectly detected as the small bowel mesenteric vessels (Fig. 16). This is because these vessels connect to the superior mesenteric artery indirectly via the “true” mesenteric vessels supplying the small bowel. As shown in the black rectangle regions in Fig. 15, some small bowel segments touch each other. It is not possible to label them accurately with tubular structures using the manual segmentation tool because the bowel edges are not resolvable and tracing the path of the small bowel in the 3D volume is extremely difficult. The ground truth missed some bits of the small bowel, which contributed to less than 9% of the false positives. Fortunately, this percentage does not affect the evaluation appreciably.
TABLE III.
THE DISTRIBUTION OF FALSE POSITIVES OF THE SMALL BOWEL SEGMENTATION (%).
| Colon | Small bowel | Muscle | Others |
|---|---|---|---|
| 76.8 | 8.9 | 8.2 | 6.1 |
False negatives are mainly caused by over-segmenting the muscle because of the variation of the muscle shape and thickness, and because of missing small mesenteric vessels.
As indicated in Table III, to reduce false positives and further improve the performance of small bowel segmentation, more effort should be made to remove the colon from candidate region. To do so, we tried a supervised learning method to detect the small bowel region directly from CT images. The feature set consists of intensity features such as mean, median and histogram, and texture features such as entropy, standard deviation, contrast, correlation, energy and homogeneity. We used support vector machine (SVM) as the classifier. We tested the method on all cases. One of the detection results are shown in Fig. 17. It is apparent that statistical driven methodology cannot work well by itself, but it can help improve the result of small bowel segmentation. Fig. 18 shows our final goal of small bowel segmentation with manually set colon region.
Fig. 17.
The small bowel segmentation result using statistical model (SVM). The first column are original images, the second column are detection results.
Fig. 18.
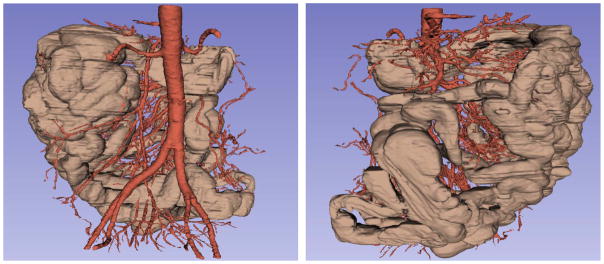
The segmentation result of the small bowel (brown) and the mesenteric vasculature (red) on 3D volume with manually setting the colon region, the same case in two views.
V. Discussion
In this paper, we presented a novel method to segment the entire small bowel region on 3D high-resolution CT data, a very challenging task. To our knowledge, this is the first method to perform complete small bowel segmentation. Motivated by the facts that segmenting blood vessels is easier than segmenting the small bowel and that there are strong anatomic relationships between the mesenteric vasculature and the small bowel, we proposed a mesenteric vasculature-guided method to segment the small bowel. The method identifies the internal abdominal region, segments the mesenteric vasculature, and then segments the small bowel using the mesenteric vasculature as a roadmap. The method is an important prerequisite for future small bowel CAD systems. We found a volume overlap accuracy of 82.5%, which supports the use of the mesenteric vasculature as a roadmap to segment the small bowel on CTA scans.
During the pre-processing, we located the spine, pelvic bones, SAT fat and abdominopelvic muscles, which used our previous work to identify body contour, spine and SAT fat. Locating these anatomical structures introduces extra computational cost but reduces false positives and improves the accuracy of small bowel segmentation.
To segment the mesenteric vasculature, we made contributions to both large and small vessel detection. An adaptive tracing method segments the major abdominal arteries. It can handle large variations in vessel direction, size, shape and intensity by using a multi-linear subspace appearance model which was updated adaptively during tracing. The matching between successive steps is formulated as a probability optimization problem under the Bayesian inference framework, which enhances the generalizability. As shown in the experiment, major artery tracing performed well. To segment small mesenteric vessels, we used multi-scale, multi-view vesselness enhancement filters with additional steps to remove non-vessel line structures and non-mesenteric vessels using statistical classification and a local distance map.
The low contrast, small size and complex structure of mesenteric vessels make their detection very challenging. While our method can segment enough vessels for small bowel segmentation, we can improve the vessel segmentation in two respects. One is to combine the vesselness enhancement in a 3D volume with the multi-view multi-scale vesselness enhancement on MIP images. The other is to eliminate redundant or non-vessel line structures from double-edges on large vessels and large edges on organ boundaries.
To segment the small bowel, we proposed a novel method using the mesenteric vasculature as a roadmap, where extremas of mesenteric vasculature serve as the initialization seeds and fuzzy-connectedness localizes the small bowel region. We also built a complete mesenteric vessel tree by detecting end points of vessel segments and reconnecting disconnected vessel segments.
As mentioned in Section III.D, we built a sketch vessel tree, which may introduce incorrect branching patterns. Local or global optimization methods, such as minimum spanning tree, can be used to reduce these incorrect branches.
The mesenteric vessels also supply the colon with blood. Colonic vessels should be recognized and removed before small bowel segmentation. An intuitive idea is to model the branching pattern, and label different branches of the vessel tree according to the anatomic structure they supply. The vessel branches follow a known branching pattern, e.g., the duodenum, jejunum, ileum and colon. We recently reported progress on automatic anatomical labeling of mesenteric arteries [29] using size, direction, relative position and branching pattern. The labeled vessel tree may enable automated distinction between the colon and small bowel. Other methods [30–31] have been proposed to model vessel trees. Lu et al. [30] used a hierarchical machine learning approach to label and segment generic tubular structures in medical images. Statistical machine learning methods have their merits to handle uncertain problems, such as missing arteries because of vessel segmentation limitations. In future work, we can combine such methods with ours to label mesenteric arteries.
Another approach to distinguish the colon and small bowel is to incorporate statistically-driven methodologies such as the SVM classification of intensity and texture features to remove part of the colon (Fig. 17). However, some parts of the small bowel will have similar features as parts of the colon. To enhance the power of distinguishing the colon and small bowel, more discriminative features should be adopted. Lu et al [32] proposed a set of geometric and spatial features, including volume, length, area, volume-length ratio and area-length ration, to distinguish colon from non-colon regions on CT colonography. For example, the colon is larger than the small bowel, so multi-scale local shape features such as volume-length and area-length ratios may be useful in classification.
Practical applications of small bowel segmentation include more precise localization and automated detection of sites of obstruction, stenosis, tumors, inflammation, bleeding and inflammatory bowel disease. It is very important for small bowel diagnosis as the traditional methods of exploring and examining the small bowel have proved inadequate [33]. Combining the 3D visualization of the small bowel, it can assists in pre-operative planning. Additional applications include the automated detection of mesenteric ischemia, thrombosis and lymphadenopathy and small bowel malrotation and hernias. Segmentation of the normal small bowel will also prove advantageous. It may enable detection of abnormal structures in the abdomen outside the small bowel that are presently difficult to detect because of the complexity and large volume of the small bowel.
Our future work mainly includes three parts, more accurate reference data, color-mapping the small bowel region, and extracting the path of the small bowel. Although the size of the dataset is currently small, it helps us to evaluate the feasibility of our idea to segment the small bowel. We will label more data in future work. To improve the accuracy of the reference standard, we can “paint” (identify all voxels within) the small bowel on all slices instead of using tubular structures to approximate it. For improving the localization of different types of small bowel tumors, it will be useful to segment the small bowel into three parts: the duodenum, the jejunum and the ileum which may be inferred by analyzing the thickness and frequency of the small bowel folds and analyzing the configuration of the mesenteric vessel tree [29]. As reported in [33, 34], around 30% of tumors are located in the ileum and 25% in the duodenum. In malignant neoplasms, the duodenum is the most probable location for adenocarcinoma, while the ileum is the most likely location for carcinoid tumor and lymphoma. The extraction of the small bowel path will be important for clinical application. Given the location and path of the small bowel tumor in the 3D volume, we can determine if the tumor is located inside the small bowel and its distance from a reference point (the stomach, terminal ileum or ligament of Treitz). This information may enable better pre-operative planning and reduce injury to the patient.
Small bowel segmentation is a prerequisite for identifying the small bowel path. Small bowel path finding is a very difficult problem compared to that of colon path finding on CT colonography (CTC). In CTC, the colon is distended with air, larger than the small bowel, infrequently in close apposition with other colonic segments and much easier to segment and determine its path. The small bowel is much longer than the colon, cannot be reliably insufflated with air throughout its length, and is packed tightly in the abdomen with frequent apposition of small bowel segments making it difficult to separate abutting bowel segments. To extend small bowel segmentation to identify the small bowel path, it may be possible to use detailed mesenteric vessel anatomic labels to find waypoints along the small bowel.
Acknowledgments
This research was supported by the intramural research programs of the National Institute of Health Clinical Center and NIDDK.
We thank Andrew Dwyer, MD, for critical review of the manuscript.
Contributor Information
Weidong Zhang, Imaging Biomarkers and Computer-Aided Diagnosis Lab, National Institutes of Health Clinical Center, USA.
Jiamin Liu, Imaging Biomarkers and Computer-Aided Diagnosis Lab, National Institutes of Health Clinical Center, USA.
Jianhua Yao, Imaging Biomarkers and Computer-Aided Diagnosis Lab, National Institutes of Health Clinical Center, USA.
Adeline Louie, National Institute of Diabetes and Digestive and Kidney Diseases, National Institutes of Health, USA.
Tan B. Nguyen, Imaging Biomarkers and Computer-Aided Diagnosis Lab, National Institutes of Health Clinical Center, USA
Stephen Wank, National Institute of Diabetes and Digestive and Kidney Diseases, National Institutes of Health, USA.
Wieslaw L. Nowinski, Biomedical Imaging Lab, Agency for Science, Technology & Research (A*STAR), Singapore
Ronald M. Summers, Email: rms@nih.gov, Imaging Biomarkers and Computer-Aided Diagnosis Lab, National Institutes of Health Clinical Center, USA, phone: 301-402-5486; fax: 301-451-5721
References
- 1.Schwartz GD, Barkin JS. Small Bowel Tumors. Gastrointest Endoscopy Clin N Am. 2006;16:267–275. doi: 10.1016/j.giec.2006.01.022. [DOI] [PubMed] [Google Scholar]
- 2.Soyer P, Boudiaf M, Fishman EK, et al. Imaging of malignant neoplasms of the mesenteric small bowel: New trends and perspectives. Critical Reviews in Oncology/Hematology. 2011;80(1):10–30. doi: 10.1016/j.critrevonc.2010.09.010. [DOI] [PubMed] [Google Scholar]
- 3.Ciresi DL, Scholten DJ. The continuing clinical dilemma of primary tumors of the small intestine. American Surgeon. 1995;61(8):698–702. [PubMed] [Google Scholar]
- 4.Federle MP. CT of the small intestine: Enterography and angiography. Supplement to Applied Radiology. 2007:55–62. [Google Scholar]
- 5.Elnakib A, Gimel’farb G, Suri J, et al. Medical Image Segmentation: A Brief Survey. In: El-Baz AS, Acharya R, Laine UAF, et al., editors. Multi Modality State-of-the-Art Medical Image Segmentation and Registration Methodologies. Springer; New York: 2011. pp. 1–39. [Google Scholar]
- 6.Itwm F. Survey of 3d image segmentation methods. Keywords image processing 3d image segmentation binarization. 2007;123 [Google Scholar]
- 7.Boykov Y, Funka-Lea G. Graph cuts and efficient N-D image segmentation. International Journal of Computer Vision. 2006 Nov;70(2):109–131. [Google Scholar]
- 8.Ng Hp, Huang S, Ong SH, Foong KC, et al. Medical image segmentation using watershed segmentation with texture-based region merging. Conf Proc IEEE Eng Med Biol Soc; 2008. pp. 4039–4042. [DOI] [PubMed] [Google Scholar]
- 9.Heimann T, Meinzer HP. Statistical shape models for 3D medical image segmentation: A review. Medical Image Analysis. 2009 Aug;13(4):543–563. doi: 10.1016/j.media.2009.05.004. [DOI] [PubMed] [Google Scholar]
- 10.Zhang W, Liu J, Yao J, et al. Mesenteric vasculature-guided small bowel segmentation on high-resolution 3D CT angiography scans; IEEE International Symposium on Biomedical Imaging; 2012. pp. 1280–1283. [Google Scholar]
- 11.Marchenko Y, Volkau I, Nowinski WL. Vascular editor: from angiographic images to 3D vascular models. Journal of Digital Imaging. 2010:386–398. doi: 10.1007/s10278-009-9194-8. [DOI] [PMC free article] [PubMed] [Google Scholar]
- 12.Chung H, Cobzas D, Birdsell L, et al. Automated segmentation of muscle and adipose tissue on CT images for human body composition analysis. Medical Imaging: Visualization, Image-Guided Procedures, and Modeling. 2009:72610K–72610K-8. [Google Scholar]
- 13.Zhou X, Hara T, Fujita H, et al. Preliminary Study for Automated Recognition of Anatomical Structure from Torso CT images. Proceedings of the IEEE Engineering in Medicine and Biology; 2005. pp. 650–653. [DOI] [PubMed] [Google Scholar]
- 14.Yao J, Sussman D, Summers RM. Fully automated adipose tissue measurement on abdominal CT. SPIE: Medical Imaging. 2011;79651Z [Google Scholar]
- 15.Yao J, O’Connor SD, Summers RM. Computer aided detection of lytic bone metastases in the spine using routine CT images. ISBI. 2007:512–515. [Google Scholar]
- 16.Zhang W, Liu J, Yao J, et al. Segmenting the Thoracic, Abdominal and Pelvic Musculature on CT Scans Combining Atlas-based Model and Active Contour Model. SPIE: Medical Imaging. 2013;8670:867008-1-6. [Google Scholar]
- 17.Kirbas C, Quek F. A review of vessel extraction techniques and algorithms. ACM Computing Surveys. 2004;36(2):81–121. [Google Scholar]
- 18.Lesage D, Angelini E, Bloch I, et al. A review of 3D vessel lumen segmentation techniques: Models, features and extraction schemes. Medical Image Analysis. 2009;13(6):819–845. doi: 10.1016/j.media.2009.07.011. [DOI] [PubMed] [Google Scholar]
- 19.Friman O, Hindennach M, Kuhnel C, et al. Multiple hypothesis template tracking of small 3D vessel structures. Medical Image Analysis. 2010 Apr;14(2):160–171. doi: 10.1016/j.media.2009.12.003. [DOI] [PubMed] [Google Scholar]
- 20.Metz CT, Schaap M, Van Walsum T, et al. 3D Segmentation in the Clinic: A Grand Challenge II - Coronary Artery Tracking. MICCAI workshop 3D Segmentation in the Clinic; 2008. [Google Scholar]
- 21.Chen F, Wang Q, Wang S, et al. Object tracking via appearance modeling and sparse representation. Image Vision Comput. 2011;29(11):787–796. [Google Scholar]
- 22.Frangi A, Niessen W, Vincken K, et al. Multiscale vessel enhancement filtering. Lecture Notes in Computer Science. 1998:130–137. [Google Scholar]
- 23.Li Q, Sone S, Doi K. Selective enhancement filters for nodules, vessels, and airway walls in two- and three-dimensional CT scans. Medical Physics. 2003 Aug;30(8):2040–2051. doi: 10.1118/1.1581411. [DOI] [PubMed] [Google Scholar]
- 24.Zhou S, Chellappa R. Kullback-Leibler Distance between Two Gaussian Densities in Reproducing Kernel Hilbert Space. IEEE Intl Symp Information Theory. 2004 [Google Scholar]
- 25.Cuisenaire O. Distance transformations: fast algorithms and applications to medical image processing. Universitá Catholique de Louvain; Louvain-la-Neuve: 1999. [Google Scholar]
- 26.Xiong G, Xie L. Automated detection of junctions structures and tracking of their trajectories in 4D images. Information processing in medical imaging proceedings. 2011:486–497. doi: 10.1007/978-3-642-22092-0_40. [DOI] [PubMed] [Google Scholar]
- 27.Udupa JK, Saha PK. Fuzzy Connectedness and Image Segmentation. Proceedings of the IEEE. 2003:1649–1669. [Google Scholar]
- 28.Linguraru MG, Sandberg JK, Li Z, et al. Automated segmentation and quantification of liver and spleen from CT images using normalized probabilistic atlases and enhancement estimation. Medical Physics. 2010;37(2):771–784. doi: 10.1118/1.3284530. [DOI] [PMC free article] [PubMed] [Google Scholar]
- 29.Zhang W, Liu J, Yao J, et al. Automatic Anatomical labeling of Abdominal Arteries for Small Bowel Evaluation on 3D CT Scans. ISBI. 2013:214–217. [Google Scholar]
- 30.Lu L, Wolf M, Liang J, et al. A two-level approach towards semantic colon segmentation: removing extra-colonic findings. Med Image Comput Comput Assist Interv. 2009;12(Pt 2):1009–16. doi: 10.1007/978-3-642-04271-3_122. [DOI] [PubMed] [Google Scholar]
- 31.Gulsun M, Tek H. Robust vessel tree modeling. MICCAI. 2008;11:602–611. doi: 10.1007/978-3-540-85988-8_72. [DOI] [PubMed] [Google Scholar]
- 32.Lu L, Bi J, Yu S, et al. Hierarchical learning for tubular structure parsing in medical imaging: A study on coronary arteries using 3D CT Angiography. ICCV. 2009:2021–2028. [Google Scholar]
- 33.Achour J, Serraj I, Amrani L, et al. Small bowel tumors: What is the contribution of video capsule endoscopy? Clinics and Research in Hepatology and Gastroenterology. 2012 Jun;36(3):222–226. doi: 10.1016/j.clinre.2011.10.005. [DOI] [PubMed] [Google Scholar]
- 34.Neugut AI, Jacobson JS, Suh S, et al. The epidemiology of cancer of the small bowel. Cancer Epidemiology Biomarkers & Prevention. 1998 Mar;7(3):243–251. [PubMed] [Google Scholar]


