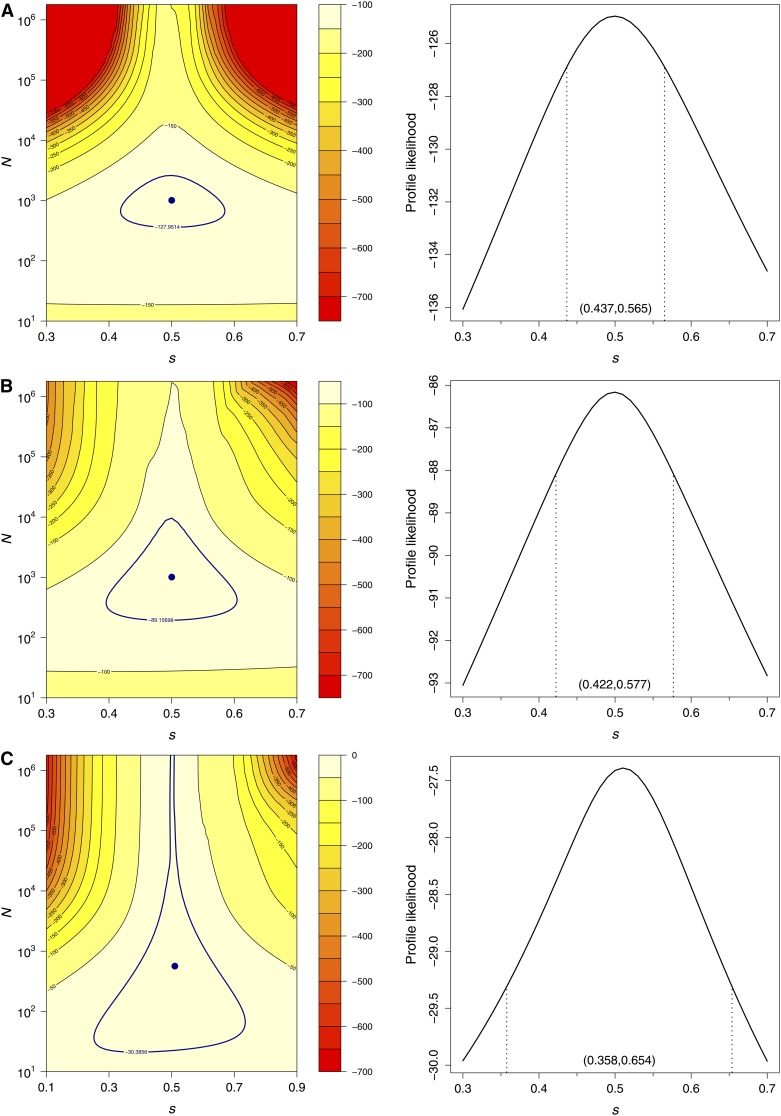
Figure 4.
Log-likelihood surfaces (left) and profile likelihoods for s (right) obtained with the delta method for a selected simulated data set with N = 1000 and s = 0.5. (A) Samples of size 10,000 observed every generation for 20 generations. (B) Samples of size 1000 observed every generation for 20 generations. (C) Samples of size 1000 observed every fourth generation for 20 generations. Navy points indicate MLEs and navy contour lines indicate 95% likelihood regions. Dashed lines on the profile likelihood panels mark the 95% likelihood intervals for s given in parentheses.

