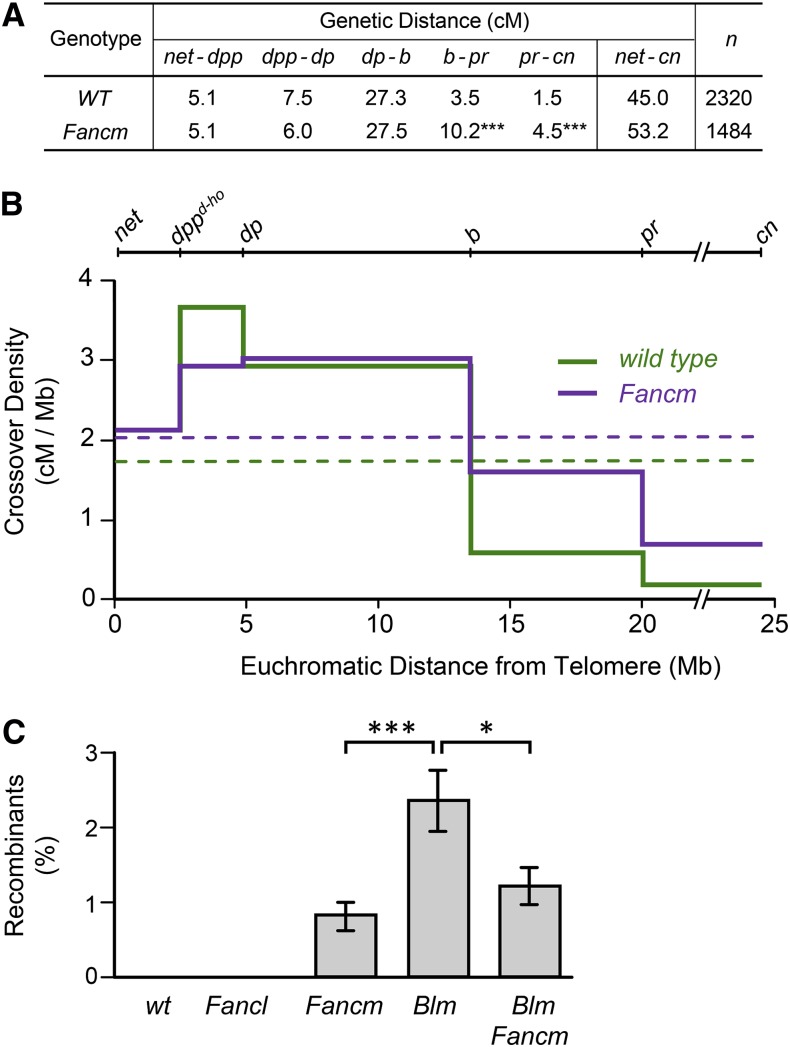
Figure 2.
Meiotic and mitotic crossover elevation in Fancm mutants. (A) Genetic distances, in centimorgans, are given for five adjacent intervals on chromosome 2 (***P < 0.0001); other intervals were not significantly different (P = 0.9647, 0.0776, and 0.9406). (B) Meiotic crossover density. Data from (A) were graphed as crossover density, in centimorgans per megabase pair (Mb). The markers used are shown above the graph. Hash marks between pr and cn indicate the position of the centromere and pericentric heterochromatin (∼16 Mb, not counted in distances shown). Solid lines depict density in each interval; dashed lines are mean density across the entire region. (C) Mitotic crossovers in the male germline. Bars show mean percentage of progeny that were recombinant between st and Sb. Error bars are standard error of the mean. No crossovers were detected in wild-type (wt) or Fancl mutant males. Fancm, Blm, and Blm Fancm were each significantly different from wild-type and Fancl (P < 0.01 for each comparison). The difference between Fancm and Blm Fancm was not significant (P > 0.99). *P < 0.0294; ***P < 0.0001. P-values reported have been adjusted for multiple comparisons (see Materials and Methods). n = (left to right) 40, 41, 46, 39, and 30.

