Abstract
The mechanical properties of tissue change significantly during the progression from healthy to malignant. Quantifying the mechanical properties of breast tissue within the tumor microenvironment can help to delineate benign stages from cancerous. In this work, we study high-grade invasive ductal carcinoma in comparison with their matched tumor adjacent areas, which exhibit benign morphology. Such paired tissue cores obtained from eight patients were indented using a MEMS-based piezoresistive microcantilever, which was positioned within pre-designated epithelial and stromal areas of the specimen. Field emission scanning electron microscopy studies on breast tissue cores were performed to understand the microstructural changes from benign to cancer. The normal epithelial tissues appeared compact and organized. The appearance of cancer regions, in comparison, not only revealed increased cellularity but also showed disorganization and increased fenestration. Using this technique, reliable discrimination between epithelial and stromal regions throughout both benign and cancerous breast tissue cores was obtained. The mechanical profiling generated using this method has the potential to be an objective, reproducible, and quantitative indicator for detecting and characterizing breast cancer.
Introduction
The contrast in elastic stiffness of normal and cancerous breast cells and tissues has been long recognized.1 Studies have revealed that the elasticity and/or deformability in breast cells/tissues are associated with the malignancy.2–10 Recent research has shown mechanical phenotyping to be an effective quantitative biomarker for characterizing state of malignancy in cells and tissues.11,12 Several methods such as micropipette aspiration, laser-based tweezers, magnetic probes11, elastography13–16 and indentation-type atomic force microscopy (IT-AFM)17 have been proposed to study mechanical properties of biomaterials and breast tissue.
Due to its superior precision capabilities and minimal sample preparation, AFM techniques have proved to be more reliable and accurate. But the AFM measurement suffers from practical problems like complex electronics, bulky optics, and its incompatibility to use in opaque liquids.18–26 Thus, there exist a challenge to improvise the method of mechanical phenotyping to simplify its use, while retaining the reliability and accuracy of measurements.
Piezoresistive sensing overcomes the cited limitations. Piezoresistive sensors translate the force to resistance.27–36 Existing literature indicates considerable research in understanding the cancer cellular response to external force37–41, but the use of piezoresistive sensing42 in characterizing diseased tissue is only now emerging as a viable approach for achieving this end. One major challenge in testing such a hypothesis lies in the heterogeneous structural, chemical, and biophysical properties of tumor tissue. Unlike controlled-environment experiments conducted on cells, which result in easy isolation of populations, non-targeted probing into tumor tissue may produce a complex picture with multiple structural elements contributing to the local mechanoresponse.
Breast cancer continues to be the second leading cause of cancer-related death amongst American women.43 A method capable of reliably quantifying the underlying changes that occur in tissue during onset and progression of cancer will provide insight into the architectural changes of the tissue while potentially leading to improved methods for early detection and more accurate staging. Most of the literature suggests that breast cancer originates from epithelial tissue which forms lobules and ducts that are often seen in an underdeveloped state, except during lactation or in disease. Although the mutant parenchyma cells dominated many cancer researchers’ focus and attention for most part of last century, it is now recognized that the stromal, which surrounds and supports the epithelial, also plays an important role in tumorigenesis, progression, and metastasis. Routine molecular markers of breast cancer management include estrogen receptor and progesterone receptor. Statuses of these two biomarkers remain the most important factors for treatment designation and prognosis in breast cancer.44,45 P63 and smooth muscle actin are routinely used to visualize myoepithelial structure while providing evidence of tumor progression.46–48 Alpha-smooth muscle actin, as a marker of desmoplastic change, has also recently proven to correlate with patient outcome.49–50
In this Article, we report a method for reliably characterizing breast cancer tissue using a fabricated piezoresistive microcantilever (PMC) equipped with an SU-8 tip. With the help of tissue microarray51,52 and digital pathology technologies, our experiment was strategically designed to examine matching benign and cancerous regions of patients in epithelial as well as stromal components within the specimens to study and chronicle changes in the tissue’s piezoresistive characteristics in these regions in both benign and cancerous samples. Annotated regions-of-interest (ROIs) from human breast tissues that originated from eight patients were interrogated using PMC and the change in resistance was measured as a function of indentation. The method presented in this paper is simpler than traditional techniques and provides objective, reproducible, and quantitative indicators, which facilitate detection and staging of the onset and disease progression in breast cancer. Staining of serial sections of the specimen with related cancer markers confirms region saliency.
Materials and Methods
2.1 Human biopsies
Tissue microarray (TMA) technology was used to allow accurate sampling of the identified regions. Eight cases of high-grade invasive ductal carcinoma, which is the most common subtype of breast cancer, were chosen from the biospecimen repository located at Histopathology and Imaging Core Facility at Rutgers Cancer Institute of New Jersey. Matching tumor and normal adjacent tissue blocks were selected. Three small format TMAs (3×4 experimental cores) were constructed (0.6 mm cores, 1.0 mm spacing) to contain two cores from each donor block using an Auto Tissue Arrayer (Beecher ATA-27). The TMAs were quality controlled by certified pathologist and serially sectioned at 4 ± 0.17 μm thicknesses (Supplementary Fig. S1).53
Immunohistochemistry
2.2 General Protocol
All IHC were performed using Ventana Discovery XT automated IHC/ISH slide staining system. Slides were cut at 4–5um. Deparaffinization and antigen retrieval were performed using CC1 (Cell Conditioning I, Ventana Medical Systems, Cat # 950-124). All primary antibodies were incubated at 37°C for 1 hour. Universal Secondary Antibody (Ventana Medical Systems, Cat#760-4205) was incubated for 12 minutes followed by chromogenic detection kit DAB Map (Ventana Medical Systems, Cat # 760-124) or Red Map (Ventana Medical Systems, Cat # 760-123). Slides were counterstained with Hematoxylin, then dehydrated and cleared before cover slipping from Xylene.
2.3 Estrogen Receptor (ER)
Paraffin slides were cut at 4–5um. Deparaffinization and antigen retrieval was performed using CC1 (Cell Conditioning Solution, Ventana Medical Systems, Cat# 950-124). Anti-ER (Ventana Medical Systems, Cat#790-4324, rabbit monoclonal antibody) was applied and slides were incubated at 37°C for 1 hour. Universal Secondary antibody (Ventana Medical Systems, Cat#760-4205) was incubated for 12 minutes followed by chromogenic detection kit DABMap (Ventana Medical Systems, Cat# 760-124). Slides were counterstained with Hematoxylin, then dehydrated and cleared before cover slipping from Xylene.
2.4 Progesterone Receptor (PR)
Paraffin slides were cut at 4–5um. Deparaffinization and antigen retrieval were performed using CC1 (Cell Conditioning Solution, Ventana Medical Systems, Cat# 950-124). Anti-PR (Ventana Medical Systems, Cat# 790-2223, rabbit monoclonal antibody) was applied and slides were incubated at 37°C for 1 hour. Universal Secondary antibody (Ventana Medical Systems, Cat#760-4205) was incubated for 12 minutes followed by chromogenic detection kit DABMap (Ventana Medical Systems, Cat# 760-124). Slides were counterstained with Hematoxylin, then dehydrated and cleared before cover slipping from Xylene.
2.5 Dual IHC staining: P63+Smooth Muscle Actin (SMA)
Paraffin slides were cut at 4–5um. Deparaffinization and antigen retrieval were performed using CC1 (Cell Conditioning Solution, Ventana Medical Systems, Cat # 950-124). Anti-P63 (Ventana Medical Systems, Cat#790-4509, mouse monoclonal antibody) was applied and slides were incubated at 37°C for 1 hour. Universal Secondary antibody (Ventana Medical Systems, Cat#760-4205) was incubated for 12 minutes followed by chromogenic detection kit DABMap (Ventana Medical Systems, Cat# 760-124).
Slides were well-rinsed and re-labeled with proper protocols. Anti-SMA antibody (Ventana Medical Systems, Cat#760-2833, mouse monoclonal antibody) was applied and slides are incubated at 37°C for 1 hour. Universal Secondary antibody (Ventana Medical Systems, Cat # 760-4205) was incubated for 12 minutes followed by chromogenic detection kit RedMap (Ventana Medical Systems, Cat #760-123). Slides were counterstained with Hematoxylin, then dehydrated and cleared before cover slipping from Xylene.
2.6 Imaging and biomarker evaluation
Stained specimens were imaged using a Trestle whole slide scanner under 20X objective. The images had a scale of 0.33μm/pixel and were displayed on image servers at Rutgers Cancer Institute of New Jersey. Board-certified pathologist visually evaluated the immunohistochemical specimens using the TMA-Miner software developed in house, grading each tissue core with strategically designed evaluation qualifiers.
2.7 Experimental Setup
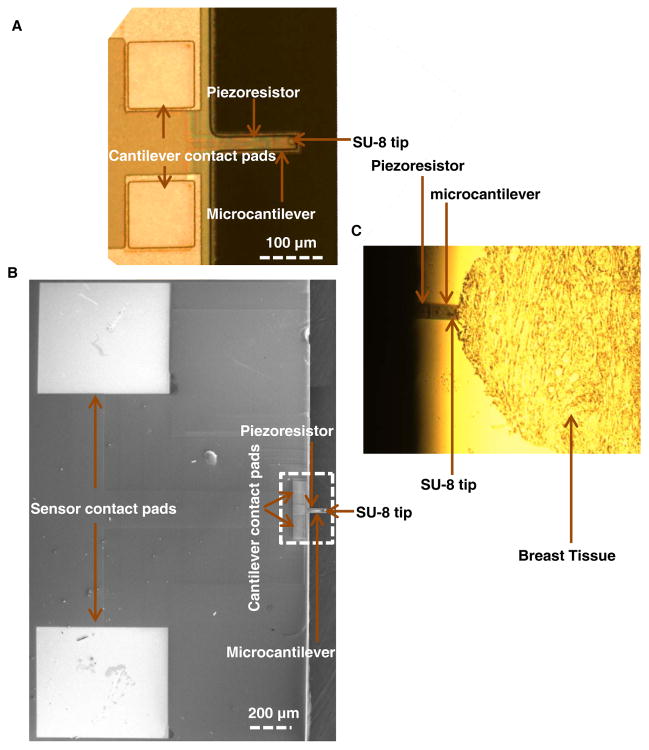
The mechanical characterization of breast tissue samples was performed by indenting the region of interests (ROIs) using a PMC sensor integrated with an SU-8 tip (Fig. 1). The piezoresistive microcantilevers (PMCs) (130 μm long, 40 μm wide and 2 μm thick) were fabricated using standard micromachining techniques. The process flow of sensor fabrication has been reported in our prior work.54 The difference in the present work is that the sensor is fabricated from pre-fabricated silicon-on-insulator (SOI) substrate instead of laboratory-made SOI.
Fig. 1.
Piezoresistive Microcantilever. (A, B) SEM and optical image of the microcantilever, (C) Microcantilever indenting the breast tissue.
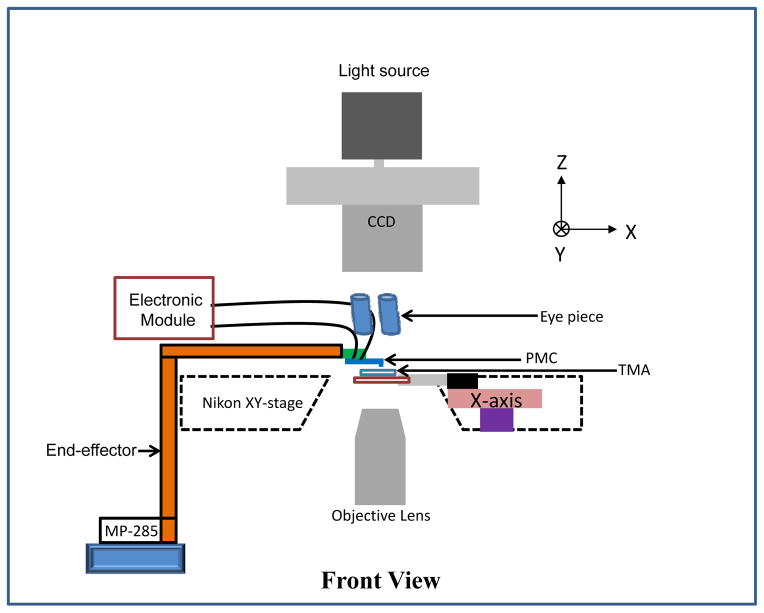
The resistance of the PMC sensor was 498.4 Ω in its undeformed configuration. The tissue microarray (TMA) slide was placed on the piezoactuated stage (range of the X and Y-axes is 90 μm and the customized range for the Z-axis is 40 μm). The fabricated PMC was attached to custom-made end-effector, which was attached to a motorized MP-285 micromanipulator (manufactured by Sutter Instruments, Novato, CA). The TMAs were viewed using an inverted microscope with a CCD camera (QImaging Inc, Model: Retiga 2000R) mounted atop to capture the image (see schematic in Fig. 2). The optical images of hematoxylin and eosin (H&E) stained tissue cores for 8 different patients are shown in Fig. 3.
Fig. 2.
Experimental Setup. Schematic of the tissue microarray (TMA) slide placed on the piezoactuated stage and piezoresistive microcantilever attached to custom-made end-effector which is attached to a motorized MP-285 micromanipulator.
Fig. 3.
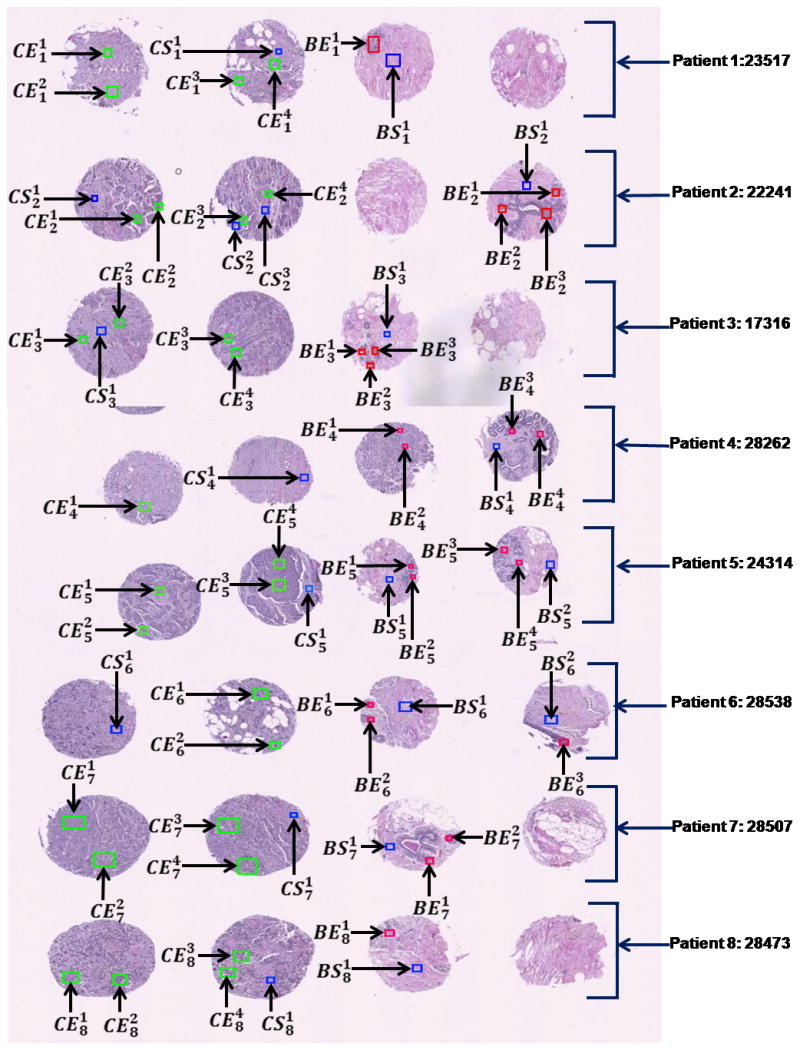
Tissue Microarray (TMA). A composite of H&E stained TMA images from all experiment patients with annotations highlighted. Green: cancer epithelial region of interest, Red: Benign epithelial ROI, Blue: stromal region of interest.
Staining was performed on adjacent sections of the same TMAs that were no more than 4μm apart. These stained TMA sections were digitized into whole slide images and could be browsed online with zooming and panning features. Next, these whole slide images were annotated to highlight rectangular regions of targeted tissue component so that the corresponding regions on the unstained section can be easily located and sampled.
The annotation of valid epithelial and stromal regions in benign and cancerous breast tissue cores was conducted by a certified pathologist. The annotations are marked by:
where, C and B denotes cancerous and benign tissue and E and S denotes epithelial and stromal region, respectively. The index, i, denotes the patient number and the index, j, denotes the annotation number.
The overall goal of this research is two-fold: (a) to extend the findings into developing a probe that can be used on surgical site for detecting tumor/tumor margin, and (b) at the microscopic scale, develop a better understanding of the mechanical changes in the tumor environment and correlate it with tumor biology based on changes in tissue morphology and/or molecular changes at protein or even cytogenetic level. In our prior work55, we found a correlation between fixed tissue and cancer cell line. Results from a recent fresh tissue study was also in concordance.14
Results and discussion
The PMC was connected in half-bridge configuration to convert the change in resistance to voltage and the output of the bridge circuit was applied to a data acquisition card (Sensoray, Model 626)via buffer and was displayed on the computer screen (Supplementary Fig. S2). The fabricated PMC was pressed down on a glass substrate to measure its sensitivity. The change in voltage (V) was plotted as a function of the vertical distance (Z) and the sensitivity of the sensor was measured (Supplementary Fig. S3).
Sixty eight annotated tissue ROIs were examined in the present study.
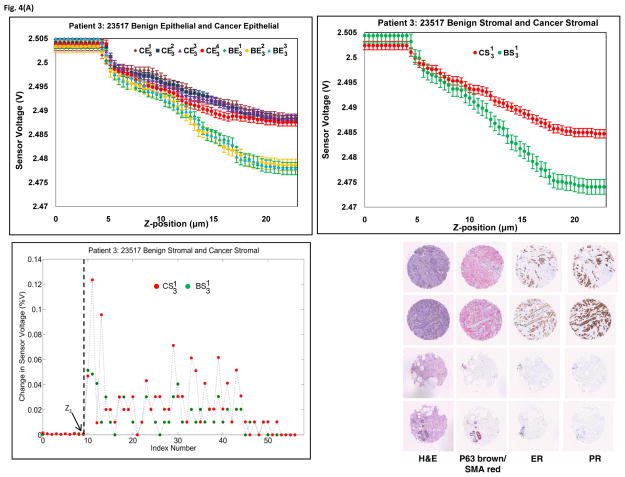
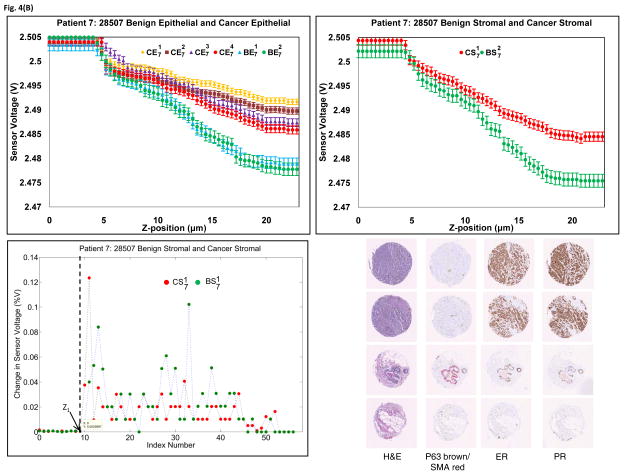
The fabricated PMC was used to indent the tissue at three different points per ROI. The change in voltage for the same z-displacement in epithelial regions as well as stromal regions for patient 3 and patient 7, as well as their corresponding histological and immunohistological samples, were plotted in Fig. 4. As seen in the figure, the placement of ROIs can be confirmed with hematoxylin and eosin (H&E) morphology. Cancer epithelial regions often shown increased Estrogen receptor staining as well as a loss of normal lobule/ductal structure encased by P63/SMA staining as shown by an arrow. Similar results for other cases can be seen in Supplementary Fig. S4. Clear and repeatable demarcation of piezoresistive response between cancer and benign tissue can be found in every case. The results obtained from all eight cases shows that the sensor data is reproducible and we believe that the current method has the potential to be developed into a quantitative measurement for biomechanical characterization of tissue. The plot of percentage change in sensor voltage versus index (index corresponds to each z-position) for patient 3 and patient 7 (stromal case) is shown in Figs. 4(a) and 4(b), respectively. From the figure, the point at which there is significant change in sensor voltage is considered as the initial point of contact, Z1. It can be seen from Fig. 4 and Supplementary Fig. S4 that the sensor saturates at higher displacements, which may be due to maximum bending of the sensor and thus can be attributed as an intrinsic property of the PMC. Hence, it is seen that the slope is different at higher displacements.
Fig. 4.
Piezoresistive and immunohistological results from (A) Patient 3 and (B) Patient 7. Upper left: Sensor responses from epithelial tissue. Upper right: Sensor responses from stromal tissue. Bottom Left: Percentage change in sensor voltage versus index (z-position). Bottom right: Histology and biomarker statuses of the ROIs. Tissue cores were stained with H&E, P63(brown)/SMA(red), ER and PR.
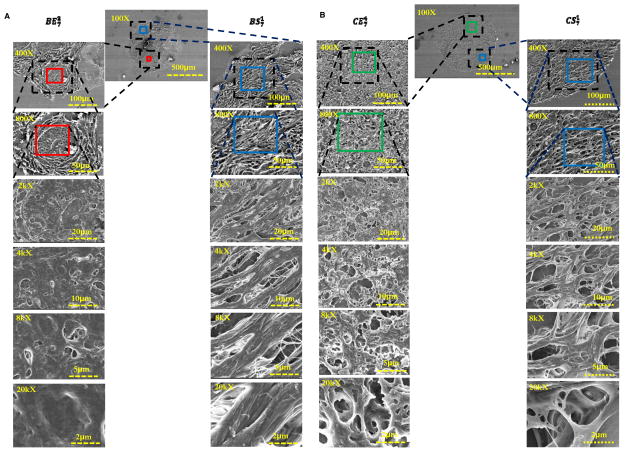
When examined under Field emission scanning electron microscopy (FE-SEM) (Fig. 5 and supplementary Fig. S5), the normal epithelial tissues were seen as compact and organized. The appearance of cancer regions, in comparison, not only revealed increased cellularity but also showed disorganization and increased fenestration. In addition to the coarse bundles of collagen in normal stromal images, the tumor stromal regions displayed a more intricate architecture, which was likely caused by desmoplastic changes such as an increased level of microvasculature.
Fig. 5.
FE-SEM images for specimen 7. (A) Benign stromal and benign epithelial, and (B) cancer stromal and cancer epithelial. The benign epithelial tissues were seen as compact and organized. The appearance of cancer regions, in comparison, not only reveals increased cellularity but also shows disorganization and increased fenestration. In addition to the coarse bundles of collagen in normal stromal images, the tumor stromal regions display more intricate architecture.
The characterization and analysis of human tissue samples rendered by pathologists has long been the “gold-standard” for patient evaluation and care.56–57 Aided by visual enhancement of specimens using various histochemical and immunohistochemical treatments, an important part of a pathologists’ role is to understand the normal structure of specimen, including morphology of disparate tissue components and spatial relationships amongst them, recognize structural aberrations as related to known pathogenesis, and, in case of cancer, identify the source cells of tumorigenesis as well as the degree of progression. All of this information enables oncologists to determine patient prognosis and choose a specific treatment plan. Since the development of piezoresistive sensors continues to advance, we proposed this technology as feasible aid in cancer diagnosis and cancer research.
To avoid any alteration of the tissue that might change its underlying physical qualities, the tissue sections used in our studies were unstained, which rendered them nearly impossible to interpret visually using traditional methods. The challenge of positioning the probe to the proper location within the tissue samples was resolved through the use of tissue microarray technology, which reduces specimens to manageable sizes under microscope while allowing investigators to utilize corresponding serial sections of the specimen to undergo histological and immunohistological staining to provide context and guidance during sampling.
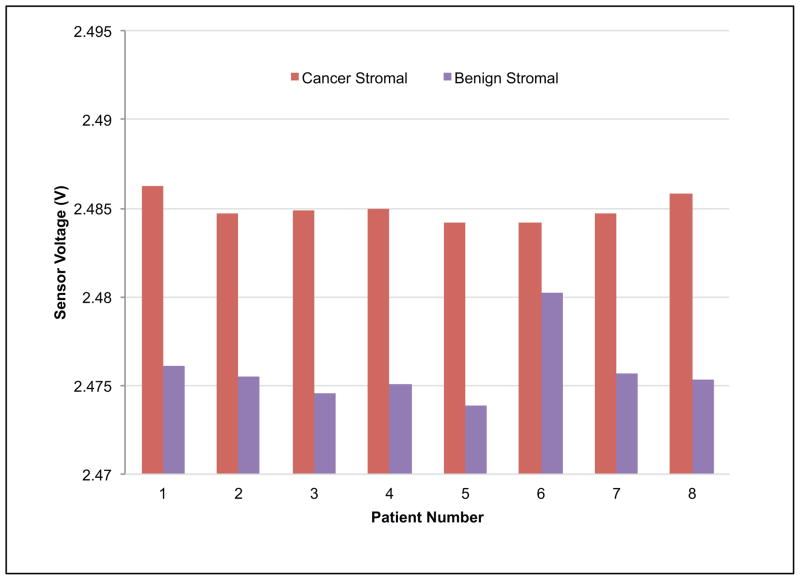
We found that for the same z-displacement, the sensitivity of the measurement differed for each class of tissue: benign epithelial, benign stromal, cancer epithelial, and cancer stromal. The patterns of sensor voltage for each was consistent across all patients examined (Supplementary Fig. S4). It was further observed that, for the same z-displacement, the change in voltage for benign epithelial was higher than cancer epithelial, and benign stromal was higher than cancer stromal. This indicates that tissues tend to become less stiff over the course of disease progression and that stromal regions are stiffer than epithelial in the specimens that originated from the same patient (benign or cancerous). Our findings match the observations16,18 indicating that the stiffness of the tissue decreased with the progression of breast cancer. Further, the observed change in voltage was higher in benign epithelial when compared to cancer stromal indicating that not only epithelial but also stromal regions lose stiffness during the course of cancer progression.
The tissue response is inherently nonlinear and the sensor is not a rigid probe. Hence, when the sensor indents the tissue surface, the tissue indentation is non-linear compared to the sensor displacement. Thus, even when there is >4 μm displacement of the sensor (due to the motion of the z-stage), due to the difference in the stiffness of the sensor and the tissue, the tissue indentation would not be the same as z-stage displacement of the manipulator. We currently have no way to measure the true tissue indentation. The microtome (Reichert-Jung 2030) that was used for slicing the TMAs in this experiment is routinely calibrated by professional service and operated by skilled technicians. All specimens in the batch were sliced under the same equipment settings.48 The thickness of the tissue was 4.0 ± 0.17 μm.53
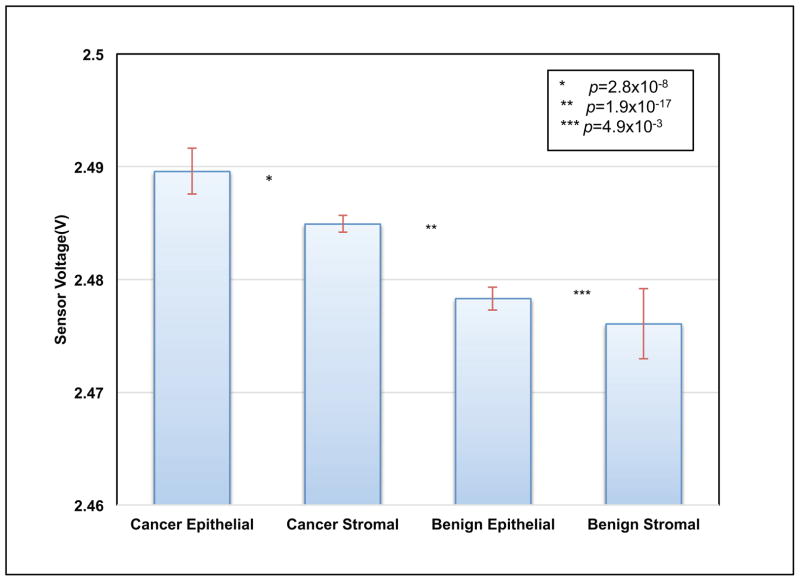
The statistical analysis on the data obtained from indenting the PMC on breast tissue was performed using t-test. We extracted voltage measurements at certain z-position of the probe (20 μm). Data in Fig. 6 is grouped into four groups (un-paired samples) by tissue and disease type, namely: cancer epithelial, cancer stromal, benign epithelial and benign stromal. Using the t-test, the p-values were 2.8 × 10⁻⁸, 1.9 × 10⁻¹⁷, and 4.9 × 10⁻³ between cancer epithelial/cancer stromal, cancer stromal/benign epithelial, and benign epithelial/benign stromal, respectively. High statistical significance was unanimously found between each adjacent group for unpaired samples.
Fig. 6.
Reproducibility of result for un-paired tissues. Voltage values for each piezoresistive responses curve were extracted at 20 μm and aggregated by group as shown. The red bar shows within-group standard deviations. The t-test found high significance between each adjacent group (p values as shown).
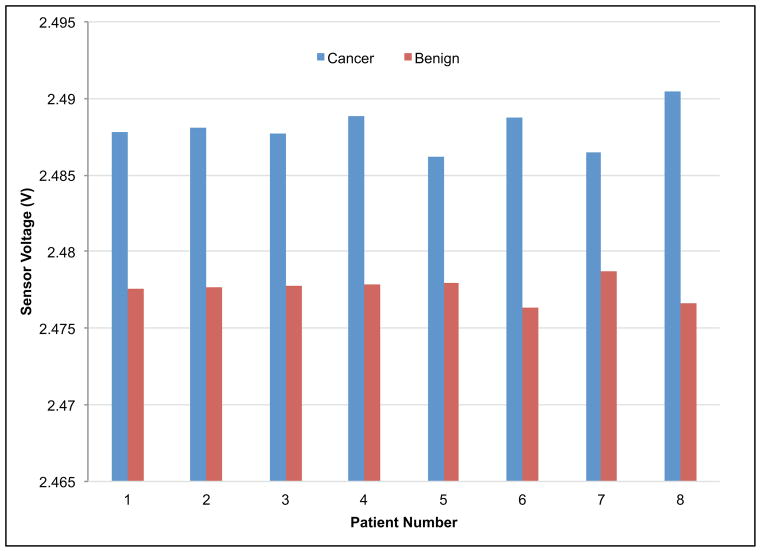
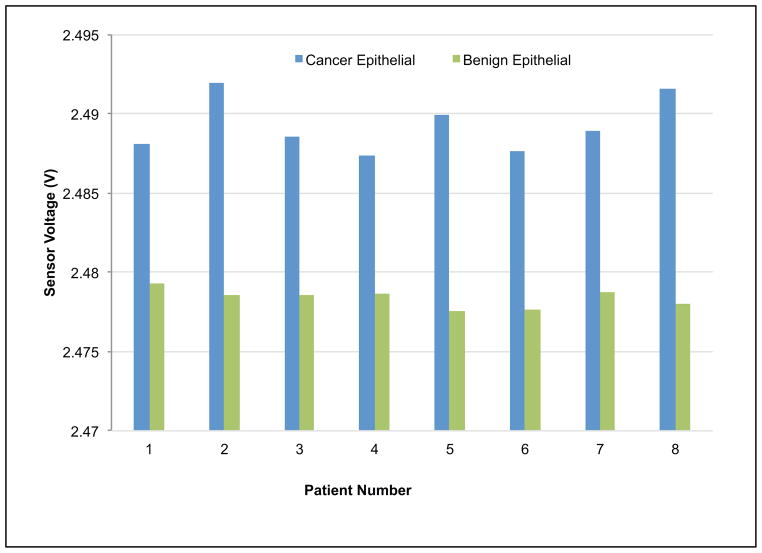
Since our experimental design incorporated paired cancer/benign tissue samples from patients, t-test (n=8) was performed and gave p-values of 1.4 × 10⁻⁶, 9.7 × 10⁻⁷, and 6.5 × 10⁻⁶ between cancer/benign specimens, cancer/benign epithelial, and cancer/benign stromal specimens respectively (see Fig. 7). By pairing the results obtained from the benign and diseased tissue component from the same patient, the data demonstrated consistent loss in firmness (resulting in lower voltage output from the sensor) when the tissue changes from benign to cancer on an individual basis.
Fig. 7.
Indentation results for paired tissues samples. Voltage values for each piezoresistive responses curve were extracted at 20 μm and aggregated by group (a) benign versus cancer, (b) benign epithelial versus cancer epithelial, and (c) benign stromal versus cancer stromal. The t-test found high significance between cancer/benign specimens, cancer/benign epithelial, and cancer/benign stromal.
The paired tissue experiment was designed with built-in control mechanism: Paired cancer and benign tissue specimens were extracted from fixed tissue blocks that were harvested in the same manner at the same surgery and stored under the same condition. After the tissue cores were placed into the tissue microarray, they were processed together under same physical and chemical condition. As the results were stable and significant across all 8 cases used, we believe it is safe to conclude that there is significant difference across the groups examined.
Though current techniques helps to identify the changes in the tissue on a gross scale from benign to cancer, subtle changes in the tissue properties as well as correlation to morphological changes are not accurately captured. Thus, the goal of this research is to capture subtle changes in the mechanical properties of the tissue, which could help the physician to quantify the progression of cancer from the onset of malignancy.
Conclusions
Results from our initial experiments show significant promise in producing a reliable and reproducible micro-scale mechanical measurement that can be used to characterize and delineate diseased breast cancer tissue at the time of biopsy or surgery. The probe is not only simple but also small enough to report tissue changes at the microscopic level. Our experimental protocol involving serial sections also provides effective means for establishing a mechano-morphological-molecular profile of ex vivo tumor specimens, which may allow future insights into tumor biology. In our future work, we plan to extend this research on fresh tissue specimens through close collaboration with clinical researchers.
Supplementary Material
Acknowledgments
Research reported in this publication was supported by the National Cancer Institute of the National Institutes of Health under Award Number R01CA161375. The content is solely the responsibility of the authors and does not necessarily represent the official views of the National Institutes of Health. We acknowledge the support of Maryland Nanocenter for FE-SEM images and sensor fabrication.
Footnotes
Electronic Supplementary Information (ESI) available: [details of any supplementary information available should be included here]. See DOI: 10.1039/b000000x/
References
- 1.Chenevert TL, Skovoroda AR, O’Donnel M, Emelianov SY. Magnet Reson Med. 1998;39(3):482–490. doi: 10.1002/mrm.1910390319. [DOI] [PubMed] [Google Scholar]
- 2.Park CC, Bissell MJ, Barcellos-Hoff MH. Mol Med Today. 2000;6:324–329. doi: 10.1016/s1357-4310(00)01756-1. [DOI] [PubMed] [Google Scholar]
- 3.Needham D. Cell Biophys. 1991;18:99–121. doi: 10.1007/BF02989809. [DOI] [PubMed] [Google Scholar]
- 4.Paszek MJ, Weaver VM. J Mammary Gland Biol. 2004;9:325– 342. doi: 10.1007/s10911-004-1404-x. [DOI] [PubMed] [Google Scholar]
- 5.Kumar S, Weaver V. Cancer Metast Rev. 2009;28:113–127. doi: 10.1007/s10555-008-9173-4. [DOI] [PMC free article] [PubMed] [Google Scholar]
- 6.Kass L, Erler JT, Dembo M, Weaver VM. Int J Biochem Cell. 2007;B39:1987–1994. doi: 10.1016/j.biocel.2007.06.025. [DOI] [PMC free article] [PubMed] [Google Scholar]
- 7.Butcher DT, Alliston T, Weaver VM. Nature Rev Cancer. 2009;9:108–122. doi: 10.1038/nrc2544. [DOI] [PMC free article] [PubMed] [Google Scholar]
- 8.Sinkus R, Lorenzen J, Schrader D, Lorenzen M, Dargatz M, HolzPhys D. Med Biol. 2000;45:1649–1664. doi: 10.1088/0031-9155/45/6/317. [DOI] [PubMed] [Google Scholar]
- 9.Paszek MJ, Zahir N, Johnson KR, Lakins JN, Rozenberg GI, Gefen A, Reinhart-King CA, Margulies SS, Dembo M, Boettiger D, Hammer DA, Weaver VM. Cancer Cell. 2005;8:241–254. doi: 10.1016/j.ccr.2005.08.010. [DOI] [PubMed] [Google Scholar]
- 10.Levental KR, Yu H, Kass L, Lakins JN, Egeblad M, Erler JT, Fong SFT, Csiszar K, Giaccia A, Weninger W, Yamauchi M, Gasser DL, Weaver VM. Cell. 2009;139:891–906. doi: 10.1016/j.cell.2009.10.027. [DOI] [PMC free article] [PubMed] [Google Scholar]
- 11.Kim D, Wong PK, Park J, Levchenko A, Sun Y. Ann Rev Biomed Eng. 2009;11:202–233. doi: 10.1146/annurev-bioeng-061008-124915. [DOI] [PubMed] [Google Scholar]
- 12.Roy R, Chen W, Goodell L, Hu J, Foran D, Desai J. Int Conf Biomed Robot Biomech. 2010:710–715. [Google Scholar]
- 13.Lekka M. Eur Biophys J. 1999;28(4):312–316. doi: 10.1007/s002490050213. [DOI] [PubMed] [Google Scholar]
- 14.Plodinec M, Loparic M, Monnier CA, Obermann EC, Dallenbach RZ, Oertle P, Hyotyla JT, Aebi U, Bentires-Alj M, Lim RYH, Schoenenberger CA. Nat Nanotechnol. 2012;7:757–765. doi: 10.1038/nnano.2012.167. [DOI] [PubMed] [Google Scholar]
- 15.Ophir J. Proc Inst Mech Eng. 1999;213(3):203–233. doi: 10.1243/0954411991534933. [DOI] [PubMed] [Google Scholar]
- 16.Manduca A. Med Image Anal. 2001;5(4):237–254. doi: 10.1016/s1361-8415(00)00039-6. [DOI] [PubMed] [Google Scholar]
- 17.Lekka M. Eur Biophys J. 1999;28(4):312–316. doi: 10.1007/s002490050213. [DOI] [PubMed] [Google Scholar]
- 18.Gimzewski JK, Gerber C, Meyer E, Schlittler RR. Chem Phys Lett. 1994;217:589–594. [Google Scholar]
- 19.Thundat T, Warmack RJ, Chen GY, Allison DP. Appl Phys Lett. 1994;64:2894–2896. [Google Scholar]
- 20.Mukhopadhyay R, Sumbayev VV, Lorentzen M, Kjems J, Andreasen PA, Besenbacher F. Nano Lett. 2005;5:2385–2388. doi: 10.1021/nl051449z. [DOI] [PubMed] [Google Scholar]
- 21.Ghatkesar MK, Lang HP, Gerber C, Hegner M, Braun T. PLoS One. 2008;3:1–6. doi: 10.1371/journal.pone.0003610. [DOI] [PMC free article] [PubMed] [Google Scholar]
- 22.Backmann N, Zahnd C, Huber F, Bietsch A, Pluckthun A, Lang HP, Guntherodt HJ, Hegner M, Gerber C. Proc Natl Acad Sci USA. 2005;102:14587–14592. doi: 10.1073/pnas.0504917102. [DOI] [PMC free article] [PubMed] [Google Scholar]
- 23.Berger R, Delamarche E, Lang HP, Gerber C, Gimzewski JK, Meyer E, Guntherodt HJ. Science. 2007;276:2021–2024. [Google Scholar]
- 24.Fritz J, Baller MK, Lang HP, Rothuizen H, Vettiger P, Meyer E, Guntherodt HJ, Gerber Ch, Gimzewski JK. Science. 2000;288:316– 318. doi: 10.1126/science.288.5464.316. [DOI] [PubMed] [Google Scholar]
- 25.Lang HP, Baller MK, Berger R, Gerber C, Gimzewski JK, Battiston FM, Fornaro P, Ramseyer JP, Meyer E, Güntherodt HJ. Anal Chim Acta. 1999;393:59–65. [Google Scholar]
- 26.Roy R, Chen W, Goodell L, Hu J, Foran D, Desai J. IEEE Trans Autom Sci Eng. 2013;10(2):462–465. doi: 10.1109/TASE.2012.2226154. [DOI] [PMC free article] [PubMed] [Google Scholar]
- 27.Loui A, Goericke F, Ratto T, Lee J, Hart B, King W. Sensors Actuat. 2008;A147:516–521. [Google Scholar]
- 28.Tortonese M, Barrett R, Quate C. Appl Phys Lett. 1993;62:834–836. [Google Scholar]
- 29.Hansen O, Boisen A. Nanotechnology. 1999;10:51–60. [Google Scholar]
- 30.Harkey J, Kenny TW. J Microelectromech Syst. 2000;9:226–235. [Google Scholar]
- 31.Yu X, Thaysen J, Hansen O, Boisen A. J Appl Phys. 2002;92:6296–6301. [Google Scholar]
- 32.Duc TC, Creemer J, Sarro PM. IEEE Sensors J. 2007;7:96–104. [Google Scholar]
- 33.Park SJ, Goodman MB, Pruitt BL. Proc Natl Acad Sci USA. 2007;104(44):17376–17381. doi: 10.1073/pnas.0702138104. [DOI] [PMC free article] [PubMed] [Google Scholar]
- 34.Tortonese M, Yamada H, Barrett RC, Quate CF. In Proc. 6th Int. Conf Solid-State Sensors and Actuators (Transducers’91); 1991. pp. 448–451. [Google Scholar]
- 35.Harley JA, Kenny TW. Appl Phys Lett. 1999;75:289–291. [Google Scholar]
- 36.Wang J, Lange D, Zimmermann M, Hagleitner C, Brand O, Baltes H. In Proc. of 11th Int. Conf Solid-State Sensors and Actuators (Transducers’01); 2001. pp. 1074–1077. [Google Scholar]
- 37.Pillarisetti A, Keefer C, Desai JP. IEEE/RAS-EMBS International Conference on Biomedical Robotics and Biomechatronics-BioRob. 2008:618–623. [Google Scholar]
- 38.Pillarisetti A, Keefer C, Desai JP. 11th International Symposium on Experimental Robotics; Athens, Greece. 2008. pp. 261–269. [Google Scholar]
- 39.Tao NJ, Lindsay SM, Lees S. Biophys J. 1998;63:1165–69. doi: 10.1016/S0006-3495(92)81692-2. [DOI] [PMC free article] [PubMed] [Google Scholar]
- 40.Vinckier A, Semenza G. FEBS Lett. 1998;430:12–16. doi: 10.1016/s0014-5793(98)00592-4. [DOI] [PubMed] [Google Scholar]
- 41.Hassan EA, Heinz WF, Antonik MD, D’Costa NP, Nageswaran S, Schoenenberger CA, Hoh JH. Biophys J. 1998;74(3):1564–1578. doi: 10.1016/S0006-3495(98)77868-3. [DOI] [PMC free article] [PubMed] [Google Scholar]
- 42.Sankar AR, Jency JG, Das S. Microsyst Technol. 2012;18:9–23. [Google Scholar]
- 43.Cancer facts & figures 2013. Atlanta: American Cancer Society; 2013. [Google Scholar]
- 44.Fitzgibbons PL, Page DL, Weaver D, Thor AD, Allred DC, Clark GM, Ruby SG, O’Malley F, Simpson JF, Connolly JL, Hayes DF, Edge SB, Lichter A, Schnitt SJ. Arch Pathol Lab Med. 1999;124:966–978. doi: 10.5858/2000-124-0966-PFIBC. [DOI] [PubMed] [Google Scholar]
- 45.Esteva FJ, Hortobagyi GN. The Surgical clinics of North America. 1999;79:1075–1090. doi: 10.1016/s0039-6109(05)70062-1. [DOI] [PubMed] [Google Scholar]
- 46.Manders P, Tjan-Heijnen VCG, Span PN, Grebenchtchikov N, Foekens JA, Beex LVAM, (Fred) Sweep CGJ. Cancer Res. 2004;64:659–664. doi: 10.1158/0008-5472.can-03-1820. [DOI] [PubMed] [Google Scholar]
- 47.Kievit W, Bolster MJ, van der Wilt GJ, Bult P, Thunnissen FBJM, Meijer J, Strobbe LJA, Klinkenbijl JHG, Wobbes T, Adang EMM, Beex LVAM, Tjan-Heijnen VCG. Ann Oncol. 2005;16:1874–1881. doi: 10.1093/annonc/mdi394. [DOI] [PubMed] [Google Scholar]
- 48.Gianni L. J Clin Oncol. 2009;27:2474–2481. doi: 10.1200/JCO.2008.19.2567. [DOI] [PubMed] [Google Scholar]
- 49.Harbeck N, Alt U, Berger U, Kruger A, Thomssen C, Janicke F, Hofler H, Kates RE, Schmitt M. Clin Cancer Res. 2001;7:2757–2764. [PubMed] [Google Scholar]
- 50.Manders P, Bult P, Sweep CG, Tjan-Heijnen VC, Beex LV. Breast Cancer Res Treat. 2003;77:77–84. doi: 10.1023/a:1021138801890. [DOI] [PubMed] [Google Scholar]
- 51.Kononen J, Bubendorf L, Kallionimeni A, Bärlund M, Schraml P, Leighton S, Torhorst J, Mihatsch MJ, GS, Kallionimeni OP. Nat Med. 1998;4:844–847. doi: 10.1038/nm0798-844. [DOI] [PubMed] [Google Scholar]
- 52.Chen W, Foran DJ. Anal Chim Acta. 2006;564:74–81. doi: 10.1016/j.aca.2005.11.083. [DOI] [PMC free article] [PubMed] [Google Scholar]
- 53.Pandya HJ, Kim HT, Roy R, Chen W, Cong L, Zhong H, Foran DJ, Desai JP. Sensor Actuat B. 2014;199:259–268. doi: 10.1016/j.snb.2014.03.065. [DOI] [PMC free article] [PubMed] [Google Scholar]
- 54.Pandya HJ, Kim HT, Roy R, Desai JP. Mat Sci Semicon Proc. 2014;19:163–173. doi: 10.1016/j.mssp.2013.12.016. [DOI] [PMC free article] [PubMed] [Google Scholar]
- 55.Roy R, Chen W, Hu J, Goodell LA, Foran DJ, Desai JP. Archives in Pathology & Laboratory Medicine. 2010. pp. 934–939. [Google Scholar]
- 56.Sardanelli F, Podo F, Santoro F, Manoukian S, Bergonzi S, Trecate G, Vergnaghi D, Federico M, Cortesi L, Corcione S, Morassut S, Maggio CD, Cilotti A, Martincich L, Calabrese M, Zuiani C, Preda L, Bonanni B, Carbonaro LA, Contegiacomo A, Panizza P, Cesare ED, Savarese A, Crecco M, Turchetti D, Tonutti M, Belli P, Maschio AD. AJR Am J Roentgenol. 2004;183:1149–1157. [Google Scholar]
- 57.Li QS, Lee GYH, Ong CN, Lim CT. Biochem Biophys Res Commun. 2008;374:609–613. doi: 10.1016/j.bbrc.2008.07.078. [DOI] [PubMed] [Google Scholar]
Associated Data
This section collects any data citations, data availability statements, or supplementary materials included in this article.


