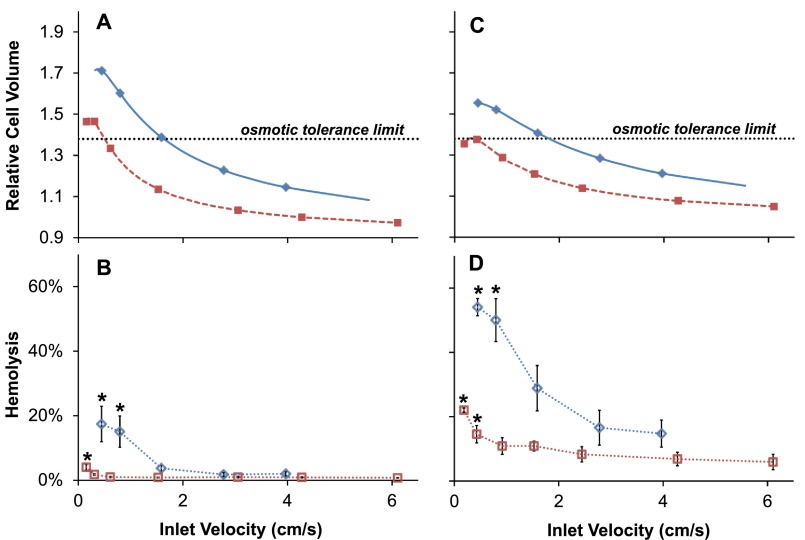
FIG. 3.
Cell volume predictions and corresponding hemolysis measurements. (a) and (b) show results for RBCs in 10% glycerol. (c) and (d) show results for frozen-thawed RBCs in 40% glycerol. Squares and diamonds are data points obtained from experiments conducted in the 130 and 50 μm device, respectively. Asterisks indicate a statistically significant difference compared with the fastest fluid velocity.

