

Abstract
Study Objectives:
To address some of the questions about “who” has been tested for OSA (in terms of pretest risk and study outcomes) using a leading national portable recorder (PR; “home sleep test”)
Design:
This was a retrospective analysis of a large repository of de-identified test results and pretest OSA risk from 2009 to 2013.
Setting and Patients:
A total of 244,602 patients were referred for testing from a variety of clinical practices across North America. A total of 193,221 studies were included in the final analyses.
Interventions:
NA.
Measurements and Results:
The final sample was predominately male (59%), middle-aged (53.5 ± 14.2 years), obese (BMI > 30; 54%), with a large neck circumference (males = 16.9 ± 1.2 in; females = 15.0 ± 1.3 in) and a mild degree of reported sleepiness (ESS 8.7 ± 5.3). Approximately 50% of the sample endorsed a history of hypertension. The majority of patients (89.6%) were at a high risk for OSA as assessed by the ARES screening questionnaire. Of this group, 79.9% had an AHI ≥ 5 (MAHI = 18.2 ± 18.1) and 98% had an RDI ≥ 5 (MRDI = 28.0 ± 19.6). The majority of patients (∼60%) that screened at no apparent risk for OSA indeed had AHIs < 5 events/h. Those with a high pretest risk for OSA but low test outcomes (AHI < 5) were twice as likely to be female and approximately 20% to 30% more likely to report a history of insomnia, lung disease, and/or stroke.
Conclusions:
The majority of PR has been conducted on patients with a high degree of suspicion for OSA. These data suggest that PR has been used in patients with a high pretest probability of OSA. Patients with a history of insomnia, stroke, and/or lung disease may especially benefit by a comprehensive evaluation by a physician trained in sleep medicine, especially if PR results are negative for OSA. Future studies should evaluate the utility of gender-appropriate screening measures. Although questionnaire-based screening is helpful in determining OSA risk, it is imperative that it be used in conjunction with clinical decision-making.
Citation:
Cairns A, Poulos G, Bogan R. Who is getting tested for obstructive sleep apnea using a portable recording system? Test results from 193,221 patients. J Clin Sleep Med 2014;10(11):1193-1198.
Keywords: home sleep test, portable monitor, OCST, sleep apnea, ARES
Obstructive sleep apnea syndrome (OSA) is a serious medical condition associated with increased morbidity, mortality, and high direct and indirect costs. Diagnosing OSA has traditionally required an attended polysomnogram (PSG). However, ambulatory testing, also known as “home sleep testing,” “out of center sleep testing,” or “portable recording (PR)” is rapidly gaining traction, in part because it is less costly and more convenient for patients than traditional attended studies. The American Academy of Sleep Medicine (AASM) has concluded that PR can be a reliable, valid alternative to traditional in-lab testing for carefully selected individuals with a high pre-test probability of moderate to severe OSA without underlying complicating sleep/wake disorders or other significant medical conditions that may hinder accurate results.1
BRIEF SUMMARY
Current Knowledge/Study Rationale: To address some of the concerns about “who” has been tested for OSA using a portable recorder (PR), we aim to describe a large national sample of patients that have been tested for OSA using a leading PR. Findings from this study suggest that providers in the sleep medicine community recognize that appropriate patients to be evaluated by PR for OSA should be high pretest probability without contraindicated comorbidities.
Study Impact: This study suggests that the vast majority of patients tested for OSA using a common PR were at high risk for OSA and had test outcomes in line with said risk (AHI ≥ 5). It also adds to the body of knowledge in reference to prevalence of comorbidities and patient symptoms, and supports the notion that questionnaire-based screening for OSA should always be done in conjunction with a comprehensive sleep evaluation, as all screening instruments have limitations.
However, many providers in the sleep medicine community remain concerned about the use of PR, partly due to questions about the controls (or lack thereof) in place to regulate “appropriate” use including patient candidacy (i.e., high risk for moderate to severe OSA without contraindications), test interpretation, treatment recommendations, and follow-up care. For example, much concern surrounds lack of consensus about who should be tested vs. who has been/is being tested, as many insurance carriers and managed care companies now require PR as a first-line diagnostic strategy2,3 over PSG, and such requirements may not strictly adhere to AASM recommendations.4 The aim of this study is to address some of the questions about who is/has been tested for OSA using PR with regard to pretest risk for OSA, self-reported medical conditions and demographics, anthropometric risk factors, and geographical region of testing.
METHODS
The SleepMed, Inc. Apnea Risk and Evaluation System (ARES) model 610 consists of a head-worn Unicorder, integrated OSA risk assessment, web-based data management platform, study quality review, and coordinated board certified physician interpretation. The ARES Unicorder simultaneously records airflow by nasal pressure via nasal cannula, oxygen saturation (SpO2) and heart rate by forehead reflectance pulse oximetry, snoring via a calibrated acoustic microphone, and head position/movement via forehead accelerometry. Electroencephalogram data is recorded from 2 frontal lobe derivations (FP1 and FP2) and is used to discriminate REM from NREM sleep.5 The device's algorithm estimates sleep time using surrogate behavioral indicators of quiescence (non-movement and regularity in nasal flow and/or snoring). Automated respiratory event analysis scores obstructive events as apnea when flow is reduced by ≥ 90% for ≥ 10 sec, and hypopnea when flow is reduced by ≥ 50% for ≥ 10 sec and is associated with a ≥ 4% desaturation. Flow-limited events are scored when a hypopnea terminates with ≥ 1 surrogate arousal indicators (increased movement, snoring, or pulse rate) and a ≥ 1% desaturation. The ARES model 610 and associated autoscoring algorithm has demonstrated adequate sensitivity (0.98) and specificity (0.76) when compared to simultaneously recorded PSG using an AHI cutoff ≥ 5 events per hour (4% desaturation).6
The ARES pretest screening questionnaire (Appendix) quantifies OSA risk (none, low, high) based on self-reported symptoms of OSA (snoring, witnessed apneas, and sleepiness) as well as anthropomorphic risk factors (BMI and neck circumference) and common comorbid medical risk factors (hyper-tension, diabetes, cardiovascular disease, and stroke). Data on sleepiness are acquired from an embedded Epworth Sleepiness Scale. The screener also inquires about potentially contraindicated sleep/wake conditions (insomnia, restless legs syndrome [RLS], and narcolepsy) as well as medical conditions that may reduce the accuracy of PR (lung disease and opioid use).1 The questionnaire is available in both electronic and paper (Appendix) versions and has demonstrated adequate sensitivity (0.94) and specificity (0.79) compared to PSG using an AHI cutoff ≥ 5 events per hour (4% desaturation) in high-risk candidates.7
Data were retrieved from the SleepMed repository of deidentified ARES study outcomes from the study's final interpretation report. All studies were conducted using the ARES model 610. Studies were ordered by a variety of providers including board certified sleep specialists, pulmonologists, neurologists, and dentists, etc. As we only accessed de-identified study outcomes, no data were available on provider type or if/ which studies opted for local scoring and/or self-interpretation. If available, data were also acquired on pretest OSA “risk” as per the SleepMed ARES screening questionnaire (Appendix). Studies were excluded from analyses if there were missing pre-test risk or anthropometric/demographic data. Studies were also excluded if valid recording time (defined as the length of the sleep period [time in bed] minus wake after sleep onset and periods of poor signal integrity) was < 2 h. The apnea-hypopnea index (AHI) and a respiratory disturbance index (RDI) were calculated as the average number of apneas and hypopneas per hour of valid recording time and the average number of apneas, hypopneas, and flow-limited events per hour of valid recording time, respectively. Analyses were performed using SPSS 16.0 (SPSS Inc., Chicago, IL). Descriptive analyses were completed to analyze the shape, central tendency, and dispersion of all variables. Sex differences in continuous variables were analyzed using univariate analysis of variance (ANOVA) with eta squared (η2) to estimate effect size. Differences between nominal or dichotomous variables were analyzed using χ2 with phi coefficient (Φ) or logistic regression with odds ratios (OR) and Nagelkerke R2 to estimate effect size. P-values < 0.05 were considered statistically significant.
RESULTS
A total of 244,181 patients were tested for the presence of OSA using the ARES between January 2009 and October, 2013. A total of 43,760 patients (17.9%) were excluded from analyses because of missing anthropomorphic or demographic data. A total of 1,227 (< 1%) tests were missing pretest risk information. Approximately 3% of the studies had < 2 h of valid recording time.
Demographics and Comorbidities
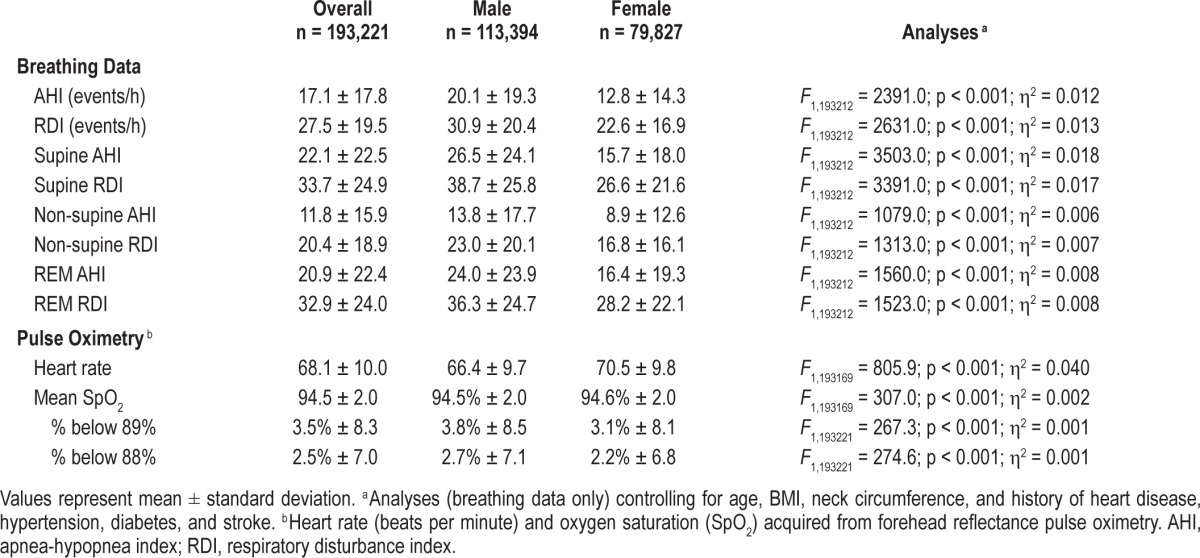
The final adult sample consisted of 193,221 patients and was predominately male (59%), middle-aged (53.5 ± 14.2 years), and obese (BMI ≥ 30 kg/m2; 54%), with a large neck circumference and a mild degree of reported sleepiness (Table 1). The most common self-reported sleep diagnoses were insomnia and restless leg syndrome. The most common self-reported medical/other diagnoses were hypertension, depression, and diabetes (% endorsed yes to “have you been diagnosed or treated for any of the following conditions?”). In this sample, females were slightly older, had larger BMIs, and had a higher incidence of nearly all self-reported comorbidities. However, males had tests results indicative of more severe OSA (Table 2). Modal number of study nights was 1 (78.5%) with a mean recording duration of 6.4 ± 1.2 h and mean valid sleep time of 5.5 ± 1.1 hours. Patients who had ≥ 2 study nights were similar in terms of OSA risk, anthropometrics, demographics, medical history, and test outcomes to those with only 1 study night.
Table 1.
Demographics.

Table 2.
Portable recording data from 193,221 patients being tested for OSA using the ARES between January 2009 and October 2013.
Geographical Breakdown
The majority of studies were conducted in North America (88.6% United States and 10.8% Canada). Fewer than 1% of ARES studies were completed in Europe. Within the United States, 36.3%, 24.8%, 17.2%, and 10.5% of studies were completed in the Southern US, Western US, Northeastern US, and Midwest.8 A small number of studies (n = 81; < 0.1%) were completed in Alaska and Hawaii. Compared to the United States, patients from Canada were younger (50.8 ± 13.6 vs. 53.9 ± 14.2 years; F1, 192,034 = 899.0; p < 0.001; η2 = 0.005), leaner (BMI; 30.5 ± 5.4 kg/m2 vs. 31.4 ± 5.8; F1, 192,034 = 505.1; p < 0.001; η2 = 0.003), generally healthier (Table 3), and had PR outcomes indicative of less severe OSA (AHI 15.8 ± 17.6 vs. 17.2 ± 17.7 events/h; F1, 192,034 = 121.3; p < 0.001; η2 = 0.001). Gender breakdown was similar to that of the United States.
Table 3.
Geographical differences in self-reported medical conditions.

Pretest Risk and Test Outcomes
The vast majority of patients (89.6%) were at a high risk of OSA as assessed by the ARES screening questionnaire (Figure 1) and was similar for Canadian vs. the United States (US = 90.0% vs. Canada = 85.2%). Of the high OSA risk group, 79.9% had an AHI ≥ 5 (MAHI = 18.2 ± 18.1) and 98% had an RDI ≥ 5 (MRDI = 28.0 ± 19.6). A small percentage of patients (n = 6,677; 3.5%) were screened as having no apparent risk for OSA based on the ARES questionnaire. Of this group, the majority of patients (58.0%) indeed had studies with AHIs < 5 events/h, but many had some indication of OSA (42% AHI ≥ 5 and 86.1% RDI ≥ 5 events/h). Very few patients screened as no apparent risk for OSA had test results in the severe category (≥ 30 events/h; 3.5% using AHI, and 9.2% using RDI).
Figure 1. Bar graph showing ARES portable recording outcomes (AHI and RDI severity) based on pretest risk and severity for OSA using the ARES Screener Questionnaire.

Predictors of a Negative Test Result (AHI < 5) Despite High OSA Risk
A multiple logistic regression analysis was employed to identify factors that predicted a negative test result (AHI < 5) despite being pre-screened as being at high risk of OSA as per the ARES screening questionnaire (n = 39,989). Predictor variables included sex, age, obesity (BMI ≥ 30), sleepiness (ESS ≥ 12), use of sleep and pain medication, valid recording time (as per PR), and a history of narcolepsy, RLS, depression, insomnia, stroke, heart disease, hypertension, diabetes, or lung disease. Valid recording time, use of pain medication, and history of diabetes, RLS, and narcolepsy were removed from the final model as they did not reach statistical significance. The final model was significant, χ2 (11, N = 193,221) = 19381.8, p < 0.001, R2 = 16.8%, and the most robust predictors were female sex (β = 0.80; OR: 2.2), obesity (β = -0.65; OR: 0.5), use of sleep medication (β = 0.25; OR: 1.3), and a history of lung disease (β = 0.26; OR: 1.3), hypertension (β = -0.17; OR: 0.8), and/or stroke (β = 0.14; OR: 1.2).
Predictors of a Positive Test Result (AHI ≥ 5) Despite Low OSA Risk
Compared to patients accurately screened as high risk of OSA (i.e., had a positive PR outcome; AHI ≥ 5), patients incongruently pre-screened as no risk for OSA (i.e., had a positive PR outcome; AHI ≥ 5) were younger (53.4 ± 14.1 vs. 55.8 ± 13.5 years; F1, 143974 = 85.1, p < 0.001; η2 = 0.001), leaner (25.6 ± 4.1 vs. 31.9 ± 5.7 kg/m2; F1, 143974 = 341.4, p < 0.001; η2 = 0.023), less sleepy (5.0 ± 4.6 vs. 8.9 ± 5.3; F1, 143974 = 143.1, p < 0.001; η2 = 0.010), and had test results with less severe OSA (AHI; 18.1 ± 16.3 vs. 27.7 ± 23.0; F1, 143974 = 566.7, p < 0.001; η2 = 0.004. They were also more likely to be male (50.0% vs. 36.0%, χ2 (1, N = 143,976) = 214.3, p < 0.001; Φ = 4.0%) and were generally healthier, as almost none (< 0.01%) reported a history of hypertension, diabetes, heart disease, or stroke.
DISCUSSION
The present study suggests that the majority of ARES studies have been conducted on adult patients with a high degree of suspicion of sleep apnea. Although we do not know if these findings can be extrapolated to other devices, these data are encouraging because they suggest that a significant portion of referring PR providers have been utilizing PR based on published guidelines.1 The majority of ARES testing has been conducted in the southeastern region of the United States. Although it is unknown if these findings are generalizable to all portable testing or simply due to more active sales efforts in this region, it may be an approximate of utilization trends. The finding that Canadian patients were younger and generally healthier may be at least partially due to the differences in healthcare systems between the USA and Canada, however these data require further investigation.
This study is the first to elucidate the discriminatory capacity of a PR device to detect OSA in patients with varying levels of pre-test OSA risk1 and indeed suggests that (1) the ARES screening questionnaire (Appendix) has good predictive capacity in determining OSA risk and (2) PR is most appropriately and efficiently used in patients with a high pretest probability of moderate to severe OSA. The latter conclusion is based on the null finding using AHI in approximately half of patients pre-screened as “anything but” high pretest probability of OSA. This study also supports that empirical screening for OSA should always be done in conjunction with a comprehensive sleep evaluation as no screening instrument is “perfect.” This conclusion is based on the finding that several patients had test results indicative of OSA despite being at “low or no risk for OSA” using the ARES screening questionnaire (Appendix) and vice versa. For example, it is possible that a provider may have observed risk factors for OSA that are not assessed in the screener, for example, a low hanging soft palate, craniofacial risk factors, etc. The finding that patients with a history of insomnia, stroke, and lung disease were 20% to 30% more likely to have incongruent test results compared to pretest screening highlight the need for studies evaluating the accuracy of PR in patients with “more complicated” OSA. In the meantime, however, said patients may be most appropriately evaluated in a comprehensive fashion by a physician trained in sleep medicine, especially if PR results are negative for OSA.
Data from this study highlight the need for gender-appropriate screening for OSA. This conclusion is based on data from this study as well as others9 that found that females may have a more delayed diagnosis, as they are likely to be older and more ill by the time they got tested for OSA. Females in this study were also more than twice as likely to have a negative test result despite being screened as high risk for OSA. This suggests that there may be different and/or differently-weighted factors that predict OSA in females compared to males.10 It could also mean that there are gender and/or gender × age related differences in how OSA manifests (e.g. de-saturation vs. arousal). It has been hypothesized that females may have different and age-dependent factors that contribute to the development of OSA and/or OSA symptoms. In general, females with OSA may be more likely than males to report symptoms of disturbed sleep (insomnia) and depressed mood11 rather than snoring and witnessed apneas.9 However, witnessed apneas, snoring, and sleepiness may become more prominent during the peri/postmenopausal period compared to earlier because of the effects of reduced progesterone on upper airway patency and adiposity.10,11 More data are needed on the utility of, for example, RDI as opposed to AHI in females, especially those of premenopausal age.
Conclusions drawn from this study must be made with limitations in mind. First, all medical history data were self-report in nature and may not align with practitioner-provided diagnoses. Second, these data were collected using one particular portable recording system and may not represent what occurs with other devices. Further data is needed on how “more subtle” respiratory events (flow limitation associated with autonomic arousals) impact long-term health outcomes. Finally, these data need to be underscored by the importance of appropriate treatment and treatment adherence as well as long-term disease management and health outcomes to maximize patient wellness.
DISCLOSURE STATEMENT
This study was funded by SleepMed, Inc. All authors are employed by SleepMed, Inc.
Appendix. SleepMed ARES Screening Questionnaire.

REFERENCES
- 1.Collop NA, Anderson WM, Boehlecke B, et al. Clinical guidelines for the use of unattended portable monitors in the diagnosis of obstructive sleep apnea in adult patients. J Clin Sleep Med. 2007;3:737–47. [PMC free article] [PubMed] [Google Scholar]
- 2.United Healthcare. Minnesota: 2013. Polysomnography and Portable Monitoring for Evaluation of Sleep Related Breathing Disorders: Medical Policy. [Google Scholar]
- 3.Aetna Clinical Policy Bulletin. Obstructive Sleep Apnea in Adults: Hartford; 2013. [Google Scholar]
- 4.Collop N. Home sleep testing: appropriate screening is the key. Sleep. 2012;35:1445–6. doi: 10.5665/sleep.2182. [DOI] [PMC free article] [PubMed] [Google Scholar]
- 5.Popovic D, Levendowski D, Ayappa I, et al. Accuracy of automated sleep staging using signals from a single forehead site. Sleep. 2008;31:A332. Abstract Suppl. [Google Scholar]
- 6.Ayappa N, Seelall V, Rapoport D. Validation of a self-applied unattended monitor for sleep disordered breathing. J Clin Sleep Med. 2008;4:26–37. [PMC free article] [PubMed] [Google Scholar]
- 7.Levondowski D, Olmstead R, Popovic D, et al. Assessment of obstructive sleep apnea risk and severity in truck drivers: validation of a screening questionnaire. Sleep Diagn Ther. 2007;2:20–6. [Google Scholar]
- 8.Wikipedia Commons. The United States Census Bureau Nine Regions Map. 2014. Retrieved from: http://en.wikipedia.org/wiki/File:US_9_regions.svg.
- 9.Quintana-Gallegoa E, Carmona-Bernala C, Capotea F, et al. Gender differences in obstructive sleep apnea syndrome: a clinical study of 1166 patients. Respir Med. 2004;98:984–9. doi: 10.1016/j.rmed.2004.03.002. [DOI] [PubMed] [Google Scholar]
- 10.Joffe H, Massler A, Sharkey K. Evaluation and management of sleep disturbance during the menopause transition. Semin Reprod Med. 2010;28:404–21. doi: 10.1055/s-0030-1262900. [DOI] [PMC free article] [PubMed] [Google Scholar]
- 11.Tantrakul V, Park S, Guilleminault C. Sleep-disordered breathing in premenopausal women: differences between younger (less than 30 years old) and older women. Sleep Med. 2012;13:656–62. doi: 10.1016/j.sleep.2012.02.008. [DOI] [PubMed] [Google Scholar]