Abstract
Summary
Cachexia is a wasting disorder of adipose and skeletal muscle tissues that leads to profound weight loss and frailty. About half of all cancer patients suffer from cachexia, which impairs quality of life, limits cancer therapy and decreases survival. One key characteristic of cachexia is elevated resting energy expenditure, which has been linked to increased brown fat thermogenesis1-6. How tumors induce brown fat activity is unknown. Here, using lewis lung carcinoma model of cancer cachexia, we show that tumor-derived PTHrP plays an important role in wasting by driving thermogenic gene expression in adipose tissues. Neutralization of PTHrP in tumor-bearing mice blocks adipose tissue browning and also loss of muscle mass and strength. Our results demonstrate that PTHrP mediates energy wasting in fat tissues and contributes to broader aspects of cancer cachexia. Thus, neutralization of PTHrP might hold promise for fighting cancer cachexia and improving patient survival.
Cachexia is a wasting disorder that accompanies many chronic diseases such as cancer and congestive heart failure. The hallmarks of cachexia are weight loss, with atrophy of fat and skeletal muscle7. Importantly, cachexia is more than just anorexia7-9. Cachectic patients may have reduced food intake, but they are in a state of negative energy balance that cannot be corrected by nutritional supplementation8,9. As a negative risk factor for cancer survival, cachexia causes frailty in patients and often prevents them from undergoing further therapies. While cachexia can improve with shrinkage of tumors, there is currently little effective therapy against cancer cachexia10,11.
The molecular basis of cachexia is poorly understood. Elevations of cytokines have been observed in cachectic patients but anti-cytokine therapies are ineffective10,11. Activation of brown fat has been described in rodent models of cachexia and in certain cachectic patients1-6. Brown fat dissipates chemical energy in the form of heat and hence, could be involved in the negative energy balance. How tumors induce thermogenesis in brown fat cells and how this might relate to the wasting of fat and skeletal muscle is unknown. In addition, white fat depots contain pockets of UCP1-expressing multilocular cells, called beige (or brite) cells, that can be stimulated upon cold exposure and other stimuli via a process termed browning. Recent studies have characterized beige cells at a molecular level12 and demonstrated a requirement for the transcriptional coregulator PRDM16 in the browning process13. To understand the molecular basis as to how tumors stimulate brown or beige cells, we used a murine model of lung cancer that is accompanied by cachexia.
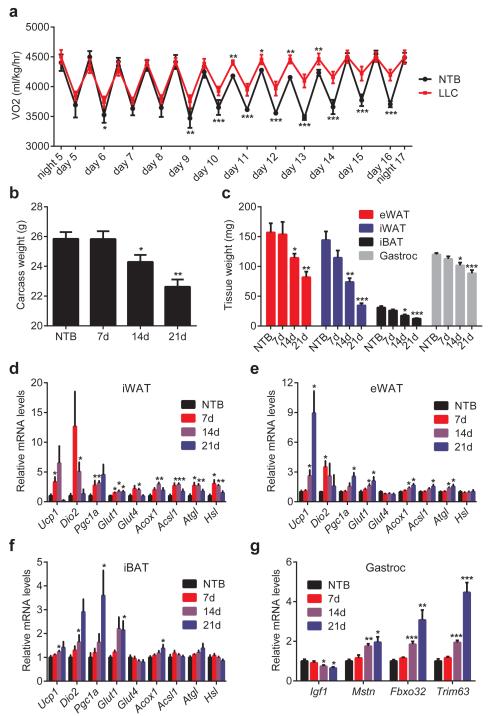
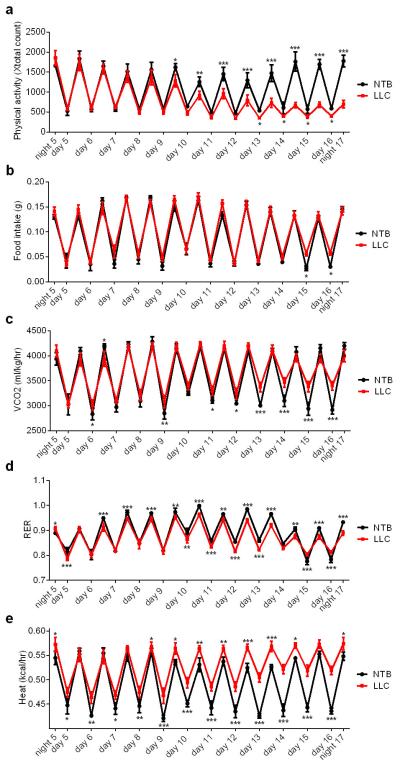
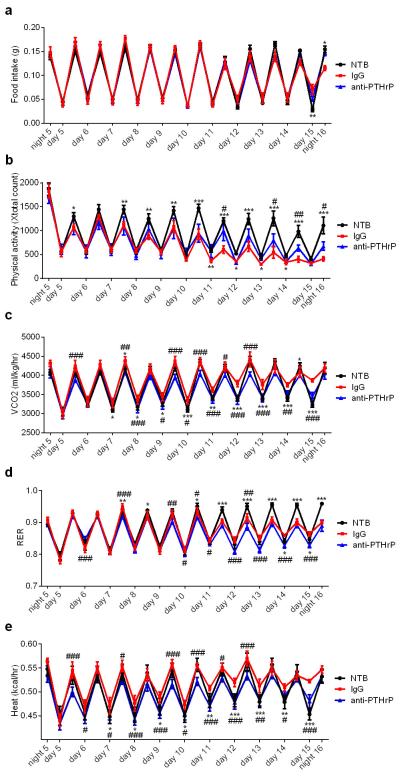
We utilized Lewis Lung Carcinoma (LLC) cells that readily form tumors and lead to cachexia in syngeneic C57BL/6 mice. LLC tumor-bearing mice demonstrated hypermetabolism; their rate of oxygen consumption was significantly elevated (Fig. 1a). However, this was not due to increased physical activity or reduced food intake (Extended Data Fig. 1a-b). Their CO2 production and lowered respiratory exchange ratio indicate fat as the preferred source of fuel (Extended Data Fig. 1c-d). Additionally, elevated heat production was observed in the cachectic mice.(Extended Data Fig. 1e). All tumor-bearing mice lost weight over the course of 3 weeks (Fig. 1b), including wasting of adipose tissues and skeletal muscle (Fig. 1c). The inguinal white adipose tissue (iWAT), a form of subcutaneous fat, wasted faster than epididymal fat (eWAT), a visceral fat depot. In response to tumor growth, both white fat depots and interscapular brown adipose tissue (iBAT) exhibited elevated expression of thermogenic genes Ucp1, Dio2 and Pgc1a. An increase in the expression of certain other genes of energy metabolism, including glucose transporters, β-oxidation and lipolytic enzymes14, was observed (Fig. 1d-f). LLC tumors also induced skeletal muscle expression of atrophy-related genes (Fig. 1g), including myostatin (Mstn), atrogin-1 (Fbxo32) and MuRF-1 (Trim63).
Figure 1. LLC tumors cause adipose tissue browning and cachexia.
Mice inoculated with LLC cells were monitored up to 21 days (n = 6 for each group). NTB stands for non-tumor-bearing. 4 days after inoculation, a cohort of mice (n = 6 and 9 for the NTB and LLC groups respectively) was placed into metabolic cages to measure O2 consumption (a). Carcass weight (calculated by subtracting tumor weight from the total weight) (b), weight of fat and muscle tissues (c) were measured. mRNA levels in iWAT (d), eWAT (e), iBAT (f) and gastrocnemius muscle (g) were determined by RT-qPCR. Values are means ± SEM. Statistics by two-tailed t-test. *P < 0.05, **P < 0.005, ***P < 0.0005 compared with the NTB group.
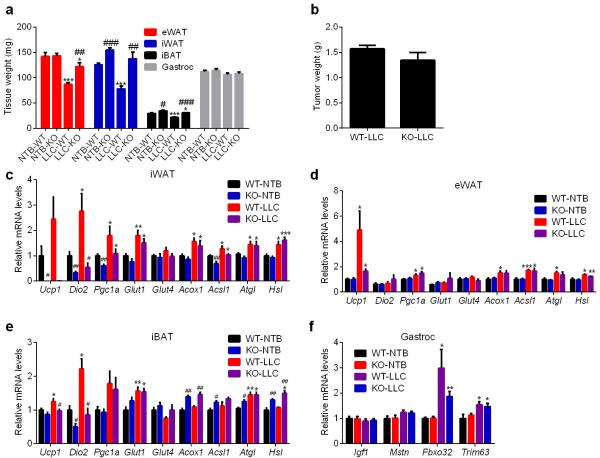
To examine the contribution of adipose tissue browning to cachexia, we used fat-specific Prdm16-deficient mice that have dramatically reduced thermogenic potential and are resistant to browning13. LLC tumor-induced adipose tissue wasting was significantly inhibited in Prdm16-knockout mice without a change in tumor size or the loss of muscle mass (Extended Data Fig. 2a-b). Cachexia-associated induction in expression of Ucp1 and Dio2 genes in the knockout mice was impaired while the increased expression of other genes of energy metabolism was unaffected (Extended Data Fig. 2c-f). These results imply a crucial role for the beige fat thermogenesis pathway in adipose tissue wasting.
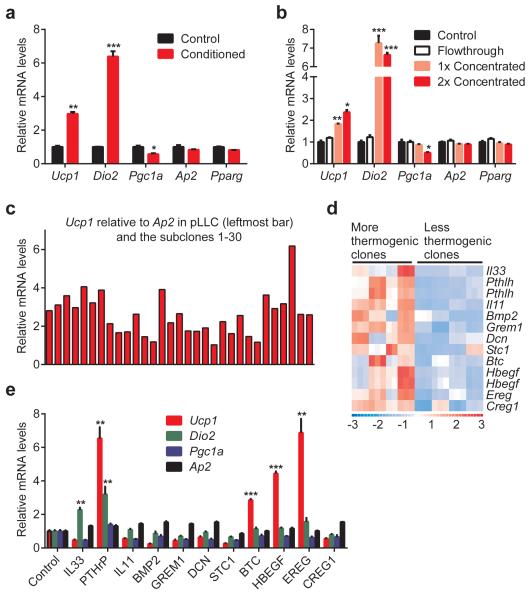
We examined whether LLC tumor-derived factors may induce thermogenic gene expression in fat tissues. Treatment of primary white adipose cells with the LLC cell-conditioned medium stimulated expression of Ucp1 and Dio2 (Fig. 2a). We then filtered the LLC cell-conditioned medium through a 3 kDa cut-off membrane and tested fractions on primary adipocytes. All of the thermogenic activity was retained in the filter concentrated fraction leaving none in the flow-through. This suggests that the thermogenesis-inducing activity most likely originates from a macromolecule (Fig. 2b).
Figure 2. LLC cell-conditioned medium stimulates thermogenic gene expression in fat cells.
a-c,ParentalLLC cells or the subclones were cultured in serum-free medium for 24 hr. Primary adipocytes (n = 3 in a and b) were treated for 24 hr with the LLC cell-conditioned media (a and c) orthe filtered fractions (b). d, Gene expression heat map of the secreted factors identified in the microarray analysis. e, Primary adipocytes were treated with the indicated proteins (1 μg/ml) for 24 hr (n = 3). mRNA levels were determined by RT-qPCR. Ap2 and Pparg are controls for adipocyte differentiation.Values are means ± SEM. Statistics by two-tailed t-test. *P < 0.05, **P < 0.005, ***P < 0.0005 compared with the control group.
To identify thermogenic factors, we used a combination of cell cloning and gene expression profiling. We first established single-cell clones from the heterogeneous LLC cells. Thirty subclones were generated and used to produce conditioned media, which were then tested on primary adipocytes. We obtained a range of Ucp1-inducing activity from these subclones (Fig. 2c) and chose eight clones that demonstrated either more or less thermogenic than the parental cells (Extended Data Fig. 3a). We analyzed global gene expression profiles of the subclones using microarrays and generated a list of secreted proteins that had higher mRNA levels in the more thermogenic subclones (Fig. 2d). When tested on primary adipocytes, several members of the epidermal growth factor (EGF) family (Extended Data Fig. 3b) including betacellulin (BTC), heparin binding-EGF (HBEGF) and epiregulin (EREG), as well as parathyroid hormone-related protein (PTHrP) (encoded by the Pthlh gene) induced Ucp1 expression (Fig. 2e).
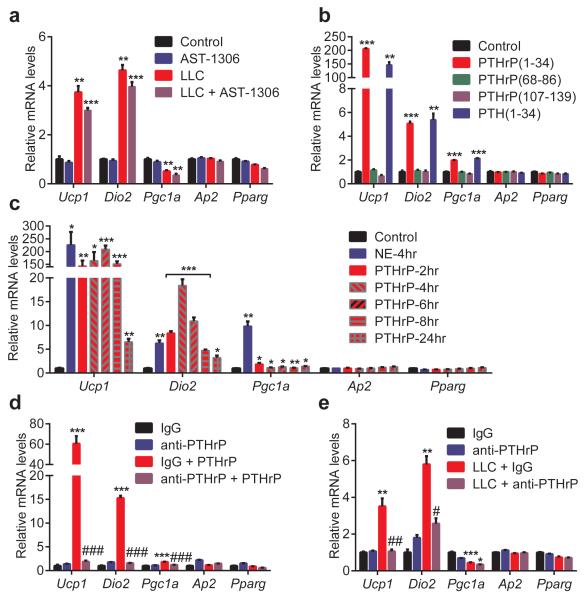
To determine the contribution of BTC, EREG and HBEGF to the Ucp1–inducing activity found in LLC cell-conditioned medium, we used an inhibitor of EGF receptor (EGFR) signaling. Since the three EGF family proteins signal through EGFR and Erbb4, we tested AST-1306, a specific protein kinase inhibitor targeting both receptors, on primary adipocytes. AST-1306 completely blocked Ucp1 mRNA induction when fat cells were treated in combination with BTC, EREG or HBEGF (Extended Data Fig. 3c). In contrast, the browning activity present in LLC cell-conditioned medium was largely unaffected by AST-1306 treatment, suggesting that these EGF family proteins are not playing a major quantitative role here (Fig. 3a).
Figure 3. PTHrP is responsible for most of the LLC cell-derived browning activity.
a-c, Primary adipocytes (n = 3 for each group) were treated with AST-1306 (1 μM) and LLC cell-conditioned medium for 24 hr (a) or with the indicated peptides (100 ng/ml) for 2 hr (b) or with PTHrP at 100 ng/ml for 2-24 hr and NE (100 nM) for 4 hr (c). d-e, Primary adipocytes (n = 3 for each group) were treated with IgG or anti-PTHrP (10 μg/ml) along with PTHrP (10 ng/ml) for 4 hr (d) or with LLC cell-conditioned medium for 24 hr (e). mRNA levels were measured by RT-qPCR. Values are means ± SEM. Statistics by two-tailed t-test. (*) refers to differences compared to the control or IgG groups. (#) refers to differences between the PTHrP groups or the LLC groups. *P < 0.05, **P < 0.005, ***P < 0.0005, #P < 0.05, ##P < 0.005, ###P < 0.0005.
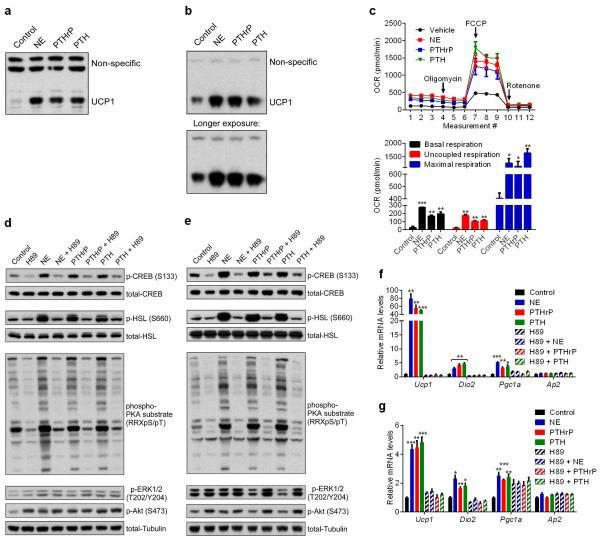
PTHrP is processed into at least three different peptide products. We treated primary white and brown adipocytes with these peptides and also parathyroid hormone (PTH-1-34), which shares sequence and structural similarity with PTHrP(1-34). Both PTH(1-34) and PTHrP(1-34), which signal through the same receptor (PTH/PTHrP receptor; PTHR), stimulated thermogenic gene expression (Fig. 3b and Extended Data Fig. 3d). For simplicity, hereafter 1-34 peptides will be referred to as just PTHrP and PTH. Time-course and dose response analysis of PTHrP treatment revealed that this peptide potently induces Ucp1 and Dio2 mRNAs (up to 200 and 20 fold respectively), comparable to norepinephrine, the classic thermogenic catecholamine produced by the sympathetic nervous system (Fig. 3c and Extended Data Fig. 4). We next investigated how PTHrP affects UCP1 protein levels and uncoupled respiration. Primary white and brown adipocytes were treated with norepinephrine (NE), PTHrP or PTH. Remarkably, all three factors increased UCP1 protein comparably and also significantly raised O2 consumption, including basal, uncoupled and maximal respiration (Extended Data Fig. 5a-c). These results show that the PTH/PTHrP pathway can be a very robust regulator of cellular respiration.
PTHR is a G protein-coupled receptor (GPCR) that activates the PKA pathway15. NE also signals through β-adrenergic receptors that are GPCRs and induce PKA signaling to promote thermogenic gene expression. Treatment of primary white and brown adipocytes with NE, PTHrP or PTH stimulated phosphorylation of the PKA substrates CREB and HSL. A selective PKA inhibitor, H89, blocked PKA signaling, which also completely inhibited transcriptional regulation by all three factors (Extended Data Fig. 5d-g). These results strongly suggest that both PTHrP and PTH require the PKA pathway to mediate their effects on Ucp1 and Dio2 transcription and therefore share a common signaling mechanism with the β-adrenergic pathway.
Next, a neutralizing antibody against PTHrP was used to investigate if PTHrP is involved in LLC cell-induced thermogenic gene expression. This antibody was capable of completely inhibiting PTHrP activity, when added onto adipocytes (Fig. 3d). Importantly, when adipocytes were treated with LLC cell-conditioned medium in combination with the anti-PTHrP, Ucp1 and Dio2 induction was almost completely blocked (Fig. 3e). These data indicate that PTHrP is a major component of the LLC cell-secreted material causing browning of cultured adipocytes.
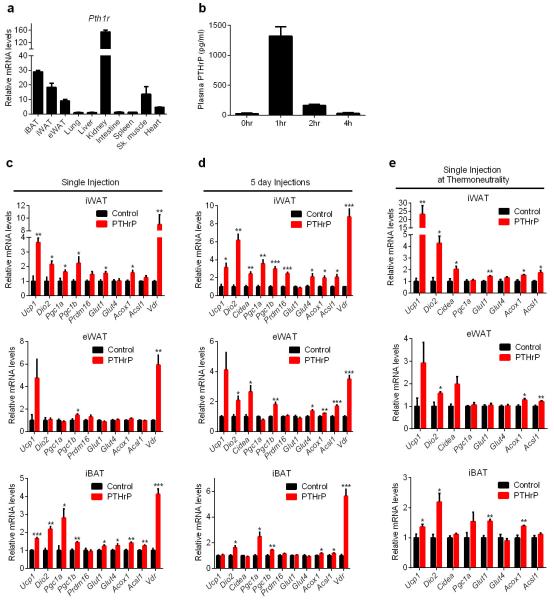
PTHR (encoded by Pth1r) is known to be highly expressed in kidney and bone15. Notably, rather high mRNA expression was also observed in adipose and muscle tissues (Extended Data Fig. 6a). We next investigated PTHrP-dependent transcriptional regulation in vivo. PTHrP potently promoted expression of thermogenic genes and certain other genes of energy metabolism (Extended Data Fig. 6b-e), a pattern notably similar to browning of adipose tissues by LLC tumors.
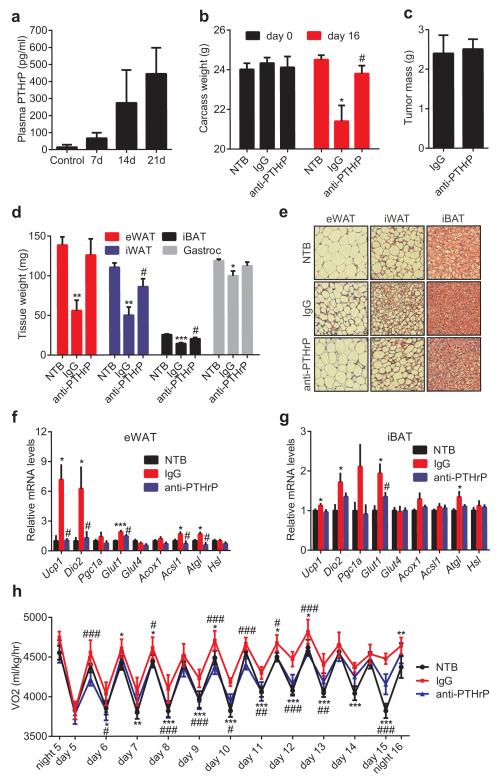
The role played by PTHrP in LLC tumor-caused fat browning and wasting was then investigated. Up to 500 pg/ml plasma PTHrP was detected in the tumor-bearing mice (Fig. 4a). We next injected mice with the neutralizing antibody against PTHrP or control IgG. Amazingly, anti-PTHrP-treated mice did not suffer significant weight loss while the IgG-treated group displayed evident cachexia (Fig. 4b). Anti-PTHrP treatment blocked both adipose tissue and skeletal muscle wasting without changing average tumor mass (Fig. 4c-d). Histological examination of adipose tissues showed that anti-PTHrP treatment prevented shrinking of fat droplets (Fig. 4e). Neutralization of PTHrP also blocked thermogenic gene expression in eWAT, iBAT (Fig. 4f-g) and iWAT (Extended Data Fig. 7), implicating a causal role for thermogenesis in fat wasting. Treatment with anti-PTHrP also lowered O2 consumption of the cachectic mice, improved physical activity and reduced heat production (Fig. 4h and Extended Data Fig. 8). We used a clark electrode to test ex vivo O2 consumption of fat and skeletal muscle tissues. Noting the limited power of this technique to measure and represent actual tissue respiration, we demonstrated modest increases in the fat tissue respiration of the cachectic mice. These increases were suppressed by the anti-PTHrP treatment (Extended Data Fig. 9).While additional off-target effects of the PTHrP antibodies can never be ruled out, these data reveal a major role for PTHrP in LLC tumor-induced adipose tissue thermogenesis and hypermetabolism.
Figure 4. Neutralization of PTHrP prevents tumor-induced adipose tissue browning.
a, Plasma PTHrP levels in mice bearing LLC tumors up to 21 days (n = 6). b-g, Mice inoculated with LLC cells received IgG or anti-PTHrP (10 mg/kg body weight) every 3 days from day 6 to day 15 and were sacrificed at day 16 (n = 4, 5 and 6 for the NTB, IgG and anti-PTHrP groups respectively). Carcass weight (b), weight of tumors (c), fat and muscle tissues (d) and H&E staining of adipose tissues were shown (e). mRNA levels in eWAT (f) and iBAT (g) were measured by RT-qPCR. h, Mice were treated similarly to b-g except that they were placed into metabolic cages at day 4 to measure O2 consumption (n = 6 for the NTB group and 5 for the other groups). Values are means ± SEM. Statistics by two-tailed t-test. (*) compares the NTB and IgG groups. (#) refers to differences between the IgG and anti-PTHrP groups. *P < 0.05, **P < 0.005, ***P < 0.0005, #P < 0.05, ##P < 0.005, ###P < 0.0005.
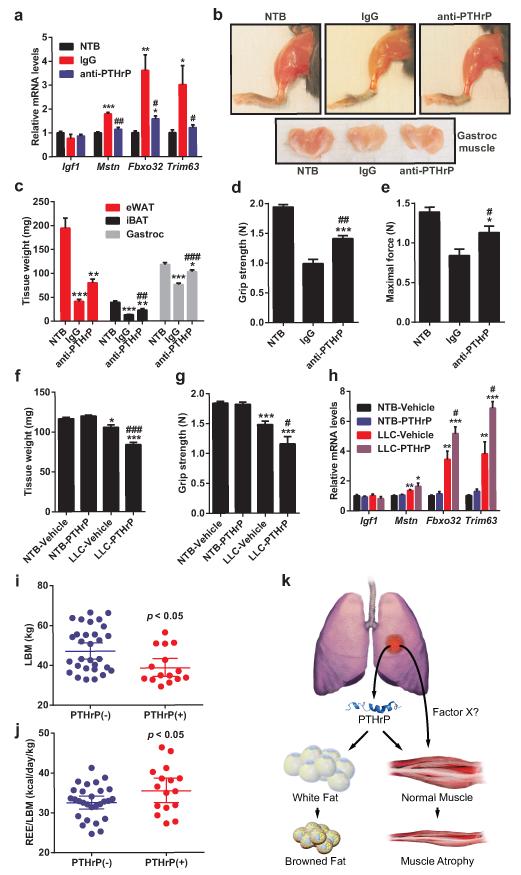
Neutralization of PTHrP also impaired LLC tumor-induced muscle wasting (Fig. 4d), atrophy of muscle fibers (Extended Data Fig. 10a) and atrophy-related gene expression (Fig. 5a). We further investigated this effect by treating mice with anti-PTHrP until severe cachexia was observed in controls. The anti-PTHrP treatment preserved muscle mass to a significant extent (Fig. 5b-c).
Figure 5. PTHrP is associated with wasting of lean body mass in cachectic mice and humans.
a, mRNA levels in gastrocnemius muscle from the experiment described in Fig. 4b-g. b-e, Mice inoculated with LLC cells received IgG or anti-PTHrP (10 mg/kg body weight) every 3 days from day 6 to day 21-22 (n = 5 for the anti-PTHrP group and 6 for the other groups). Representative images of hindlimb and gastrocnemius muscles are shown (b). Fat and muscle tissues were weighed (c). Muscle function was analyzed by grip strength (d) and in situ contraction (e). f-h, Mice inoculated with LLC cells were sacrificed after receiving daily injections of PTHrP (1 mg/kg body weight) between days 10-16 (n = 5 for the LLC-Vehicle group and 6 for the other groups). Gastrocnemius muscle weight (f) and grip strength (g) were measured. mRNA levels in gastrocnemius muscle were determined by RT-qPCR (h). i-j, LBMand REE/LBM of the PTHrP(+) and PTHrP(−) patients were compared. k. A model for PTHrP action in cancer cachexia. Values are means ± SEM. Statistics by two-tailed t-test. (*) refers to differences compared to the NTB groups. (#) refers to differences between either the IgG and anti-PTHrP groups or the LLC-Vehicle and LLC-PTHrP groups. *P < 0.05, **P < 0.005, ***P < 0.0005, #P < 0.05, ##P < 0.005, ###P < 0.0005.
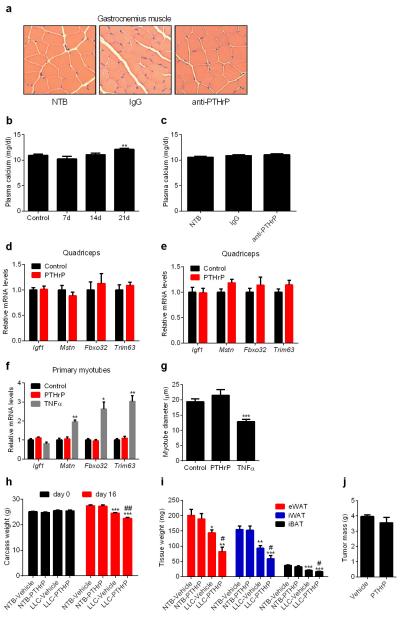
This was also reflected in muscle function, as evidenced by improved grip strength and in situ muscle contraction (Fig. 5d-e). While it was possible that PTHrP-associated hypercalcemia may have confounding effects here, we did not observe hypercalcemia in the LLC model, and neutralization of PTHrP did not affect circulating calcium levels (Extended Data Fig. 10b-c).
PTHrP injection into healthy mice failed to affect expression of muscle atrophy-associated genes (Extended Data Fig. 10d-e). Furthermore, PTHrP treatment of primary myotubes did not change expression of these genes or myotube diameter (Extended Data Fig. 10f-g), suggesting that PTHrP does not directly induce skeletal muscle atrophy. We investigated this further by injecting PTHrP into tumor-bearing mice. Remarkably, PTHrP administration exacerbated cachexia-associated weight loss without changing tumor mass (Extended Data Fig. 10h-j). PTHrP treatment led to more severe skeletal muscle wasting, poorer muscle function and significantly promoted expression of muscle atrophy-related genes in the cachectic mice (Fig. 5f-h). These findings indicate that PTHrP is required for loss of muscle mass and function in the LLC model. However, it probably does not act alone and likely collaborates with other tumor-derived factors.
Lastly, we investigated PTHrP expression in a cohort of patients diagnosed with metastatic non-small cell lung cancer or colorectal cancer, whose body composition and metabolic rate were studied in the context of a clinical investigation of the etiology of cancer cachexia16-18. 17 out of 47 patients displayed detectable levels of blood PTHrP (205 ± 155 pg/ml) with no medical history of hypercalcemia. These patients had significantly lower lean body mass (LBM) and significantly higher resting energy expenditure (REE) per kg of LBM, compared to the 30 patients lacking detectable levels of PTHrP (Fig. 5i-j). The reduced lean tissue in the PTHrP(+) patients was not associated with a difference in dietary intake (PTHrP(+): 2364 ± 750 vs PTHrP(−): 2285 ± 487 kcal/day; p < 0.66) or inflammation as determined by plasma C-reactive protein levels (PTHrP(+): 5.7 ± 4.7 vs PTHrP(−): 12.6 ± 27 mg/L; p < 0.32) (Supplementary Information). These results indicate an association between PTHrP and a greater degree of lean tissue wasting and elevated energy expenditure within this cohort of patients.
Secreted from many tumors, PTHrP is often involved in the hypercalcemia that accompanies certain cancers19. PTHrP was previously linked to cachexia associated with hypercalcemia of malignancy20-22. However, its direct roles in the muscle wasting process and the browning of adipose tissues have not been reported. Taken together our data show that PTHrP is the major LLC tumor-derived factor stimulating adipose tissue thermogenic gene expression and hypermetabolism. Neutralization of PTHrP blocks both the browning and wasting of fat depots and the much of the muscle wasting and weakness in this model of cachexia.
These data suggest a model whereby PTHrP functions alone to drive the thermogenic/browning program in adipose tissues but is likely to collaborate with other tumor-derived molecules to bring about the profound muscle wasting and weakness observed in the LLC model (Fig. 5k). The identity of such collaborating factors is unknown. The browning driven by PTHrP seems not to be obligatorily linked to the muscle wasting process.
Our preliminary evaluation of 47 cancer patients identified a PTHrP(+) subset, which showed features of reduced lean body mass and increased energy expenditure. Further prospective studies on cachexia prone patients should test these parameters with serial tissue biopsies to demonstrate a specific association between PTHrP, adipose tissue browning and metabolic rate in clinical cancer cachexia. If PTHrP is involved in cachexia in certain patients, it should be possible to identify those with elevated PTHrP. A humanized antibody against PTHrP might have anti-cachectic effects like those shown here. It will be interesting to determine if elevated PTHrP or PTH plays any roles in the cachexia associated with certain other diseases, like congestive heart failure or chronic kidney diseases.
Methods
Materials
All recombinant proteins used in this study were purchased from R&D Systems, except STC1 (BioVendor) and TNFα (Sigma). Synthetic PTHrP and PTH peptides, PTHrP(1-34) ELISA assay (S-1227) and anti-PTHrP(1-34) (T-4512) antibody were purchased from Bachem. Normal rabbit IgG (Santa Cruz; sc-2027 and R&D Systems; AB-105-C) was used as control for anti-PTHrP. All of other antibodies were purchased from Cell Signaling, including total-HSL (#4107), p-HSL (#4126), total-CREB (#9197), p-CREB (#9198), phospho-PKA substrate (#9624), p-Akt (#4060) and p-ERK1/2 (#9101), except anti-Ucp1 (Abcam; ab10983) and anti-tubulin (Santa Cruz; sc-9935). Norepinephrine and AST-1306 were from Sigma and Tocris respectively.
Animals
All animal experiments were approved by the Institutional Animal Care and Use Committee of the Beth Israel Deaconess Medical Center. Mice (Mus musculus) were maintained in 12 hour light/dark cycles (6am-6pm) at 24°C and fed standard irradiated rodent chow diet. Prdm16-floxed mice (± Adiponectin-Cre) were maintained on a pure C57BL/6 background. All other animals were lean C57BL/6 mice obtained from Charles River Laboratories. 6-10 weeks old male mice were used in all animal experiments. Sample size, determined empirically via performing preliminary experiments, was chosen to be at least 4 to ensure that adequate statistical power will be achieved. Mice were divided into treatment groups randomly while satisfying the criteria that average body weight in each group will be about the same. Treatment groups were clearly marked to avoid mistakes (no blinding). 5 million LLC cells per mouse were injected subcutaneously over the flank. Non-tumor-bearing control mice received the vehicle (PBS) only. Mice received intraperitoneal injections of IgG and anti-PTHrP antibodies and subcutaneous injections of the PTHrP peptide. Non-tumor-bearing mice received control IgG or the vehicle (PBS). All mice were sacrificed in late light cycle (3-6pm). Mice were housed individually in all tumor inoculation experiments and in groups in other experiments. Plasma was collected into EDTA tubes for the PTHrP(1-34) ELISA assay. Peptide-free rat serum (Bachem) was used as standard diluent to correct for background reading in mouse plasma samples. Heparin tubes were used to collect plasma for calcium measurements, which were performed with a Vitros analyzer. Whole-body energy metabolism was evaluated using a Comprehensive Lab Animal Monitoring System (CLAMS, Columbia Instruments). CO2 and O2 data were collected every 32 minutes for each mouse and were normalized to total body weight. Data on activity, heat generation and food intake were measured at more frequent intervals. For hematoxylin and eosin staining, adipose tissues were fixed in 4% formaldehyde, embedded in paraffin, and cut into 6 μm sections on slides.
Primary white adipocyte culture
Inguinal stroma-vascular (SV) fractions were obtained from 30-35 days-old male mice by the following procedure. Inguinal fat tissue was dissected, washed with PBS, minced and digested for 45 min at 37°C in PBS containing 10 mM CaCl, 2.4 U/mL dispase II (Roche), and 1.5 U/mL collagenase D (Roche). Digested tissue was filtered through a 100-μm cell strainer and centrifuged at 600g for 5 min to pellet the SV cells. These were then resuspended in adipocyte culture medium (DMEM/F12(1:1; Invitrogen) plus glutamax, pen/strep, and 10% FBS), filtered through a 40-μm cell strainer, centrifuged as above, resuspended in adipocyte culture medium and plated. The SV cells were grown to confluency for adipocyte differentiation, which was induced by the adipogenic cocktail containing 1 μM dexamethasone, 5 μg/mL insulin, 0.5 μM isobutylmethylxanthine (DMI), and 1 μM rosiglitazone in adipocyte culture medium. 2 days after induction, cells were maintained in adipocyte culture medium containing 5 μg/mL insulin and 1 μM rosiglitazone. Starting at day 6, cells were maintained in adipocyte culture medium only and treated with various molecules for 2-24 hours and harvested at day 8.
Primary brown adipocyte culture
Interscapular brown fat pads were dissected from newborn mice (postnatal days 2–4), minced, and digested for 45 min at 37°C in an isolation buffer containing 123 mM NaCl, 5 mM KCl, 1.3 mM CaCl2, 5.0 mM glucose, 100 mM HEPES, 4% BSA, 1.5 mg/mL collagenase B (Roche). Digested tissue was filtered through a 100-μm cell strainer, centrifuged at 600g for 10 min. Pelleted SV cells were resuspended in complete adipocyte culture medium (described above) and plated. SV cells were grown to confluency for adipocyte differentiation, which was induced by the adipogenic cocktail containing 5 μM dexamethasone, 0.02 μM insulin, 0.5 μM isobutylmethylxanthine, 1 nM T3, 125 μM indomethacin, and 1 μM rosiglitazone in adipocyte culture medium. 2 days after induction, cells were maintained in adipocyte culture medium containing 0.02 μM insulin, 1 nM T3 and 1 μM rosiglitazone. Starting at day 4, cells were maintained in adipocyte culture medium only and treated with various molecules for 2-24 hours and harvested at day 8.
LLC cell culture and conditioned medium preparation
LLC cells were maintained in DMEM (Invitrogen) with 10% FBS and pen/strep. For conditioned medium collection, cells were plated at 1/3 confluency. The following day, medium was changed to FreeStyle expression medium (Invitrogen), which was then collected 24 hours later. For fractionation of expression medium, LLC cell-conditioned medium was filtered using a 3 kilodalton (Kd) cut-off filter (Millipore). Adipocytes were treated with conditioned medium for 24 hours starting 7 days post-differentiation protocol. When adipocytes were treated with conditioned medium, the treatment medium was composed of 50% fresh adipocyte culture medium and 50% LLC cell-conditioned medium. When conditioned medium was filtered and concentrated, adipocytes were exposed to 90% adipocyte culture medium and 10% concentrated LLC cell-conditioned medium. For the analysis of global gene expression, LLC subclones were cultured in FreeStyle expression medium for 24 hr. RNA was extracted using TRIzol (Invitrogen), purified with Qiagen RNeasy minicolumns. Affymetrix mouse genome 430A v2.0 arrays were used to generate expression profile data which was analyzed using dChip software. The GEO accession number for the microarray dataset is GSE57797.
Gene expression analysis (RT-qPCR)
RNA was extracted from cultured cells or frozen tissue samples using TRIzol (Invitrogen), purified with Qiagen RNeasy minicolumns and reverse transcribed using High Capacity cDNA Reverse Transcription kit (Applied Biosystems). Resulting cDNA was analyzed by RT-qPCR. Briefly, 25 ng of cDNA and 150 nmol of each primer were mixed with SYBR® GreenER™ PCR Master Mix (Invitrogen). Reactions were performed in 384-well format using an ABI PRISM® 7900HT instrument (Applied Biosystems). Relative mRNA levels were calculated using the comparative CT method normalized to cyclophilin mRNA.
Western blotting
Cells were homogenized in a lysis buffer containing 50 mM Tris (pH 7.4), 500 mM NaCl, 1% NP40, 20% glycerol, 5 mM EDTA and 1 mM PMSF, supplemented with protease and phosphatase inhibitor cocktails (Roche). The homogenates were centrifuged at 13,000 rpm for 10 min and the supernatants were used as whole cell lysates. Protein concentration was determined by Bio-Rad Protein assay and 50 μg of protein lysate was used in each SDS-PAGE run. PVDF membrane was blotted with antibodies in TBS containing 0.05% Tween and 5% BSA. For secondary antibody incubation, TBS-T containing 5% milk was used. ECL western blotting substrates from Pierce were used for visualization of the results.
Respiration assays
Cellular oxygen consumption rate (OCR) of primary adipocytes was determined using an XF24 Extracellular Flux Analyzer (Seahorse Bioscience). Primary adipocytes were cultured and differentiated in XF24 microplates and treated with NE, PTHrP or PTH 7 days post differentiation. 24 hr later, adipocyte culture medium was changed to DMEM medium lacking NaHCO3 but containing 10 mM glucose, 1 mM pyruvate and the treatment chemicals. Uncoupled and maximal OCR was determined using Oligomycin and FCCP (1 μM each), respectively. Complex I-dependent respiration was inhibited with Rotenone (3 μM). Ex vivo tissue respiration was measured using a Clark electrode (Strathkelvin Instruments) as described previously13. Freshly isolated tissues were briefly minced and transferred into the electrode chamber containing a respiration buffer which consists of 1× DPBS, 2% BSA, 25 mM glucose and 1 mM pyruvate. O2 consumption values were normalized to tissue weight.
Grip strength
Forelimb grip strength was assessed on the same day as sacrifice23. Each mouse was allowed to grab a bar attached to a force transducer as it was pulled by the tail horizontally away from the bar (Model DFX II; Chatillon). Five repetitions with a 30-s pause between each were averaged to determine grip strength for each mouse.
In situ muscle force measurements
In situ force was measured as described previously24. Briefly, mice were anesthetized with a subcutaneous injection of ketamine/xylazine/acepromazine (1.4 ml/kg BW) cocktail. The distal tendon of the gastrocnemius muscle was cut just before the insertion at the ankle. The tendon was tied with a 4.0 nylon suture and attached to an isometric transducer. The sciatic nerve was exposed with an incision in hamstring region. The sciatic nerve was then cut as close to the hip bone as possible and dissected from surrounding fascia. The exposed sciatic nerve was then laid over two electrodes with a small piece of parafilm placed under suspended nerve to prevent contact with other tissue. The nerve was kept moist with periodic treatment of mineral oil. The nerve was stimulated using a supra maximal square-wave pulse of 0.1 ms duration. Measurements were made at the length at which maximal tension was obtained during the twitch (Lo). Data was recorded for maximal (Po; stimulation frequency of 75-150 Hz) isometric force.
Primary myoblast culture
Primary myoblasts were isolated from male mice <14 days old and cultured in Ham’s F-10 nutrient mixture (Irvine Scientific) with 20% FBS (Gemini Bio-Products) supplemented with 2.5 ng/ml basic fibroblast growth factor (bFGF) (Promega), penicillin G (200 U/ml) and streptomycin (200 mg/ml). Myoblasts were then transferred to differentiation DMEM media with 5% horse serum until mature myotube formation (~48-72hrs) and then treated with PTHrP or TNFα. The diameters of individual myotubes were measured using Image J software.
Human Study
This is a further analysis of a study designed to investigate the metabolic, nutritional, and functional profile of a cohort of patients recently diagnosed with advanced non-small cell (NSC) lung cancer (stages IIIB or IV) or colorectal cancer (stage IV) (n=47)16-18 Inclusion criteria and measures have been described elsewhere16-18. Patients were recruited from the Cross Cancer Institute, a cancer treatment center serving Edmonton and Northern Alberta, Canada. The study was approved by the Alberta Cancer Board Research Ethics Board and all participants provided written informed consent. Patients with advanced lung or colorectal cancers were included in the study because of their greater susceptibility to weight loss and cachexia associated with cancer. All participants were under the direct care of a medical oncologist and received standard chemotherapy for their disease and stage. None of the patients were receiving medications with the intent of managing cachexia such as corticosteroids, progestational agents or cannabinoids.
Participants were asked to fast for 12 hr and to refrain from strenuous exercise and alcohol for 24 hr prior to assessments, which included body composition, resting energy expenditure (REE) and a blood sample. PTHrP(1-34) ELISA assay was used to determine blood PTHrP. Serum samples collected from normal subjects were used to set baseline for measuring blood PTHrP. Serum PTHrP measurements were performed in a blinded fashion. REE measurement was by indirect calorimetry (VMax 29N; Sensor- Medics, Yorba Linda, CA) as described16. Participants rested for 30 min, after which a canopy was placed over their head and shoulders for 30 min to analyze oxygen consumption and carbon dioxide production. Breath samples were measured until a steady state was reached for 15 min. The Weir equation was used to calculate REE. On the same morning as the REE assessment, all participants also underwent a dual-energy X-ray absorptiometry (DXA) scan (LUNAR Prodigy High Speed Digital Fan Beam X-Ray-Based Densitometer with enCORE 9.20 software; General Electric, Madison, WI) to measure whole-body fat mass and fat-free mass17. Blood samples drawn for C-reactive protein assessment were taken and analyzed in the hospital clinical laboratory. Three-day diet records (detailing intake for three consecutive days, including one weekend day) were used to assess total energy intake and meal patterns. Records were reviewed for accuracy and completeness. Three-day dietary records provide accurate mean estimates of group dietary intake in patients with advanced cancer18.
Statistical analysis
For every experiment, sample size was determined empirically (preliminary experiments were performed) to ensure that desired statistical power can be achieved. Values are expressed as mean ± SEM. Error bars (SEM) shown in all results were derived from biological replicates, not technical replicates. Significant differences between two groups were evaluated using two-tailed, unpaired t-test, which was found to be appropriate for the statistics as the sample groups displayed normal distribution and comparable variance.
Extended Data
Extended Data Figure 1. Effects of LLC tumors on whole-body metabolism, food intake and physical activity.
Mice inoculated with LLC cells (n = 6 and 9 for the NTB and LLC groups respectively) were placed into metabolic cages at day 4. Physical activity (a), food intake (b) CO2 production (c), respiratory exchange ratio (RER) (d), and heat output (e) were monitored. Values are means ± SEM. Statistics by two-tailed t-test. *P < 0.05, **P < 0.005, ***P < 0.0005.
Extended Data Figure 2. Fat-specific Prdm16-deficient mice are resistant to LLC tumor-induced adipose tissue browning and wasting.
Wild-type (WT) and Prdm16-knockout (KO) mice inoculated with LLC cells were sacrificed at day 11 (n = 5 for the KO-LLC group and 6 for the other groups). Tissue weight (a) and tumor weight (b) were measured. Gene expression changes in iWAT (c), eWAT (d), iBAT (e) and gastrocnemius muscle (f) were determined by RT-qPCR. Values are means ± SEM. Statistics by two-tailed t-test. (*) refers to differences between the NTB and LLC groups. (#) refers to differences between the WT and KO groups. *P < 0.05, **P < 0.005, ***P < 0.0005, #P < 0.05, ##P < 0.005, ###P < 0.0005.
Extended Data Figure 3. Media conditioned by LLC sublones, EGF proteins and PTHrP/PTH (1-34) peptides stimulate Ucp1 and Dio2 expression in adipocytes.
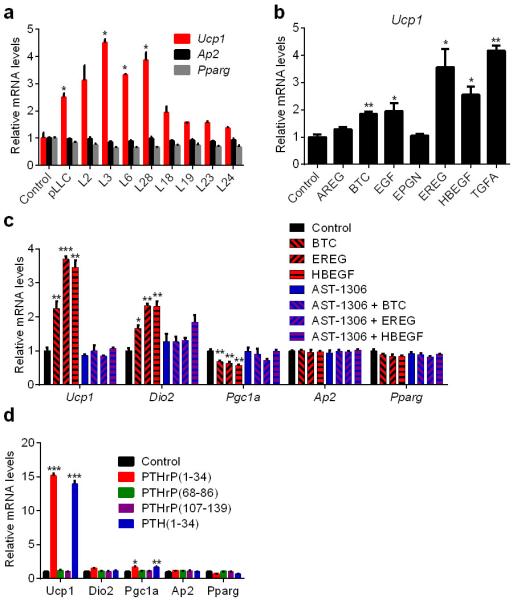
a, ParentalLLC (pLLC) cells or the subclones were cultured in serum-free medium for 24 hr. Primary adipocytes were treated for 24 hr with the LLC cell-conditioned media (n = 3). b, Primary adipocytes were treated with soluble EGF domains of EGF family proteins (100 ng/ml) for 24 hr (n = 3). c, Primary adipocytes were treated with AST-1306 (1 μM) and BTC, EREG or HBEGF (100 ng/ml) for 24 hr (n = 3). d, Primary brown adipocytes were treated with PTHrP or PTH peptides (100 ng/ml) for 2 hr (n = 3). mRNA levels were determined by RT-qPCR.Values are means ± SEM. Statistics by two-tailed t-test. *P < 0.05, **P < 0.005, ***P < 0.0005 compared with the control group.
Extended Data Figure 4. Time course and dose response PTHrP treatments of primary white and brown adipocytes.
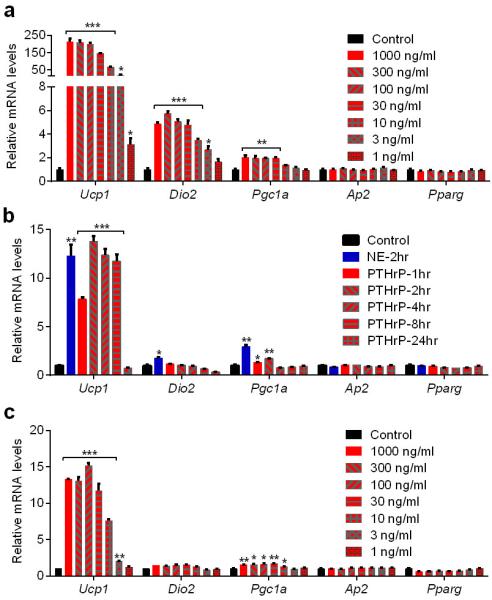
a, Primary white adipocytes were treated with PTHrP at various doses for 2hr (n = 3). b, Primary brown adipocytes were treated with PTHrP at 100 ng/ml for 2-24 hr or with Norepinephrine (NE; 100 nM) for 2 hr (n = 3). c, Primary brown adipocytes were treated with PTHrP at various doses for 2hr (n = 3). mRNA levels were measured by RT-qPCR. n = 3. Values are means ± SEM. Statistics by two-tailed t-test. *P < 0.05, **P < 0.005, ***P < 0.0005 compared with the control group.
Extended Data Figure 5. PTHrP stimulates cellular respiration and acts via the PKA signaling system.
a-b, Primary adipocytes were treated with NE (100 nM), PTHrP or PTH (100 ng/ml each) for 24 hr and UCP1 protein levels were measured by western blotting in white (a) and brown (b) adipocytes. c, Oxygen Consumption Rate (OCR) of primary white adipocytes, including basal respiration, uncoupled respiration (by blocking ATP Synthase with oligomycin), maximal respiration (by stimulating uncoupling with FCCP) and non-mitochondrial respiration (with rotenone) was determined using SeaHorse metabolic analyzer. Real-time triplicate readings (upper panel) and their averages (lower panel) were shown (n = 4). d-g, Primary adipocytes were serum-starved for 2 hr and pretreated with H89 (50 μM for white adipocytes and 30 μM for brown adipocytes) for 1 hr and then NE (100 nM), PTHrP or PTH (100 ng/ml each) were added for 30 min to analyze protein phosphorylation by western blotting in white (d) and brown adipocytes(e) or for 2hr to test gene expression by RT-qPCR (n = 3) in white (f) and brown adipocytes (g). Values are means ± SEM. Statistics by two-tailed t test. *P < 0.05, **P < 0.005, ***P < 0.0005 compared with the control group.
Extended Data Figure 6. PTHrP induces thermogenic gene expression patterns in vivo.
a, Expression of Pth1r was tested in various tissues (n = 3). b, Plasma PTHrP levels were determined after subcutaneous injection of mice with 1mg PTHrP per kg body weight (n = 4). PTHrP (1-34) has a short half-life in the blood (less than 2 hours), however its tissue retention might be different. c-d, Mice (n = 5 for the control group and 7 for the PTHrP group) received a single dose (c) or 5 daily doses (d) of PTHrP (1 mg/kg body weight) and were sacrificed 2 hr after the final dose. e, Mice (n = 5 for the control group and 7 for the PTHrP group) were transferred to thermoneutrality (30°C) and after two days of acclimation they received a single dose of PTHrP (1 mg/kg body weight) and were sacrificed 4 hr later. More pronounced effects were observed at thermoneutrality, a condition under which basal thermogenic gene expression is diminished. Gene expression changes were measured by RT-qPCR in different fat depots. Vdr was identified as a robust mRNA target of PTHrP and included as a positive control. Values are means ± SEM. Statistics by two-tailed t-test. *P < 0.05, **P < 0.005, ***P < 0.0005.
Extended Data Figure 7. Neutralization of PTHrP prevents tumor-induced adipose tissue browning.
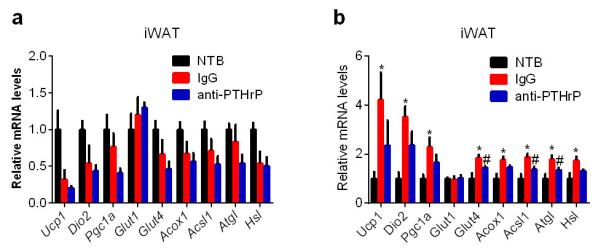
a, Mice inoculated with LLC cells received IgG or anti-PTHrP (10 mg/kg body weight) every 3 days from day 6 to day 15 and were sacrificed at day 16 (n = 4, 5 and 6 for the NTB, IgG and anti-PTHrP groups respectively).. At this time point, we did not observe any increase in the thermogenic gene profile in iWAT. Therefore, we performed another neutralization experiment (b) in which mice were treated similarly to a except that they received antibody injections at day 4 and 7 and were sacrificed at day 8. mRNA levels in iWAT were determined (n = 6 for each group). At this early stage of cachexia, weight loss is not evident. However, expression of thermogenic genes was increased in iWAT and the anti-PTHrP treatment blunted these changes. Values are means ± SEM. Statistics by two-tailed t-test. (*) compares NTB and IgG groups. (#) refers to differences between the IgG and anti-PTHrP groups. *P < 0.05, #P < 0.05.
Extended Data Figure 8. Effects of PTHrP neutralization on whole-body metabolism, food intake and physical activity of the cachectic mice.
Mice were placed into metabolic cages 4 days after inoculation with LLC cells. They received IgG or anti-PTHrP (10 mg/kg body weight) every 3 days from day 6 to day 15 (n = 6 for the NTB group and 5 for the other groups). Food intake (a), physical activity (b), CO2 production (c), respiratory exchange ratio (RER) (d) and heat output (e) were monitored. Values are means ± SEM. Statistics by two-tailed t-test. (*) compares the NTB and IgG groups. (#) refers to differences between the IgG and anti-PTHrP groups. *P < 0.05, **P < 0.005, ***P < 0.0005, #P < 0.05, ##P < 0.005, ###P < 0.0005.
Extended Data Figure 9. Effects of PTHrP neutralization on ex vivo adipose and skeletal muscle tissue respiration.
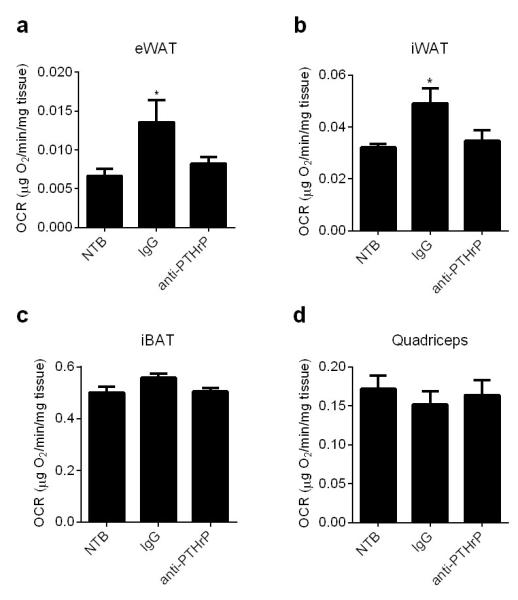
Mice described in Extended Data Fig. 8 were sacrificed at day 16 and their tissues were harvested for measurement of ex vivo respiration using a Clark electrode (n = 6 for the NTB group and 5 for the other groups). Values are means ± SEM. Statistics by two-tailed t-test. *P < 0.05 compared with the NTB group.
Extended Data Figure 10. LLC tumor-bearing mice do not display hypercalcemia and PTHrP treatment alone does not induce expression of muscle atrophy-related genes but exacerbates cachexia in the LLC tumor-bearing mice.
a, H&E staining of representative cross sectional area of gastrocnemius muscles from the experiment described in Fig. 4b-g. b-c, Plasma calcium was measured in experiments described in Fig 4a and 4b-g. d-e, mRNA levels in quadriceps muscles from the experiment described in Extended Data Fig. 6c-d were measured (n = 5 for the control group and 7 for the PTHrP group). f-g, Primary myotubes were treated with TNFα or PTHrP (100 ng/ml each) for 2hr to test gene expression by RT-qPCR or24 hr to measure myotube diameter (n = 3). Values are means ± SEM. Statistics by two-tailed t test. *P < 0.05, **P < 0.005, ***P < 0.0005 compared with the control group. h-j, Mice inoculated with LLC cells were sacrificed after receiving daily injections of PTHrP (1 mg/kg body weight) between days 10-16 (n = 5 for the LLC-Vehicle group and 6 for the other groups). Carcass weight was measured by subtracting the tumor weight from the total weight (h). Fat tissues (i) and tumors (j) were dissected and weighed. Values are means ± SEM. Statistics by two-tailed t-test. (*) refers to differences compared to the NTB-Vehicle group. (#) refers to differences between the LLC groups. *P < 0.05, **P < 0.005, ***P < 0.0005, #P < 0.05, ##P < 0.005.
Supplementary Material
Acknowledgements
We thank Marina Mourtzakis and Carla Prado (Uni. of Alberta) for their help with the human study. S.Kir is a Robert Black Fellow of the Damon Runyon Cancer Research Foundation (DRG-2153-13) and J.P.W. is supported by a postdoctoral fellowship from the American Cancer Society (PF-13-385-01-TBE). This work was supported by NIH grant DK31405 to B.M.S.
Footnotes
Author Contributions
S.Kir and B.M.S. conceived and designed the experiments. S.Kir, J.P.W., S.K., L.K. and P.C. performed the experiments. S.Kir, J.P.W. and V.E.B. analyzed the data. S.Kir and B.M.S. wrote the manuscript.
Author Information
Reprints and permissions information is available at www.nature.com/reprints. The authors declare no competing financial interests. Readers are welcome to comment on the online version of this article at www.nature.com/nature.
Supplemental information is linked to the online version of the paper at www.nature.com/nature
Supplementary Information | All metabolic and clinical data for the cancer patients included in this study.
Full Methods and any associated references are available in the online version of the paper at www.nature.com/nature.
References
- 1.Bianchi A, et al. Increased brown adipose tissue activity in children with malignant disease. Horm Metab Res. 1989;21:640–641. doi: 10.1055/s-2007-1009308. [DOI] [PubMed] [Google Scholar]
- 2.Bing C, et al. Increased gene expression of brown fat uncoupling protein (UCP)1 and skeletal muscle UCP2 and UCP3 in MAC16-induced cancer cachexia. Cancer Res. 2000;60:2405–2410. [PubMed] [Google Scholar]
- 3.Brooks SL, Neville AM, Rothwell NJ, Stock MJ, Wilson S. Sympathetic activation of brown-adipose-tissue thermogenesis in cachexia. Biosci Rep. 1981;1:509–517. doi: 10.1007/BF01121584. [DOI] [PubMed] [Google Scholar]
- 4.Roe S, Cooper AL, Morris ID, Rothwell NJ. Mechanisms of cachexia induced by T-cell leukemia in the rat. Metabolism. 1996;45:645–651. doi: 10.1016/s0026-0495(96)90037-2. [DOI] [PubMed] [Google Scholar]
- 5.Shellock FG, Riedinger MS, Fishbein MC. Brown adipose tissue in cancer patients: possible cause of cancer-induced cachexia. J Cancer Res Clin Oncol. 1986;111:82–85. doi: 10.1007/BF00402783. [DOI] [PubMed] [Google Scholar]
- 6.Tsoli M, et al. Activation of thermogenesis in brown adipose tissue and dysregulated lipid metabolism associated with cancer cachexia in mice. Cancer Res. 2012;72:4372–4382. doi: 10.1158/0008-5472.CAN-11-3536. [DOI] [PubMed] [Google Scholar]
- 7.Fearon KC, Glass DJ, Guttridge DC. Cancer cachexia: mediators, signaling, and metabolic pathways. Cell Metab. 2012;16:153–166. doi: 10.1016/j.cmet.2012.06.011. [DOI] [PubMed] [Google Scholar]
- 8.Ovesen L, Allingstrup L, Hannibal J, Mortensen EL, Hansen OP. Effect of dietary counseling on food intake, body weight, response rate, survival, and quality of life in cancer patients undergoing chemotherapy: a prospective, randomized study. J Clin Oncol. 1993;11:2043–2049. doi: 10.1200/JCO.1993.11.10.2043. [DOI] [PubMed] [Google Scholar]
- 9.Tisdale MJ. Mechanisms of cancer cachexia. Physiol Rev. 2009;89:381–410. doi: 10.1152/physrev.00016.2008. [DOI] [PubMed] [Google Scholar]
- 10.Penna F, et al. Anti-cytokine strategies for the treatment of cancer-related anorexia and cachexia. Expert opinion on biological therapy. 2010;10:1241–1250. doi: 10.1517/14712598.2010.503773. [DOI] [PubMed] [Google Scholar]
- 11.Fearon K, Arends J, Baracos V. Understanding the mechanisms and treatment options in cancer cachexia. Nature reviews. Clinical oncology. 2013;10:90–99. doi: 10.1038/nrclinonc.2012.209. [DOI] [PubMed] [Google Scholar]
- 12.Wu J, et al. Beige adipocytes are a distinct type of thermogenic fat cell in mouse and human. Cell. 2012;150:366–376. doi: 10.1016/j.cell.2012.05.016. [DOI] [PMC free article] [PubMed] [Google Scholar]
- 13.Cohen P, et al. Ablation of PRDM16 and Beige Adipose Causes Metabolic Dysfunction and a Subcutaneous to Visceral Fat Switch. Cell. 2014;156:304–316. doi: 10.1016/j.cell.2013.12.021. [DOI] [PMC free article] [PubMed] [Google Scholar]
- 14.Das SK, et al. Adipose triglyceride lipase contributes to cancer-associated cachexia. Science. 2011;333:233–238. doi: 10.1126/science.1198973. [DOI] [PubMed] [Google Scholar]
- 15.Vilardaga JP, Romero G, Friedman PA, Gardella TJ. Molecular basis of parathyroid hormone receptor signaling and trafficking: a family B GPCR paradigm. Cellular and molecular life sciences: CMLS. 2011;68:1–13. doi: 10.1007/s00018-010-0465-9. [DOI] [PMC free article] [PubMed] [Google Scholar]
- 16.Lieffers JR, et al. A viscerally driven cachexia syndrome in patients with advanced colorectal cancer: contributions of organ and tumor mass to whole-body energy demands. The American journal of clinical nutrition. 2009;89:1173–1179. doi: 10.3945/ajcn.2008.27273. [DOI] [PMC free article] [PubMed] [Google Scholar]
- 17.Mourtzakis M, et al. A practical and precise approach to quantification of body composition in cancer patients using computed tomography images acquired during routine care. Applied physiology, nutrition, and metabolism = Physiologie appliquee, nutrition et metabolisme. 2008;33:997–1006. doi: 10.1139/H08-075. [DOI] [PubMed] [Google Scholar]
- 18.Prado CM, et al. Dietary patterns of patients with advanced lung or colorectal cancer. Canadian journal of dietetic practice and research: a publication of Dietitians of Canada = Revue canadienne de la pratique et de la recherche en dietetique: une publication des Dietetistes du Canada. 2012;73:e298–303. doi: 10.3148/73.4.2012.e298. [DOI] [PubMed] [Google Scholar]
- 19.Mundy GR, Edwards JR. PTH-related peptide (PTHrP) in hypercalcemia. J Am Soc Nephrol. 2008;19:672–675. doi: 10.1681/ASN.2007090981. [DOI] [PubMed] [Google Scholar]
- 20.Iguchi H, Aramaki Y, Maruta S, Takiguchi S. Effects of anti-parathyroid hormone-related protein monoclonal antibody and osteoprotegerin on PTHrP-producing tumor-induced cachexia in nude mice. Journal of bone and mineral metabolism. 2006;24:16–19. doi: 10.1007/s00774-005-0640-5. [DOI] [PubMed] [Google Scholar]
- 21.Iguchi H, Onuma E, Sato K, Sato K, Ogata E. Involvement of parathyroid hormone-related protein in experimental cachexia induced by a human lung cancer-derived cell line established from a bone metastasis specimen. International journal of cancer. Journal international du cancer. 2001;94:24–27. doi: 10.1002/ijc.1425. [DOI] [PubMed] [Google Scholar]
- 22.Sato K, et al. Passive immunization with anti-parathyroid hormone-related protein monoclonal antibody markedly prolongs survival time of hypercalcemic nude mice bearing transplanted human PTHrP-producing tumors. Journal of bone and mineral research : the official journal of the American Society for Bone and Mineral Research. 1993;8:849–860. doi: 10.1002/jbmr.5650080711. [DOI] [PubMed] [Google Scholar]
- 23.White JP, et al. Testosterone regulation of Akt/mTORC1/FoxO3a signaling in skeletal muscle. Mol Cell Endocrinol. 2013;365:174–186. doi: 10.1016/j.mce.2012.10.019. [DOI] [PMC free article] [PubMed] [Google Scholar]
- 24.Ruas JL, et al. A PGC-1alpha isoform induced by resistance training regulates skeletal muscle hypertrophy. Cell. 2012;151:1319–1331. doi: 10.1016/j.cell.2012.10.050. [DOI] [PMC free article] [PubMed] [Google Scholar]
Associated Data
This section collects any data citations, data availability statements, or supplementary materials included in this article.


