Abstract
Objective
We aimed to investigate the prevalence and psychosocial and neurophysiological correlates of depression in a large county-based cohort of Korean adults.
Methods
We recruited 2355 adults from a rural county-based health promotion program. The following psychometric scales were used: the Center for Epidemiologic Studies Depression scale (CES-D) was used to assess depression, the General Health Questionnaire (GHQ) was used to evaluate stress, and the Medical Outcome Study Social Support Survey (MOS-SSS) was used to determine perceived social support. Heart rate variability (HRV) was used to assess neurophysiological properties. The psychosocial and neurophysiological variables of adults with depression (CES-D score ≥25) and without depression (CES-D score <25) were statistically compared. A logistic regression model was constructed to identify factors independently associated with depression.
Results
We estimated that 17.7% of the subjects had depression, which was associated with old age, being female, being single, less religious affiliation, high education, low body mass index (BMI), low levels of aerobic exercise, low social support, and a low HRV triangular index. The explanatory factors of depression included high education, less religious affiliation, low levels of current aerobic exercise, low BMI, and low social support.
Conclusion
Given the relatively high prevalence of overall depression, subsyndromal depression should also be regarded as an important issue in screening. The independent factors associated with depression suggest that practical psychosocial intervention, including brief psychotherapy, aerobic exercise, and other self-help methods should be considered. In addition, the HRV results suggest that further depression screening accompanied by neurophysiological features would require fine methodological modifications with proactive efforts to prevent depressive symptoms.
Keywords: Depression, Screening, Self-report questionnaire, Subsyndromal depression, Psychosocial intervention
INTRODUCTION
Depression is a significant public health concern across the world that is strongly linked to social conditions.1 In Korean adults, the lifetime prevalence estimates of major depressive disorder (MDD) was 6.7% in 2011, which is an increase of 19.6% compared to 2006.2 The economic cost of depression in Korea is estimated to be 4049 million USD, which includes 152.6 million USD for direct healthcare costs, 3880.5 million USD for indirect costs, and 2958.9 million USD for morbidity costs.3 Moreover, given the significant increase in suicide, depression has become a major concern to the Korean public health sector,4 and public awareness of depression has improved accordingly with the inclusion of screening for depression in the non-clinical population. However, it has been reported that routine screening for depression in the non-clinical population using standardized questionnaires is less effective in terms of clinical outcomes compared to screening in a primary care environment; such findings have been reported for the U.S. Preventive Services Task Force5 and the Canadian Task Force.6 Similar findings have been found by the U.K. National Institute of Clinical Excellence.7 These epidemiological studies emphasized appropriate management coupled with depression screening in non-clinical population, and they widely used self-rating scales as a screening tool, despite diverse criticisms.5,6,7 Self-rating scales have benefits, such as access to information from large populations, minimal time input, cost benefits related to training personnel, and a standardized approach to administration and scoring.8 Taking the requirements for screening tools into account, tension between acceptability and accuracy, and regarding the tendency for Korean individuals to consider their emotional state as a mild condition, a dimensional approach, such as the Korean version of the Center for Epidemiologic Studies Depression scale (CES-D) is necessary to detect depression in epidemiological studies.9 According to Whooley et al.,10 CES-D is the second most effective scale for detecting depression in terms of acceptability. It is simpler than the Medical Outcome Study depression measurement scale (MOS-8), and convenient for screening the general population. However, severity scales are primarily symptom counts over a narrowly defined period, and they do not usually measure chronicity or effect on daily function, which limits the precise measurement of the burden of depression.11 These limitations led to challenges in establishing objective measures of depression,12 including heart rate variability (HRV) as a representation of autonomic nervous system activity. While many epidemiological studies investigate the prevalence of and factors associated with depression, to our knowledge, most highlight the psychosocial factors and scarcely utilize physical measures, including HRV parameters, leading to a lack of comprehensive approach. Thus, using cross-sectional and epidemiological data from a rural county-based health promotion program, we aimed to 1) investigate the prevalence of depression using the CES-D scale, 2) reveal the relevant psychosocial and physical factors along with the HRV index, and 3) identify specific psychosocial and neurophysiological features associated with depression.
METHODS
Subjects
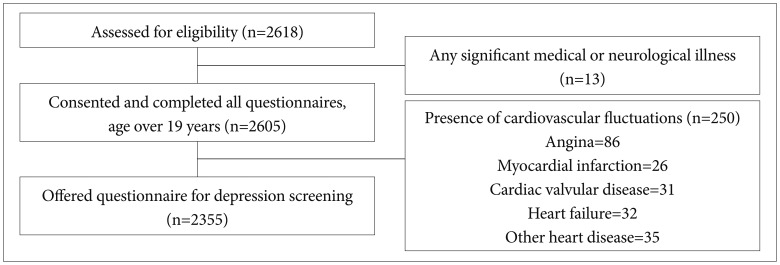
This study was conducted between February 2005 and December 2010 in one rural county of the Gyeonggi province in Korea. The study population consisted of 2618 adults who voluntarily participated in a county-based study as part of a health promotion program. We used a broad inclusion criteria and minimal exclusion criteria to investigate the actual prevalence of depression, and to clarify psychosocial, physical, and biological correlates of depression. Inclusion criteria were 1) age over 19 years, and 2) able to complete questionnaires and physical evaluations including body compositional parameters, blood pressure and HRV. Figure 1 depicts the process and criteria for selecting subjects. The exclusion criterion was a current history of any significant medical or neurological illnesses that would lead to an impaired ability to participate in evaluations. Although it was not used as an inclusion or exclusion criterion, the study population used for HRV measures excluded participants with angina, myocardial infarction, cardiac valvular disease, heart failure, and other heart disease to minimize the influence of heart disease on HRV echocardiography.13,14 The final 2355 participants included 1450 women (61.6%) and 905 men (38.4%) who completed self-questionnaires for depression screening. Details of this study design and method have been described in a previous article on HRV and social support.15 The study protocol and consent forms were approved by the Institutional Review Board (IRB) of the hospital of the Hanyang University of Medicine, Seoul. All study participants provided written informed consent prior to participation.
Figure 1.
The process and criteria for selecting subjects in this study.
Demographic features, physical activity status, and body compositional features
The collected demographic data included age, sex, level of education (less or more than high school), marital status (currently married or unmarried), employment status (currently employed or unemployed), and religious affiliation (observant or not). Physical activity status was also investigated by items such as current aerobic exercise (regular exercise once a week or no exercise), drinking habits (current drinker or non-drinker), and medical comorbidity. The body compositional features collected included body mass index (BMI), soft lean mass (SLM), body fat mass, as well as mean blood pressure. BMI was calculated from self-statements related to weight and height, as in most epidemiological studies on the relationship between obesity and psychiatric disorders.16,17,18 The InBody 3.0 Body Composition Analyzer (InBody 3.0, Biospace, Seoul, Korea) was used to measure SLM and body fat mass. Blood pressure was recorded using a digital electronic tensiometer after a 10-minute rest period. Diagnostic evaluations and retrospective medical disorder and treatment history were collected at baseline.
Assessment scale scores
The CES-D supports the four-factor structure of depression19 that includes positive affect, depressed affect, somatic symptoms, and interpersonal problems, with each item scored on a scale from 0-3. In this study, we used the Korean version of the CES-D, which was translated and standardized by Cho and Kim.14 Its reliability, as measured by Cronbach's α, reveals an internal consistency of 0.827. According to Cho et al.,20 scores ≥25 on CES-D is defined as "depression" and scores <25 is defined as "without depression." The Medical Outcome Study Social Support Survey (MOS-SSS), a self-report instrument, was used to assess the social support system.16 The MOS-SSS consists of 19 items scored on a scale from 0-100, and measures emotional/information support, tangible support, positive social interaction, and affectionate support. In this study, we used the Korean version of the MOS-SSS, standardized by Lim et al.17 Its reliability, as measured by Cronbach's α, reveals an overall internal consistency coefficient of 0.910. To evaluate psychosocial stress, the 18-item General Health Questionnaire (GHQ-18) was used.18,19 The GHQ-18 is a widely used instrument in Korea, and consists of 18 questions scored on a 4-point Likert scale. Its reliability, as measured by Cronbach's α, reveals an overall internal consistency of 0.727.
Individual parameters of heart rate variability
Participants were forbidden from eating for 8 hours prior to the study, and smoking or drinking alcohol/caffeine right before the study. After 20 minutes of resting, an electrocardiogram (ECG) was recorded for 5 minutes in the supine position, according to the QECG-3 model (CANS 3000R; LAXTHA, Daegu, Korea). The ECG data were stored and analyzed using TeleScan version 2.7 in the time and frequency domains. In the time domain, the following statistical parameters were analyzed: normal to normal interval (NN interval), R-R interval, heart rate variability triangular index (HRV index), standard deviation of the NN (SDNN), root mean square of the differences in successive NN (RMSSD), number of adjacent NN interval pairs differing by over 50 ms in the entire recording (NN50), and NN50/total number of all NN (pNN50). In the frequency domain, the power spectrum of HRV signals was calculated by Fourier transformations with four components: total power (TP; variance of NN intervals over the temporal segment), very-low-frequency power (VLF; <0.04 Hz), low-frequency power (LF; 0.04-0.15 Hz), and high-frequency power (HF; 0.15-0.4 Hz). It is known that efferent vagal activity is a major contributor to the HF component, and both sympathetic and vagal influences affect the LF component leading the LF/HF ratio to reflect sympathovagal balance or sympathetic modulation.21 The HRV triangular index measure is the integral of the density distribution divided by the maximum of the density distribution,21 as a geometric pattern. The advantage of this geometric method lies in its relative insensitivity to the analytical quality of the series of NN intervals.21
Statistical analysis
Participants were divided into adults with and without depression using a cutoff value of 25 on the CES-D scale. Data were presented as numbers (percentages) for discrete variables, and as means (standard deviations) for continuous variables. Descriptive statistics were used to characterize the participants at baseline, and the χ2 tests were conducted to compare the differences in discrete variables' between "with depression" and "without depression" groups. Participants with depression were significantly older (t=-8.220, p<0.0001) and more likely to be women (χ2=36.557, p<0.0001). Moreover, according to Antelmi et al.,14 HRV decreases with increasing age, is influenced by sex, and is higher in patients with higher functional capacity. Hence, analyses of covariance (ANCOVA) were conducted after adjusting for the effect of age and sex to analyze group differences in continuous variables, including assessment scale scores and body compositional features. A logistic regression model after adjusting for the effect of age and sex was constructed to identify factors independently associated with depression, and significance was set at p<0.05 (two-tailed) for all tests. All statistical analyses were performed using SPSS 18.0 for Windows (SPSS Inc., Chicago, IL, USA).
RESULTS
Participant characteristics
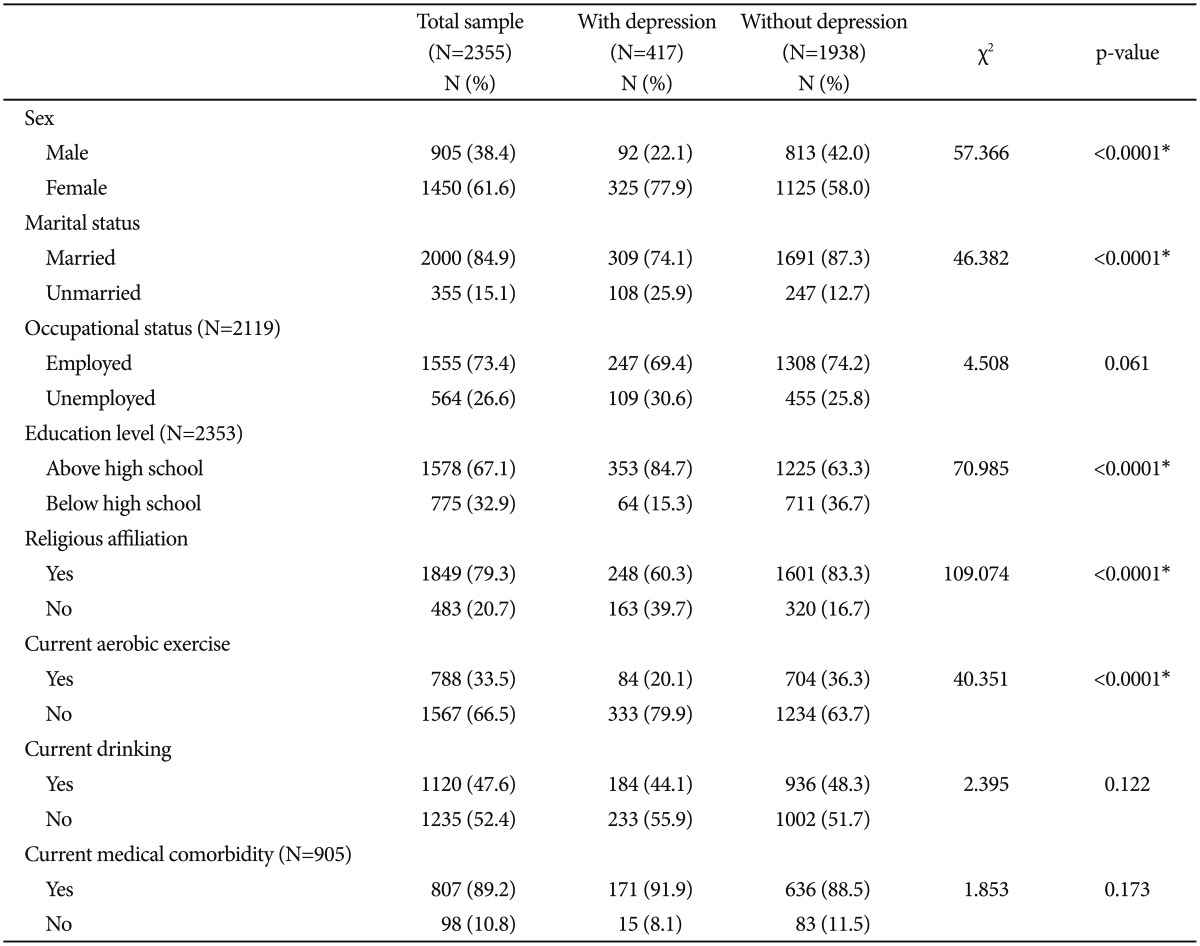
Demographic features, physical activity status, psychosocial status, and HRV characteristics of the 2355 participants are represented in Table 1, 2, and 3. The mean age of participants was 59 years (SD=10.0); most participants were female (61.6%), married (84.9%), with religious affiliation (79.3%), employed (73.4%), and had more than a high school education (67.1%). Mean BMI was 24.6 kg/m2 (SD=3.1) and mean SLM was 42.6 kg (SD=9.0). The mean body fat mass of participants was 17.5 kg (SD=8.7), and average mean BP was 93.5 mm Hg (SD=11.3). About one third of participants currently performed aerobic exercises (33.5%), and nearly half were current drinkers (47.6%). A significant percentage (89.2%) of the 905 participants who completed the medical condition questionnaire had medical comorbidity.
Table 1.
Comparison of demographic features and physical activity status between subjects with and without depression
*p<0.01
Table 2.
Comparison of assessment scale scores and body compositional features between subjects with and without depression

*p<0.01, †adjusted for the effect of age and sex
Table 3.
Comparison of heart rate variability parameters between subjects with and without depression
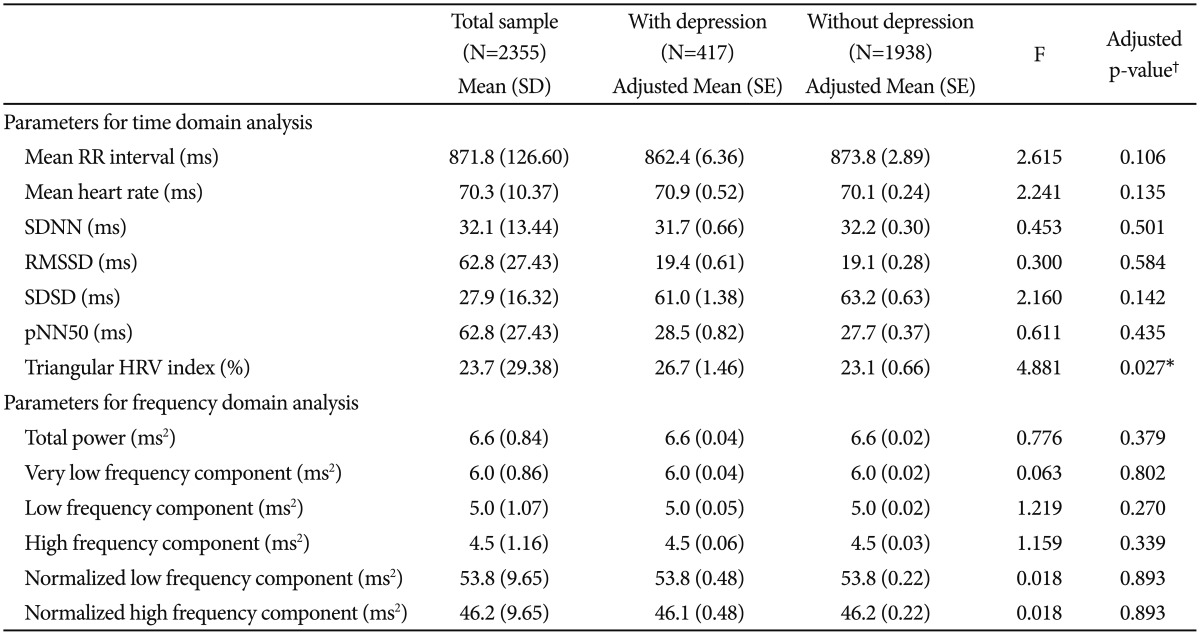
*p<0.05, †adjusted for the effect of age and sex. SDNN: standard deviation of NN interval, RMSSD: square root of the mean squared differences of successive NN interval, SDSD: standard deviation of the successive NN differences, pNN50: percentage of differences between adjacent NN intervals
Prevalence of depression
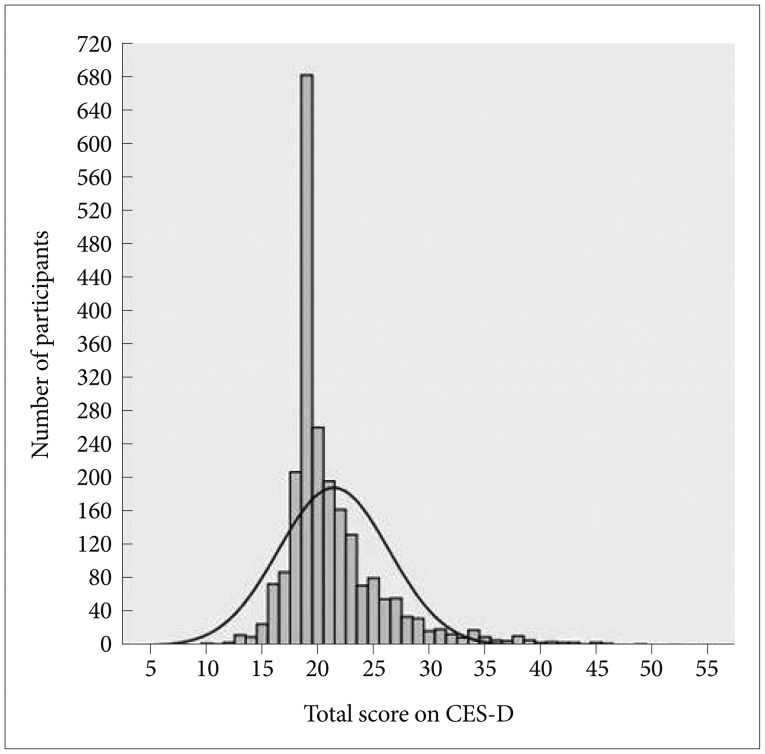
The prevalence of depression according to severity is shown in Figure 2 (unimodal distribution). In this sample, 17.7% of participants were estimated to have depression. The mean CES-D score was 21.4 (SD=4.97; range=8-52; 95% CI=20.47-20.96). The overall distribution of CES-D score was positively skewed (Sk=2.10) with 63.9% of participants scoring less than 20, and the mean score was higher than the median and mode scores (both 19), as shown in Figure 2. The distribution was leptokurtic because 31.3% of respondents had a score of 19 (K=6.11).
Figure 2.
The distribution of total scores on the Center for Epidemiological Studies Depression scale (CES-D) in this study (n=2355; mean=21.4; SD=4.97; range=8-52).
Comparison of demographic features and physical activity status for subjects with and without depression
The demographic features and physical activity status of participants with and without depression are shown in Table 1. The mean age of participants with depression was 61.3, and was significantly different from the mean age of participants without depression, which was 57.9 (p<0.0001). Participants with depression were less likely to have religious affiliation (χ2=109.074, p<0.0001), were more likely to be educated beyond high school (χ2=70.985, p<0.0001), more likely to be female (χ2=57.366, p<0.0001), and more likely to be unmarried (χ2=46.382, p<0.0001) than those without depression. Participants with depression performed less current aerobic exercise compared to participants without depression (χ2=40.351, p<0.0001).There were no significant differences between the two groups with respect to employment (χ2=4.508, p=0.061), current drinking habits (χ2=2.395, p=0.122) and medical comorbidity (χ2=1.853, p=0.173).
Comparison of assessment scale scores and body compositional features for subjects with and without depression
As mentioned in the methods, because of the significant difference in age and sex distributions between participants with and without depression, comparisons of the assessment scale scores and body compositional features were calculated using ANCOVA after adjusting for the effects of age and sex (Table 2). Individuals with depression had significantly lower MOS-SSS scores than individuals without depression (F=83.298, p<0.0001, adjusted for age and sex). However, there was no significant difference between GHQ-18 scores (F=0.036, p=0.850, adjusted for age and sex). The depression group had significantly lower BMI (F=7.081, p=0.008, adjusted for age and sex). There was no significant difference between the two groups with respect to soft lean mass (F=2.993, p=0.084, adjusted for age and sex), body fat mass (F=0.877, p=0.349, adjusted for age and sex), or mean blood pressure (F=1.287, p=0.257, adjusted for age and sex).
Comparison of heart rate variability in subjects with and without depression
Comparison of HRV in participants with and without depression after adjusting for the effects of age and sex is shown in Table 3. For the time domain analysis parameters, the HRV triangular index was significantly lower in the depression group (F=4.881, p=0.027, adjusted for age and sex). There were no significant differences between the two groups with respect to mean RR interval (F=2.615, p=0.106, adjusted for age and sex), mean heart rate (F=2.241, p=0.135, adjusted for age and sex), SDNN (F=0.453, p=0.501, adjusted for age and sex), RMSSD (F=0.300, p=0.584, adjusted for age and sex), SDSD (F=2.160, p=0.142, adjusted for age and sex), and pNN50 (F=0.611, p=0.435, adjusted for age and sex). There were no significant differences between the two groups on frequency domain analysis parameters, such as TP (F=0.776, p=0.379, adjusted for age and sex), VLF (F=0.063, p=0.802, adjusted for age and sex), LF (F=1.219, p=0.270, adjusted for age and sex), HF (F=1.159, p=0.339, adjusted for age and sex), normalized low frequency component (F=0.018, p=0.893, adjusted for age and sex), and normalized high frequency component (F=0.018, p=0.893, adjusted for age and sex).
Factors associated with "depression" in the logistic regression model
Table 4 presents the independent factors associated with depression; the Hosmer-Lemeshow goodness-of-fit test confirmed model accuracy (χ2=5.074, df=8, and p=0.750, adjusted for age and sex). According to χ2 tests and ANCOVAs, diverse variables including sex, age, marital status, education level, religious affiliation, current aerobic exercise, BMI, social support and triangular HRV index were significantly different between subjects with and without depression. These variables were used as independent variables in the binary logistic regression analysis with depression as a dependent variable, adjusting for the effect of age and sex. The results indicated that the following variables were independently associated with depression: educated beyond high school (reference; less than high school education; OR=1.464, 95% CI=1.025-2.089, p=0.036; adjusted for age and sex), no religious affiliation (reference, any religious affiliation; OR=2.180, 95% CI=1.560-3.047, p<0.0001; adjusted for age and sex), no current aerobic exercise (reference, current aerobic exercise; OR=1.603, 95% CI=1.160-2.214, p=0.004; adjusted for age and sex), lower BMI (OR=0.946, 95% CI=0.902-0.992, p=0.023; adjusted for age and sex), and lower social support (OR=0.963, 95% CI=0.949-0.977, p<0.0001; adjusted for age and sex). Triangular HRV index (OR=1.005, 95% CI=0.999-1.010, p=0.101; adjusted for age and sex) and marital status (OR=1.231, 95% CI=0.828-1.829, p=0.304; adjusted for age and sex) were not independently associated with depression.
Table 4.
Logistic regression model demonstrating independent correlates of "depression" status

*p<0.05, **p<0.01, †adjusted for the effect of age and sex. HRV: heart rate variability
DISCUSSION
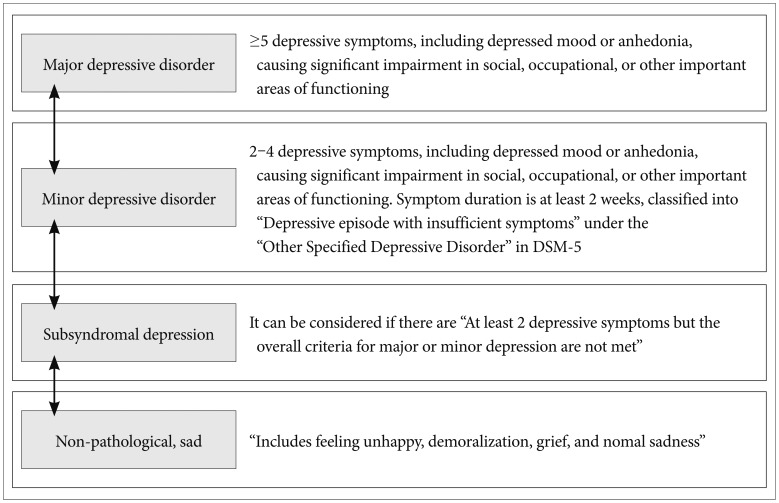
In this study, 17.7% of the subjects were classified as having definite depression according to the CES-D scale (cutoff score of 25), with 36.1% of the subjects having probable depression; this highlights a much higher prevalence of depression in our study than in the study by Cho et al.20 (6.8% of men and 10.4% of women) and Park et al.22 (10.1%). This could be due to several factors. First, methodological issues associated with the use of self-report questionnaires may have led to asymmetric results, i.e., the high prevalence of depression may be due to self-reported detection. Second, since 39.6% of subjects were older than 65, the mean age may have influenced the reported prevalence of depression; our findings are consistent with the high prevalence of late-life depression in Korea22,23 and the tendency to report somatic symptoms as emotional disturbances, which influences the CES-D. The high prevalence of depression in this epidemiological study can also be explained by the fact that participants were from rural county, there is a higher prevalence of depression in rural compared with urban areas.24,25 Large productive populations with competitive energy have moved from rural to urban areas for several years, looking for appropriate jobs. Recent sudden changes tend to have a greater effect on socioeconomic recession of rural county due to its relationship with primary industries. Our findings also reflect an overall increase in depression, consistent with a previous national survey.2 Using a cutoff value of 25 in the CES-D, sensitivity of 0.91, specificity of 0.79, false-positive rate of 0.21, positive predictive value of 0.63, and negative predictive value of 0.96, classified individuals as depressed in this study requires further clinical investigation with attention. A CES-D cutoff value of 21 identifies individuals in a clinical middle ground between clearly depressed and not-depressed. Namely, the CES-D represents the overall emotional state of an individual, ranging from normal, non-pathological sadness, grief, and subsyndromal depression. Figure 3 represents the classification of depression by severity. Subsyndromal depression was highly prevalent even within the epidemiological catchment area (ECA) reported in a previous study;26 the combined 1-year prevalence rate of subsyndromal depression and minor depression was 11.8% greater than the prevalence rate for all other mood disorders. Subsyndromal depression is known for its considerable impact on quality of life27 and large-scale economic costs due to disability,28 and thus, it should be linked to appropriate psychosocial evaluations. Accordingly, it has been suggested that the threshold for clinical attention should be lowered, while the threshold for pharmacological intervention should be raised.29
Figure 3.
Continuous diagnostic clusters of depressive disorders. DSM-5: The Diagnostic and Statistical Manual of Mental Disorders, fifth edition.
Our findings reveal that participants with lower BMI and lower social support are significantly more likely to have depression. In addition, the computations of odds ratios suggested that participants educated beyond high school and without religious affiliation, who do not perform regular aerobic exercise, were more likely to have depression. Marital status and triangular HRV index were relevant factors associated with depression, but these factors were insufficient to satisfy an explanatory model. The high religious affiliation associated with the low occurrence of depression might be explained by the fact that religion provides a subjective sense of well-being.30 Consistent with previous studies,31 the association between low levels of current aerobic exercise and depression might be due to the neurochemical effects of physical activity.32 Low energy related to depression might also affect the amount of exercise undertaken by depressed participants, which in turn may explain the association between depression and BMI. Vegetative symptoms related to depression could also influence the lower BMI associated with depression, combined with the "jolly fat" theory proposed by Crisp et al.,33 in which depression and anxiety decreased in obese middle-aged men. In rural countries, individuals typically have large families, and thus, may have greater social support, might have affected the results of this study. Marriage was insufficient to satisfy the explanatory model, and may have been influenced by stronger variables, such as social support and religious affiliation. Education level was also deemed relevant based on a χ2 test, and satisfied the explanatory model after adjusting for the effects of sex and age. However, there are mixed results on the relationship between education level and depression, with some studies in Asian countries,34 and others showing results inconsistent with ours.22 Subjects with higher education may live in environments that are more competitive where they experience more psychological stress, which may correlate with psychiatric problems, such as depression. According to the buffering hypothesis, individuals with higher social support are less likely to be depressed35 or to develop late-life depression.36
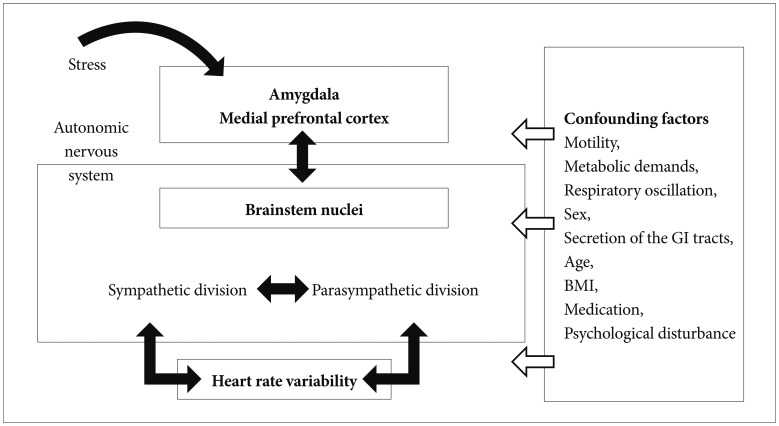
HRV is a widely used noninvasive approach for measuring heart rate modulation via ANS.37 This study excluded pathophysiological variables that affect HRV. In the time domain analysis, the triangular HRV index, which shows overall quantitative HRV as a geometric method with the integral of the density distribution divided by the maximum of the density distribution,21 was significantly higher in the depressed compared to the non-depressed group. In previous studies of subjects with post-myocardial infarction and depression, an HRV cut-off point of 20 was used as an indicator of high risk.38 However, other time domain and frequency domain analysis parameters were not significantly different between groups; this is inconsistent with studies showing autonomic dysfunction in depression, particularly decreased HRV and reduced cardiac parasympathetic activity.39,40,41 Figure 4 illustrates the complicated confounding variables that affect HRV and various neurovisceral structures related to HRV. HRV can be affected by thermoregulation, medication such as beta-blockers and antidepressants, motility, secretion of other organ structures, respiratory oscillation, sex, age, psychological disturbance and BMI mediated by the autonomic nervous system.14,42 Although we tried to adjust for other variables in this study, including cardiovascular pathologic condition, age, and sex, short data collection time could have affected the normalized LF and normalized HF, resulting in no significant difference between depressed and non-depressed subjects. The results of this study may also be attributed to the fact that the average age of the participants was over 60 years, because age attenuates HRV in individuals with and without depression.43 Uninvestigated habits may have influenced HRV, and the dilution of data from normal subjects could have influenced the results.
Figure 4.
Neurovisecral interactions with confounding variables related to heart rate variability  , Indicating the factors that operate on heart rate variability bidirectionally. Amygdala, medial prefrontal cortex and brainstem work as an interconnected network, and operate on heart rate variability by regulating the autonomic nervous system ⇦, Indicating the confounding factors that influence the overall network, and which can affect final heart rate variability differences.
The results from the explanatory modeling also support the notion that the high prevalence of depression observed in this study represents the overall emotional state of the residents. Thus, an active psychosocial approach to depression through religious affiliation, social support, and aerobic exercise may help prevent depression. We often use screening, diagnosis, and case findings interchangeably, but in an epidemiologic sense, screening refers to the attempted detection of a disorder in individuals who have not sought help or do not suspect their condition. Although screening does not have diagnostic value, applying it to a clinical condition, like case findings, can aid diagnosis.
Several limitations to this study are important to consider. First, although a CES-D cut off value of 25 might define existence of depression, this does not specifically indicate a clinical diagnosis. Therefore, caution is required when directly comparing the results of this study with those of a previous nationwide survey that used a diagnostic approach. To do this, we suggest that a two stage epidemiologic survey that includes a standardized diagnostic instrument, such as the Diagnostic Interview Schedule (DIS), is needed. Second, non-responders may have been in poorer health than responders, which might affect the estimation of the prevalence of depression. Third, data were only collected from residents available for the health survey; thus, respondents who were institutionalized were not included, which may have influenced the estimate of the prevalence of depression. Fourth, stigma might have led survey respondents with mental disorders to deny negative expressions compared to people free from stigma. Fifth, adapting self-report questionnaires to exclude illiterate individuals might have affected the observed prevalence rate. Seventh, since HRV data collection time was short (5-minutes), we could not analyze circadian rhythms which prevent a full interpretation of the HRV index. Additionally, analyzing HRV using a linear method and considering the results without variation, despite various individual HRVs could also be considered a limitation. Moreover, a failure to adjust other variables related to HRV is another limiting factor of this study. Eighth, ANCOVA was used without controlling for education level, because it was defined as an independent factor in depression. Finally a modification of the Bonferroni procedure for testing multiple hypotheses would have shown more precise estimates of the association between various variables and depression.
Screening for depression coupled with appropriate management is a general trend in "health psychiatry". It is a critical period for mental health professionals, because these findings have the potential to impact health policy and decisions about resource-allocation in Korea. An important aspect of this study is the inclusion of many measures including measures of depression, psychosocial correlates, and neurophysiological correlates such as HRV in a large sample study. These results suggest that interpretation, including assessment of overall emotional state, is required for screening based on self-report scales, as indicated by the high prevalence of depression. They also emphasize the link between psychosocial intervention for subsyndromal depression, and the association between exercise and depression, which support previous clinical guidelines that are effective in treating mild to moderate depression.44 Although the neurophysiological features, such as HRV, were insufficient to fulfill the explanatory model of depression in this study, methodological modification of the neurophysiological features coupled with subjective reports may suggest an alternative for future screening for depression screening that includes neurophysiological parameters.
Acknowledgments
This study was supported by a grant of the Korean Healthcare technology R&D Project, Ministry of Health and Welfare, Republic of Korea (HI10C2020).
References
- 1.Kim TS, Jeong SH, Kim JB, Lee MS, Kim JM, Yim HW, et al. The clinical research center for depression study: baseline characteristics of a Korean long-term hospital-based observational collaborative prospective cohort study. Psychiatry Investig. 2011;8:1–8. doi: 10.4306/pi.2011.8.1.1. [DOI] [PMC free article] [PubMed] [Google Scholar]
- 2.Cho MJ, Chang SM, Hahm BJ, Chung IW, Bae A, Lee YM, et al. Lifetime risk and age of onset distributions of psychiatric disorders: analysis of national sample survey in South Korea. Soc Psychiatry Psychiatr Epidemiol. 2012;47:671–681. doi: 10.1007/s00127-011-0381-9. [DOI] [PubMed] [Google Scholar]
- 3.Chang SM, Hong JP, Cho MJ. Economic burden of depression in South Korea. Soc Psychiatry Psychiatr Epidemiol. 2012;47:683–689. doi: 10.1007/s00127-011-0382-8. [DOI] [PubMed] [Google Scholar]
- 4.Jeon HJ. Epidemiologic studies on depression and suicide. J Korean Med Assoc. 2012;55:322–328. [Google Scholar]
- 5.Pignone MP, Gaynes BN, Rushton JL, Burchell CM, Orleans CT, Mulrow CD, et al. Screening for depression in adults: a summary of the evidence for the U.S. Preventive Services Task Force. Ann Intern Med. 2002;136:765–776. doi: 10.7326/0003-4819-136-10-200205210-00013. [DOI] [PubMed] [Google Scholar]
- 6.MacMillan HL, Patterson CJ, Wathen CN, Feightner JW, Bessette P, Elford RW, et al. Screening for depression in primary care: recommendation statement from the Canadian Task Force on Preventive Health Care. CMAJ. 2005;172:33–35. doi: 10.1503/cmaj.1030823. [DOI] [PMC free article] [PubMed] [Google Scholar]
- 7.Middleton H, Shaw I, Hull S, Feder G. NICE guidelines for the management of depression. BMJ. 2005;330:267–268. doi: 10.1136/bmj.330.7486.267. [DOI] [PMC free article] [PubMed] [Google Scholar]
- 8.Biggs JT, Wylie LT, Ziegler VE. Validity of the Zung Self-rating Depression Scale. Br J Psychiatry. 1978;132:381–385. doi: 10.1192/bjp.132.4.381. [DOI] [PubMed] [Google Scholar]
- 9.Cho MJ, Kim KH. Use of the center for epidemiologic studies depression (CES-D) scale in Korea. J Nerv Ment Dis. 1998;186:304–310. doi: 10.1097/00005053-199805000-00007. [DOI] [PubMed] [Google Scholar]
- 10.Whooley MA, Avins AL, Miranda J, Browner WS. Case-finding instruments for depression. Two questions are as good as many. J Gen Intern Med. 1997;12:439–445. doi: 10.1046/j.1525-1497.1997.00076.x. [DOI] [PMC free article] [PubMed] [Google Scholar]
- 11.Faravelli C, Servi P, Arends JA, Strik WK. Number of symptoms, quantification, and qualification of depression. Compr Psychiatry. 1996;37:307–315. doi: 10.1016/s0010-440x(96)90011-5. [DOI] [PubMed] [Google Scholar]
- 12.Smith KM, Renshaw PF, Bilello J. The diagnosis of depression: current and emerging methods. Compr Psychiatry. 2013;54:1–6. doi: 10.1016/j.comppsych.2012.06.006. [DOI] [PMC free article] [PubMed] [Google Scholar]
- 13.Ramaekers D, Ector H, Aubert A, Rubens A, Van de Werf F. Heart rate variability and heart rate in healthy volunteers. Is the female autonomic nervous system cardioprotective? Eur Heart J. 1998;19:1334–1341. doi: 10.1053/euhj.1998.1084. [DOI] [PubMed] [Google Scholar]
- 14.Antelmi I, de Paula RS, Shinzato AR, Peres CA, Mansur AJ, Grupi CJ. Influence of age, gender, body mass index, and functional capacity on heart rate variability in a cohort of subjects without heart disease. Am J Cardiol. 2004;93:381–385. doi: 10.1016/j.amjcard.2003.09.065. [DOI] [PubMed] [Google Scholar]
- 15.Shin YS, Byun JS, Kim SH, Shin JH, Choi BY, Nam JH, et al. Difference of the heart rate variability according to the social support level in a county. Korean J Psychosom Med. 2012;20:59–65. [Google Scholar]
- 16.Sunwoo YK, Bae JN, Hahm BJ, Lee DW, Park JI, Cho SJ, et al. Relationships of mental disorders and weight status in the Korean adult population. J Korean Med Sci. 2011;26:108–115. doi: 10.3346/jkms.2011.26.1.108. [DOI] [PMC free article] [PubMed] [Google Scholar]
- 17.Simon GE, Von Korff M, Saunders K, Miglioretti DL, Crane PK, van Belle G, et al. Association between obesity and psychiatric disorders in the US adult population. Arch Gen Psychiatry. 2006;63:824–830. doi: 10.1001/archpsyc.63.7.824. [DOI] [PMC free article] [PubMed] [Google Scholar]
- 18.Scott KM, McGee MA, Wells JE, Oakley Browne MA. Obesity and mental disorders in the adult general population. J Psychosom Res. 2008;64:97–105. doi: 10.1016/j.jpsychores.2007.09.006. [DOI] [PubMed] [Google Scholar]
- 19.Shafer AB. Meta-analysis of the factor structures of four depression questionnaires: Beck, CES-D, Hamilton, and Zung. J Clin Psychol. 2006;62:123–146. doi: 10.1002/jclp.20213. [DOI] [PubMed] [Google Scholar]
- 20.Cho MJ, Nam JJ, Suh GH. Prevalence of symptoms of depression in a nationwide sample of Korean adults. Psychiatry Res. 1998;81:341–352. doi: 10.1016/s0165-1781(98)00122-x. [DOI] [PubMed] [Google Scholar]
- 21.Heart rate variability: standards of measurement, physiologic interpretation, and clinical use. Task Force of the European Society of Cardiology and the North American Society of Pacing and Electrophysiology. Circulation. 1996;93:1043–1065. [PubMed] [Google Scholar]
- 22.Park JH, Kim KW, Kim MH, Kim MD, Kim BJ, Kim SK, et al. A nationwide survey on the prevalence and risk factors of late life depression in South Korea. J Affect Disord. 2012;138:34–40. doi: 10.1016/j.jad.2011.12.038. [DOI] [PubMed] [Google Scholar]
- 23.Iwata N, Okuyama Y, Kawakami Y, Saito K. Prevalence of depressive symptoms in a Japanese occupational setting: a preliminary study. Am J Public Health. 1989;79:1486–1489. doi: 10.2105/ajph.79.11.1486. [DOI] [PMC free article] [PubMed] [Google Scholar]
- 24.Probst JC, Laditka SB, Moore CG, Harun N, Powell MP, Baxley EG. Rural-urban differences in depression prevalence: implications for family medicine. Fam Med. 2006;38:653–660. [PubMed] [Google Scholar]
- 25.Seoul National University College of Medicine. The Epidemiological Survey of Mental disorder in Korea. Seoul: Ministry of Health and Welfare; 2012. [Google Scholar]
- 26.Robins LN, Regier DA. Psychiatric Disorders in America: the Epidemiologic Catchment Srea study. New York: Free Press; 1991. [Google Scholar]
- 27.Rapaport MH, Judd LL. Minor depressive disorder and subsyndromal depressive symptoms: functional impairment and response to treatment. J Affect Disord. 1998;48:227–232. doi: 10.1016/s0165-0327(97)00196-1. [DOI] [PubMed] [Google Scholar]
- 28.Broadhead WE, Blazer DG, George LK, Tse CK. Depression, disability days, and days lost from work in a prospective epidemiologic survey. JAMA. 1990;264:2524–2528. [PubMed] [Google Scholar]
- 29.Maj M. When does depression become a mental disorder? Br J Psychiatry. 2011;199:85–86. doi: 10.1192/bjp.bp.110.089094. [DOI] [PubMed] [Google Scholar]
- 30.Kasen S, Wickramaratne P, Gameroff MJ, Weissman MM. Religiosity and resilience in persons at high risk for major depression. Psychol Med. 2012;42:509–519. doi: 10.1017/S0033291711001516. [DOI] [PMC free article] [PubMed] [Google Scholar]
- 31.Oh HS, Lee HW, Park YC. The current status and requirements for non-pharmacological treatment of depression in Korea. Korean J Biol Psychiatry. 2007;14:21–27. [Google Scholar]
- 32.Strüder HK, Weicker H. Physiology and pathophysiology of the serotonergic system and its implications on mental and physical performance. Part II. Int J Sports Med. 2001;22:482–497. doi: 10.1055/s-2001-17606. [DOI] [PubMed] [Google Scholar]
- 33.Crisp AH, McGuiness B. Jolly fat: relation between obesity and psychoneurosis in general population. Br Med J. 1976;1:7–9. doi: 10.1136/bmj.1.6000.7. [DOI] [PMC free article] [PubMed] [Google Scholar]
- 34.Bromet E, Andrade LH, Hwang I, Sampson NA, Alonso J, De Girolamo G, et al. Cross-national epidemiology of DSM-IV major depressive episode. BMC Med. 2011;9:90. doi: 10.1186/1741-7015-9-90. [DOI] [PMC free article] [PubMed] [Google Scholar]
- 35.Paykel ES. Life events, social support and depression. Acta Psychiatr Scand Suppl. 1994;377:50–58. doi: 10.1111/j.1600-0447.1994.tb05803.x. [DOI] [PubMed] [Google Scholar]
- 36.Park JH, Kim KW, Kim MH, Kim MD, Kim BJ, Kim SK, et al. A nationwide survey on the prevalence and risk factors of late life depression in South Korea. J Affect Disord. 2012;138:34–40. doi: 10.1016/j.jad.2011.12.038. [DOI] [PubMed] [Google Scholar]
- 37.Woo JM. The concept and clinical application for the measurement of heart rate variability. Korean J Psychosom Med. 2004;12:3–14. [Google Scholar]
- 38.Connolly SJ, Schnell DJ, Page RL, Wilkinson WE, Marcello SR, Pritchett EL. Dose-response relations of azimilidein the management of symptomatic, recurrent, atrial fibrillation. Am J Cardiol. 2001;88:974–979. doi: 10.1016/s0002-9149(01)01973-7. [DOI] [PubMed] [Google Scholar]
- 39.Agelink MW, Majewski T, Wurthmann C, Postert T, Linka T, Rotterdam S, et al. Autonomic neurocardiac function in patients with major depression and effects of antidepressive treatment with nefazodone. J Affect Disord. 2001;62:187–198. doi: 10.1016/s0165-0327(99)00202-5. [DOI] [PubMed] [Google Scholar]
- 40.Dalack GW, Roose SP. Perspectives on the relationship between cardiovascular disease and affective disorder. J Clin Psychiatry. 1990;51(Suppl):4–9. [PubMed] [Google Scholar]
- 41.Guinjoan SM, Bernabó JL, Cardinali DP. Cardiovascular tests of autonomic function and sympathetic skin responses in patients with major depression. J Neurol Neurosurg Psychiatry. 1995;59:299–302. doi: 10.1136/jnnp.59.3.299. [DOI] [PMC free article] [PubMed] [Google Scholar]
- 42.Riganello F, Garbarino S, Sannita WG. Heart Rate Variability, Homeostasis, and Brain Function. J Psychophysiol. 2012;26:178–203. [Google Scholar]
- 43.Jindal RD, Vasko RC, Jr, Jennings JR, Fasiczka AL, Thase ME, Reynolds CF., 3rd Heart rate variability in depressed elderly. Am J Geriatr Psychiatry. 2008;16:861–866. doi: 10.1097/JGP.0b013e318180053d. [DOI] [PMC free article] [PubMed] [Google Scholar]
- 44.Park SC, Oh HS, Oh DH, Jung SA, Na KS, Lee HY, et al. Evidence-based, non-pharmacological treatment guideline for depression in Korea. J Korean Med Sci. 2014;29:12–22. doi: 10.3346/jkms.2014.29.1.12. [DOI] [PMC free article] [PubMed] [Google Scholar]


