

Abstract
Objective
To provide state-level estimates of obesity-attributable costs of absenteeism among working adults in the U.S.
Methods
Nationally-representative data from the National Health and Nutrition Examination Survey (NHANES) for 1998–2008 and from the Behavioral Risk Factor Surveillance System (BRFSS) for 2012 are examined. The outcome is obesity-attributable workdays missed in the previous year due to health, and their costs to states.
Results
Obesity, but not overweight, is associated with a significant increase in workdays absent, from 1.1 to 1.7 extra days missed annually compared to normal weight employees. Obesity-attributable absenteeism among American workers costs the nation an estimated $8.65 billion per year.
Conclusion
Obesity imposes a considerable financial burden on states, accounting for 6.5%–12.6% of total absenteeism costs in the workplace. State legislature and employers should seek effective ways to reduce these costs.
Introduction
Although obesity trends appear to be leveling off at the national level, the prevalence of obesity in the U.S. remains high, with more than a third of adults and 17% of youths being obese.1 Due to a number of serious health conditions linked to obesity, it incurs a considerable cost on obese individuals and the society at large. In 2008, an estimated $147 billion was spent to treat obesity-related health conditions, with half of these costs financed by Medicare and Medicaid.2 Potentially even a greater cost to society is from productivity losses due to obesity, including absenteeism (i.e., absence from work due to health issues) and presenteeism (i.e., not being productive while on the job). Reduced productivity of public and private employees could lead to higher production costs and a less competitive workforce.
Prior economic studies showed increasing rates of absenteeism among employees with higher body mass index (BMI).3–6 For example, women with BMI over 40 kg/m2 were reported to miss almost an additional week of work each year as compared to their normal weight peers.2 Among full-time employees in 2008, annual workdays missed due to health ranged from additional 0.5 days for overweight men (BMI 25.0–29.9) to 5.9 days for men and 9.4 days for women with BMI over 40, all in comparison to normal weight workers.5 The annual cost of such preventable losses can exceed $1,000 per employee in the highest BMI range. Even relatively low per-employee costs among overweight workers ($85–$1475) can add up quickly given a very large number of employees in this BMI range. Some industries could be particularly affected, such as those with many employees in Managerial and Professional Services, as obesity-related absenteeism was shown to vary with occupation, especially among men6.
Understanding all economic costs of obesity, including lost productivity, is critical for policymakers working on obesity prevention at any level. As many obesity-focused policies are designed and implemented at the state and local levels, quantifying obesity costs at these levels is essential for informed decision-making. To date, state-level estimates of obesity-related health care costs2, 7 have been widely used to support state legislature on obesity prevention. At the same time, no state-level data is available for other costs of obesity as well as total economic burden of obesity, limiting therefore cost-benefit assessment of obesity-related policies. To address this need, our paper provides state-level estimates of obesity-attributable costs of absenteeism among working adults in the U.S.
Data and Methods
NHANES
The National Health and Nutrition Examination Survey (NHANES) is a continuous survey of the U.S. civilian, non-institutionalized population.8 Using a complex, stratified, multistage probability sampling design, NHANES provides nationally-representative data on dietary intake, health conditions, and objectively measured body weight/height. For the purposes of this paper, NHANES is useful as it includes a question on missed days of work due to health (i.e., absenteeism). We compiled data from the last five NHANES waves that assessed absenteeism: 1999–2000, 2001–2002, 2003–2004, 2005–2006, and 2007–2008.
The study population consists of full- or part-time employed adults ages 18 and above, excluding pregnant women and people classified as underweight (BMI<18.5). We also excluded observations with missing BMI values or socio-demographic covariates (n=712). The final sample included 14,975 employed adults. Only age was significantly (p<0.05) linked in a U-shaped relationship to the likelihood of having incomplete data on covariates or BMI. Other covariates and the absenteeism measure were not significantly different between participants with complete data and those excluded from analyses due to missing data. All statistical analyses accounted for the complex sampling design in NHANES. Sampling weights from the pooled data were divided by five for the number of NHANES waves.9
BRFSS
We used the Behavioral Risk Factor Surveillance System (BRFSS) in conjunction with NHANES to provide absenteeism costs of obesity in each state. The BRFSS is a random-digit telephone survey conducted by state health departments on independent probability samples of state residents ages 18 or older. It is the world’s largest ongoing telephone health system survey; containing data from more than 350, 000 adults annually. A detailed description of the BRFSS data and methodology is available elsewhere.10
This analysis used data from the latest available year of 2012 and excluded adults who were not employed (part- or full-time), pregnant women, or underweight adults, as well as participants missing data on BMI or covariates. Missing data for n=10, 332 observations were mostly due to missing BMI data (n=9, 495). All predictors (i.e., age, gender, race, education, marital status, and household income) were significantly (p<0.05) associated with the probability of missing BMI. At the same time, a sensitivity analysis using multiple imputations for BMI showed that the averaged predictions using the imputed datasets were nearly identical to the predictions from data where observations with missing BMI data were excluded. The final analytic BRFSS sample included 182, 227 participants. Weighting variables were used with all BRFSS analyses to generate state-representative estimates.
As BRFSS collects self-reported weight and height data, which are known to be subject to reporting error11, we used a correction approach to adjust for bias in these measures.12 In brief, the approach fit regression models to NHANES 2007–2008 to correlate measured weight based on self-reported weight, its square, age, and age squared, separately for each gender and race-ethnicity group. A similar model was used for self-reported height. Estimates from these models were then used to predict the bias-adjusted height and weight measures in the BRFSS data.
State-Specific Earnings Data
State-specific data on earnings from 2011 was obtained from the Integrated Public Use Microdata Series - Current Population Survey (IPUMS-CPS).13 Average earnings per state were estimated for year round full-time and part-time employees ages 18 or older. The annual wage estimates were divided by 240 (250 week days minus average 10 vacation days) in order to obtain state-specific estimates of average earnings per day of work.
Variables
Absenteeism, or absence from work due to health issues, is measured based on responses to a single NHANES question: "During the past 12 months, that is since […] of last year, about how many days did you miss work at a job or business because of an illness or injury (do not include maternity leave)?" All NHANES participants ages 16 and above were asked to answer this question, with the option to choose “does not work” or provide a number of workdays missed. Although the original response values to this question ranged from 0 to 365, the number of missed days was capped at 240 for n=38 (0.25%) participants to include only the number of workdays in a year. There is no measure of absenteeism in BRFSS.
The main predictor of absenteeism was body weight status measured as five weight categories, including normal weight (18.5<=BMI<25), overweight (25<=BMI<30), obesity I category (30<=BMI<35), obesity II category (35<=BMI<40), and obesity III category (BMI>= 40). Other predictor variables included age in years (linear and squared terms), gender, race/ethnicity, highest level of education, household income, and marital status. All variables were coded equivalently in NHANES and BRFSS, with one exception of two income categories where responses differed across the datasets. Analyses were completed for males and females combined, as no significant interactions were identified between body weight status and socio-demographic covariates, including gender, income, and race/ethnicity.
Model Estimation: Absenteeism and Body Weight Status
To estimate the difference in missed days at work between normal weight and overweight and obese employees, adjusted for relevant covariates, a negative binomial regression was fitted to the pooled NHANES data. The negative binomial model was chosen from a set of potential count data models, including Poisson, zero-inflated Poisson, negative binomial, zero-inflated negative binomial, and both Poisson and negative binomial hurdle models, based on model fit (predicted probabilities for counts) and estimated prediction error (AIC and cross-validation). Specifically, we used the NB2 negative binomial model:
Yi ~ Negative-Binomial(exp{Xiβ})
with variance function µ+α*µ2, with the over-dispersion parameter α freely estimated.14 In this model, β represents a vector of parameters to be estimated (including a constant term), Xi is a vector of covariates for the ith individual, and Yi is the outcome (i.e., days absent from work due to health in the last year) for the ith individual.
State-Level Predictions of Absenteeism Costs
The NHANES-based estimation of absenteeism and body weight status was used to make predictions for each state in the BRFSS data. The underlying assumption here is that the relative difference in absenteeism by body weight status is similar across the U.S. Predictions were performed for each state separately. This approach was chosen because, to the best of our knowledge, no data are available with state-specific measurement of absenteeism. The number of missed days at work due to health was predicted for each of the five weight categories (normal weight, overweight, and obesity I, II, and III) while holding the distributions of the socio-demographic covariates at the means to account for differences in the socio-demographic composition across states. This method is sometimes referred to as counterfactual predictions. The difference between the average predicted values of missed workdays for normal weight and obese employees was interpreted as the number of days missed at work due to obesity-related health problems. Variance estimates for the averaged predictions were obtained using the Delta method.15
Obesity-attributable absenteeism costs in each state were calculated as a product of state-specific average daily earnings and the difference in missed workdays between normal weight and obese employees (separately for obesity I, II and III categories). In addition, total costs of absenteeism among obese employees in each state were calculated by multiplying per employee cost of absenteeism by the population count of obese employees in each state. Finally, the percentage of obesity-attributable costs of absenteeism was calculated by estimating the total cost of absenteeism among all employed adults ages 18 and above (excluding underweight employees and pregnant women) and the cost of absenteeism among obese employees.
Results
Sample Characteristics
Table 1 shows the characteristics of the NHANES (N=14, 975) and BRFSS (N=182, 227) analytic samples. The estimated distributions were similar across the two weighted samples, except for some differences in the highest educational achievement (32.8% in BRFSS vs. 26.9% in NHANES for college degree or higher). The prevalence of obesity among employed adults was almost identical in the two datasets: 31.7% in the pooled NHANES 1998–2008 (measured weight/height) and 31.6% in BRFSS 2012 (bias-adjusted weight/height).
Table 1.
Sample Characteristics of NHANES and BRFSS Participants
| Sample Characteristic | NHANES 1998–2008 (n = 14,975) |
BRFSS 2012 (n=182,227) |
|---|---|---|
| Mean age, years [SE] | 40.46 (0.20) | 41.75 (0.06) |
| Men (%) | 54.3 | 54.7 |
| Race/Ethnicity, % | ||
| White | 70.4 | 66.0 |
| Hispanic | 13.3 | 14.9 |
| Black | 11.0 | 11.4 |
| Other | 5.3 | 7.7 |
| Education, % | ||
| Less than high school | 15.4 | 9.0 |
| High school diploma | 25.2 | 26.5 |
| Some college | 32.5 | 31.7 |
| College degree or higher | 26.9 | 32.8 |
| Marital status, % | ||
| Married | 56.2 | 53.7 |
| Widowed | 1.9 | 2.1 |
| Divorced/separated | 12.2 | 12.8 |
| Single | 29.8 | 31.4 |
| Household income, % | ||
| <$25,000 | 18.2 | 17.0 |
| $25,000–$54,999a | 28.9 | 23.7 |
| $55,000–$74,999b | 15.1 | 17.1 |
| >$75,000 | 32.4 | 34.4 |
| Income missing | 5.5 | 7.8 |
| Body weight status, % | ||
| Normal weight | 33.8 | 32.0 |
| Overweight | 34.5 | 36.6 |
| Obesity (I, II, III) | 31.7 | 31.6 |
| Obesity I | 18.7 | 19.2 |
| Obesity II | 8.0 | 7.8 |
| Obesity III | 5.0 | 4.6 |
NHANES interval, BRFSS interval was $25,000–$49,999
NHANES interval, BRFSS interval was $50,000–$74,999
BMI, body mass index
Normal weight, 18.5–24.99BMI; Overweight, 25.0 –29.99BMI; Obesity I, 30.0 –34.99BMI; Obesity II, 35.0 –39.99BMI; Obesity III, 40.0+ BMI.
Differences in Absenteeism across Weight Categories
Table 2 shows the parameter estimates (incident rate ratios, IRR) obtained from fitting the negative binomial model to the NHANES data. Predicted marginal means of workdays absent due to health by body weight status and incremental differences compared to normal weight employees are also reported. The difference in the expected number of missed workdays due to health between overweight and normal weight employees was small and statistically insignificant (4.48 and 4.25 missed days per year, respectively).
Table 2.
Absenteeism and Body Weight Status (NHANES 1998 to 2008)
| Body weight status | IRR | Average annual number of workdays absent due to health (95% CI) |
Additional absent workdays compared to normal weight (95% CI) |
|---|---|---|---|
| Normal weight | . | 4.25 (3.64,4.86) | . |
| Overweight | 1.053 | 4.48 (3.90,5.06) | 0.22 (−0.50,0.95) |
| Obesity I | 1.274* | 5.42 (4.50,6.34) | 1.17 (0.01,2.32) |
| Obesity II | 1.403** | 5.97 (4.84,7.09) | 1.71 (0.42,3.00) |
| Obesity III | 1.442** | 6.13 (4.78,7.48) | 1.88 (0.42,3.33) |
| N | 14,975 | ||
p<0.05;
p<0.01;
p<0.001.
Compared to normal weight and adjusted for age, gender, race/ethnicity, education, marital status, and household income.
IRR, incidence rate ratio
CI, confidence interval
BMI, body mass index
Normal weight, 18.5–24.99BMI; Overweight, 25.0 –29.99BMI; Obesity I, 30.0 –34.99BMI; Obesity II, 35.0 –39.99BMI; Obesity III, 40.0 and above BMI.
In light of the earlier literature suggesting this finding might be different for female vs. male employees, we also estimated models separately by gender. We found no significant difference in absenteeism for the overweight group compared to their normal weight counterparts in by-gender models as well., Given lack of significant difference in absenteeism of overweight and normal weight employees, we do not consider the incremental costs of absenteeism among overweight employees in further analyses and state-level predictions.
In contrast, obese employees appeared to be absent from work due to health significantly more often than normal weight peers. Employees from the Obesity I category were expected to miss 1.2 more workdays per year than normal weight employees, a 27.4% difference (p<0.05). Employees from the Obesity II category missed 40% more workdays than normal weight employees (additional 1.7 days per year, p<0.01), and employees from the Obesity III category missed 44% more days (additional 1.9 days per year, p<0.01).
State-Level Estimates of Absenteeism Costs
Using the model in Table 2 to predict the average number of absent workdays for the five weight categories produced similar results in the BRFSS data as in NHANES. The average predicted difference of additional workdays missed per year was 1.1 days (p<0.05) for Obesity I, 1.7 days (p<0.01) for Obesity II, and 1.8 days (p<0.01) for Obesity III categories, as compared to normal weight employees.
Table 3 shows annual state-level estimates of obesity-attributable absenteeism costs per employed obese adult. The expected additional annual costs per employee from the Obesity I category ranged from $174 to $289, from $256 to $424 per employee from the Obesity II category, and from $280 to $465 per employee from the Obesity III category. Overall, the U.S. average costs of absenteeism per obese employee (Obesity I, II, III) was predicted at $260 per year, which varied across states from $209 (South Dakota) to $345 (District of Columbia). The large cross-state variation in these per employee costs reflected significant differences in average daily earnings across states (Appendix 1).
Table 3.
Estimated Obesity-Attributable Costs of Absenteeism by State (BRFSS 2012)
| Employed adults ages 18 and over, annual $ per obese employee |
||||
|---|---|---|---|---|
| State | Obesity I | Obesity II | Obesity III | Total Obesity I, II, III |
| Alabama | 204 | 300 | 329 | 247 |
| Alaska | 224 | 329 | 361 | 273 |
| Arizona | 206 | 303 | 332 | 247 |
| Arkansas | 197 | 290 | 318 | 241 |
| California | 231 | 339 | 372 | 272 |
| Colorado | 226 | 333 | 364 | 268 |
| Connecticut | 266 | 390 | 428 | 317 |
| Delaware | 235 | 345 | 379 | 286 |
| District of Columbia | 289 | 424 | 465 | 345 |
| Florida | 207 | 304 | 334 | 247 |
| Georgia | 212 | 311 | 340 | 255 |
| Hawaii | 183 | 269 | 295 | 221 |
| Idaho | 188 | 276 | 303 | 224 |
| Illinois | 233 | 342 | 375 | 281 |
| Indiana | 213 | 312 | 342 | 259 |
| Iowa | 197 | 289 | 317 | 241 |
| Kansas | 203 | 299 | 327 | 248 |
| Kentucky | 205 | 301 | 329 | 250 |
| Louisiana | 204 | 299 | 328 | 252 |
| Maine | 204 | 299 | 328 | 246 |
| Maryland | 255 | 375 | 411 | 304 |
| Massachusetts | 251 | 369 | 405 | 300 |
| Michigan | 218 | 321 | 351 | 265 |
| Minnesota | 221 | 324 | 355 | 261 |
| Mississippi | 198 | 291 | 319 | 244 |
| Missouri | 210 | 309 | 339 | 257 |
| Montana | 177 | 261 | 286 | 213 |
| Nebraska | 189 | 278 | 305 | 225 |
| Nevada | 218 | 320 | 350 | 257 |
| New Hampshire | 237 | 348 | 382 | 288 |
| New Jersey | 272 | 400 | 438 | 321 |
| New Mexico | 198 | 291 | 319 | 241 |
| New York | 246 | 361 | 396 | 295 |
| North Carolina | 211 | 310 | 340 | 252 |
| North Dakota | 186 | 273 | 299 | 224 |
| Ohio | 213 | 312 | 342 | 259 |
| Oklahoma | 200 | 293 | 321 | 243 |
| Oregon | 207 | 304 | 333 | 244 |
| Pennsylvania | 225 | 331 | 362 | 275 |
| Rhode Island | 221 | 324 | 355 | 261 |
| South Carolina | 201 | 295 | 323 | 247 |
| South Dakota | 174 | 256 | 280 | 209 |
| Tennessee | 207 | 304 | 333 | 253 |
| Texas | 214 | 314 | 345 | 259 |
| Utah | 201 | 296 | 324 | 243 |
| Vermont | 197 | 289 | 317 | 234 |
| Virginia | 247 | 363 | 398 | 298 |
| Washington | 236 | 347 | 380 | 284 |
| West Virginia | 207 | 304 | 334 | 254 |
| Wisconsin | 207 | 304 | 333 | 250 |
| Wyoming | 205 | 301 | 330 | 243 |
| U.S. total | 216 | 317 | 348 | 260 |
BMI, body mass index
Obesity I, 30.0 –34.99BMI; Obesity II, 35.0 –39.99BMI; Obesity III, 40.0 and above BMI; Obesity I, II, III, 30.0 and above BMI.
Table 4 shows the total cost of obesity-attributable absenteeism for each state, which is a product of absenteeism cost per obese employee (Table 3) and the size of the employed obese population in each state (Appendix 2). The total of obesity-attributable absenteeism costs ranged across states from $14.4 million (Wyoming) to $907 million (California) per year. Overall, a U.S. total loss in productivity due to obesity-related absenteeism was estimated at $8.65 billion per year (in 2012 $s). The obesity-attributable fraction (%) in total absenteeism costs varied from 6.5% in D.C. to 12.6% in AR, with the U.S. average of 9.3%. It followed fairly closely the cross-state pattern of obesity rates among employed adults, so that states with lower (higher) than average obesity rates tended to also have a lower (higher) fraction of absenteeism costs due to obesity.
Table 4.
Estimated Total Obesity-Attributable Costs of Absenteeism by State
| Employed adults ages 18 and over | ||||
|---|---|---|---|---|
| % of absenteeism cost attributable to obesity |
Annual cost, millions $ | |||
| State | % | Point estimate | 95% CI | |
| Alabama | 10.8 | 131.1 | 45.7 | 216.4 |
| Alaska | 9.0 | 22.3 | 7.7 | 36.8 |
| Arizona | 8.7 | 143.7 | 47.6 | 239.8 |
| Arkansas | 12.6 | 96.9 | 34.6 | 159.1 |
| California | 8.3 | 906.9 | 281.5 | 1,532.3 |
| Colorado | 7.0 | 116.3 | 36.5 | 196.1 |
| Connecticut | 8.7 | 120.6 | 39.9 | 201.2 |
| Delaware | 8.9 | 29.7 | 10.6 | 48.8 |
| D.C. | 6.5 | 18.3 | 5.9 | 30.6 |
| Florida | 8.6 | 419.9 | 137.5 | 702.3 |
| Georgia | 10.0 | 285.1 | 99.3 | 470.8 |
| Hawaii | 8.2 | 31.4 | 9.1 | 53.7 |
| Idaho | 8.9 | 34.2 | 11.0 | 57.4 |
| Illinois | 9.1 | 391.4 | 135.9 | 647.0 |
| Indiana | 10.2 | 200.7 | 71.9 | 329.5 |
| Iowa | 10.3 | 93.2 | 33.6 | 152.9 |
| Kansas | 10.0 | 86.7 | 30.7 | 142.8 |
| Kentucky | 10.3 | 124.6 | 44.5 | 204.7 |
| Louisiana | 11.7 | 156.8 | 59.4 | 254.2 |
| Maine | 9.3 | 35.9 | 12.3 | 59.5 |
| Maryland | 9.2 | 216.5 | 72.0 | 360.9 |
| Massachusetts | 7.7 | 184.0 | 60.3 | 307.8 |
| Michigan | 10.3 | 297.3 | 105.1 | 489.5 |
| Minnesota | 8.6 | 161.3 | 50.9 | 271.6 |
| Mississippi | 11.2 | 89.3 | 33.2 | 145.4 |
| Missouri | 10.1 | 180.8 | 65.0 | 296.5 |
| Montana | 8.5 | 21.1 | 7.0 | 35.1 |
| Nebraska | 9.6 | 52.3 | 16.8 | 87.8 |
| Nevada | 8.4 | 68.5 | 21.3 | 115.6 |
| New Hampshire | 9.3 | 46.3 | 16.2 | 76.4 |
| New Jersey | 8.2 | 286.9 | 92.0 | 481.8 |
| New Mexico | 9.6 | 49.2 | 17.2 | 81.2 |
| New York | 8.1 | 508.1 | 171.7 | 844.5 |
| North Carolina | 9.7 | 264.2 | 87.5 | 440.9 |
| North Dakota | 10.2 | 21.2 | 7.3 | 35.2 |
| Ohio | 9.9 | 355.1 | 125.6 | 584.5 |
| Oklahoma | 10.9 | 119.5 | 41.5 | 197.4 |
| Oregon | 8.6 | 88.9 | 27.8 | 150.0 |
| Pennsylvania | 9.5 | 402.1 | 144.6 | 659.7 |
| Rhode Island | 8.5 | 28.1 | 8.9 | 47.3 |
| South Carolina | 10.8 | 142.3 | 52.5 | 232.0 |
| South Dakota | 9.5 | 21.2 | 7.1 | 35.4 |
| Tennessee | 10.6 | 195.7 | 70.1 | 321.3 |
| Texas | 9.7 | 705.7 | 247.1 | 1,164.4 |
| Utah | 8.6 | 67.9 | 22.9 | 112.9 |
| Vermont | 7.7 | 14.5 | 4.6 | 24.3 |
| Virginia | 8.9 | 271.1 | 92.9 | 449.3 |
| Washington | 8.8 | 199.1 | 66.8 | 331.4 |
| West Virginia | 10.9 | 57.5 | 20.8 | 94.1 |
| Wisconsin | 9.9 | 183.4 | 62.8 | 303.9 |
| Wyoming | 8.5 | 14.4 | 4.6 | 24.2 |
| U.S. Total | 9.3 | 8,647.4 | 2,959.5 | 14,335.4 |
CI, confidence interval
In Figure 1, the average cost per obese employee is plotted for each state, sorted from the lowest to the highest, along with the state average wages in 2012 (Panel A) and the prevalence of obesity in employed adults in 2012 (Panel B). The graphs show that absenteeism costs per obese employee are largely driven by differences in average wages. Somewhat paradoxically, higher costs often coincide with lower obesity rates since a number of states with obesity rate below the national average happen to have the highest wages (DC, CT, NJ).
Figure 1. Costs of absenteeism from work attributable to excess weight.
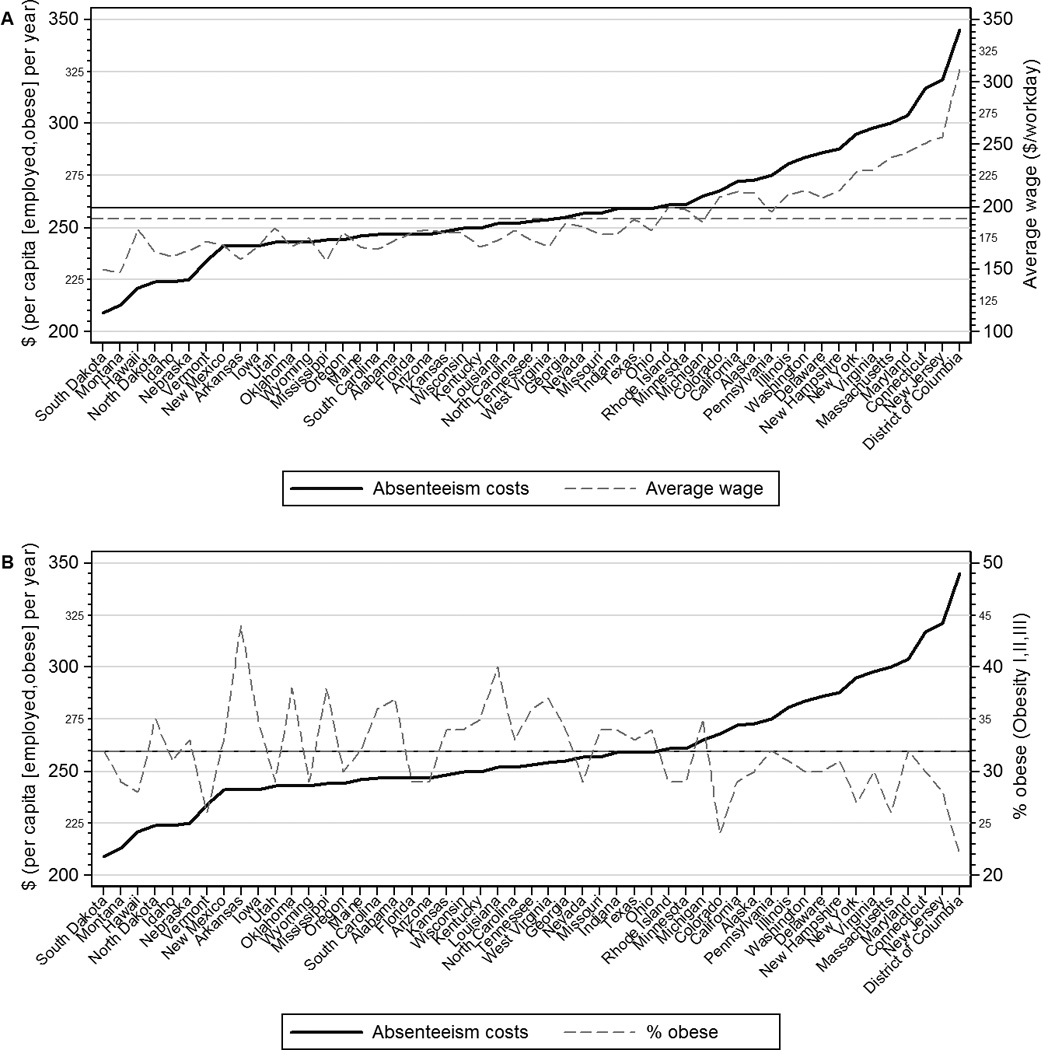
Note. The solid black line in both panels shows productivity costs (per employed obese person per year) as the predicted difference between obese and normal weight individuals by state, sorted from low to high. The grey dashed line in the top panel shows average wages for year-round employed adults and the grey dashed line in the lower panel shows obesity rates by state. Horizontal lines show US averages. Paradoxically, productivity losses are highest in states where obesity rates are relatively low with respect to the US average since these states happen to have the highest average wages.
Discussion
Our results suggest that obesity is associated with a significant increase in absenteeism among American workers, which costs the nation an estimated $8.65 billion per year. Obesity also imposes a considerable financial burden on states, accounting for 6.5%–12.6% of total costs of absenteeism in the workplace. Interestingly, these results are almost identical to the data on obesity role in health care expenditure. Specifically, we estimate that 9.3% of all absenteeism costs among American employees ages 18 and above were attributable to obesity in 2012. At the same time, obesity-related health care spending in adults was estimated at 9.1% in 2006.2 This highlights an equally important role of indirect economic costs, such as absenteeism, and the need to extend policy discussions and evaluation of initiatives beyond the direct financial drain of obesity in the health care sector.
Considered from the perspective of the past literature, our estimates fall in the wide range of previously published data on absenteeism costs of obesity in the U.S. Earlier work with data from 2002–2003 estimated that obesity-related costs of absenteeism among employed adults ages 18–65 accounted for about a third of $11.7 billion in lost productive time per year.16 In current dollars, this is equivalent to about $4.8 billion, which is within our confidence interval. An estimate from another 2004 study was, adjusted for inflation, $5.2 billion per year.6 Higher obesity rates among employed adults in the U.S. in 2012 vs. 2002–2004 might explain some of the observed cost difference. For example, around 22% of employees were obese in the earlier study16 versus over 30% in our BRFSS sample (Appendix 2).
A more recent study estimated that obesity-attributable absenteeism cost American employers $12.8 billion per year.5 This analysis relied on an internet-based consumer panel of full-time employees ages 18 and above from the proprietary 2008 U.S. National Health and Wellness Survey (NHWS). Absenteeism was measured using the question: “During the past seven days, how many hours did you miss from work because of your health problems?”, which has a considerably shorter framework than a year in our NHANES-based analysis. On the one hand, a shorter “memory span” should improve precision of responses, which could increase the reported absent time, particularly because hours of missed work are reported, not just whole days as in NHANES. On other hand, it is unclear how well one work week can represent work and productivity patterns over the entire year. There are, for example, seasonal factors that affect health of many employees and, therefore, absenteeism. In some cases, the link with obesity is probably insignificant (e.g., the flu season), but in other cases certain obesity-related conditions could become more problematic (e.g., heat waves and cardio-vascular diseases). As an aside, it is unknown how the NHWS sample compares to the nationally-representative NHANES data.
One important finding of this paper is that overweight workers appear to be similar to normal weight counterparts in terms of work time lost for a health reason. Other studies had mixed results on absenteeism among overweight employees, from no significant difference6, 16 to an annual excess above normal weight of 0.5 days for overweight men and 1.1 days among overweight women.5 This is similar to relatively mixed data on health care costs among overweight adults, with some studies (especially looking at older adults) suggesting that overweight individuals do not have significantly higher health care spending than normal weight adults.5 Nevertheless, as overweight is an intermediate state between normal weight and obesity, employers and the society at large could benefit from policies and interventions to reduce the risk of weight gain among overweight workers. This hypothesis requires further analysis.
This study did not consider another measure of reduced worker productivity, which is presenteeism. Prior research showed large costs of obesity-attributable presenteeism in the workplace.5, 16–19 In fact, presenteeism costs of obesity were estimated to be on par with obesity-related health care costs and to exceed obesity-attributable costs of absenteeism. While the total cost of absenteeism and presenteeism among U.S. obese workers was estimated as an additional $11.7 billion per year compared with normal weight workers, work lost due to presenteeism accounted for about two-thirds of this economic loss.18 In the total cost of obesity in the workplace that includes health care spending, presenteeism was shown to account for 44% of total costs among obese men and 38% among obese women.5 Our exclusive focus on absenteeism is due to lack of reliable measurement of presenteeism, particularly with data at the state level. This is an important area for future research.
Our estimation of obesity-related absenteeism costs is for currently employed population ages 18 and above. Obesity has been shown to be associated with lower possibility of being employed, particularly among women20, which we did not address within the scope of this paper. Our focus was on developing state-level estimates of obesity-attributable absenteeism costs, assuming that the relationship between the probability of employment and obesity was the same across all states. Changes in employment rates across states are driven by a large number of complex issues related to local job market characteristics, policies and regulations, as well as the larger economy. There is also evidence of systematic differences in occupations of obese and normal weight individuals, primarily among women21, which our analysis did not consider. Further investigation and longitudinal data are needed to understand the role of obesity as part of the overall wellness of the workforce in driving employment rates at the state or local level.
Our results should be interpreted in the context of several limitations. The NHANES measure of absenteeism is based on self-reports and cover a substantial time period (previous 12 months), which could affect the accuracy of responses. For example, some participants (0.25%) claimed that they were absent from work for health reasons for over 240 days per year, including 365 days. This is most likely incorrect given that weekends and holidays are not excluded from their count of workdays. Another limitation is related to lack of data on the military personnel, which are generally not part of household surveys of non-institutionalized population. We also didn’t account for the productivity lost from people who are working but not at the time of the survey, who took sick leave or short-term disability due to obesity, and individuals who make important contributions to the economy but are not employed in the traditional sense, such as students, volunteers, or homemakers. Another important note is that using overall state average earnings may overestimate average earnings for obese workers, especially women, in light of evidence that obesity is associated with low socio-economic status. Finally, our adjustment for self-report bias in BRFSS may not be perfect, since the NHANES method was based on in-person self-reports, while BRFSS is a telephone interview.
Despite of these limitations, providing estimates on the magnitude of how obesity may impact economic productivity has significant policy implications. The forgone productivity estimates represent a case for the value of investing in a healthier workforce beyond the healthcare cost implications from reducing obesity-attributable diseases. Employers are known to strategically locate in communities with skilled and healthy workers; maintaining a healthy weight and an active lifestyle, along with other indicators of a healthy community, can therefore be an indicator for a competitive workforce.
In conclusion, obesity-attributable costs of absenteeism are substantial and impose a considerable financial drain on states. Each year, the U.S. economy loses $8.65 billion in productive work time due to obesity. On top of substantial health care expenditures and other indirect costs in the workplace and elsewhere, obesity imposes a significant economic burden on the U.S. economy and society at large. Additional research is needed to understand the direct and indirect costs of obesity at the state level and to enable reliable cost-benefit analysis of state legislative proposals to address obesity. It is important to discuss further how these costs vary across employers, employees, industries, and what policies prove effective in reducing productivity losses of obesity.
Supplementary Material
Acknowledgments
Funding: The study was funded by a grant from the National Cancer Institute (Grant No. 1R01CA172814-01A1). The views expressed in this article are those of the authors and do not necessarily represent the official views of NCI or NIH.
Footnotes
Disclosure: The authors have no conflicts of interest to disclose.
References
- 1.Ogden CL, Carroll MD, Kit BK, Flegal KM. Prevalence of childhood and adult obesity in the United States, 2011–2012. JAMA. 2014;311(8):806–814. doi: 10.1001/jama.2014.732. [DOI] [PMC free article] [PubMed] [Google Scholar]
- 2.Finkelstein EA, Trogdon JG, Cohen JW, Dietz W. Annual medical spending attributable to obesity: payer- and service-specific estimates. Health Aff (Millwood) 2009;28:w822–w831. doi: 10.1377/hlthaff.28.5.w822. [DOI] [PubMed] [Google Scholar]
- 3.Janssens H, Clays E, Kittel F, De Bacquer D, Casini A, Braeckman L. The association between body mass index class, sickness absence, and presenteeism. J Occup Environ Med. 2012;54(5):604–609. doi: 10.1097/JOM.0b013e31824b2133. [DOI] [PubMed] [Google Scholar]
- 4.Trogdon JG, Finkelstein EA, Hylands T, Dellea PS, Kamal-Bahl SJ. Indirect costs of obesity: a review of the current literature. Obes Rev. 2008;9(5):489–500. doi: 10.1111/j.1467-789X.2008.00472.x. [DOI] [PubMed] [Google Scholar]
- 5.Finkelstein EA, Di Bonaventura MD, Burgess SM, Hale BC. The costs of obesity in the workplace. J Occup Environ Med. 2010;52(10):971–976. doi: 10.1097/JOM.0b013e3181f274d2. [DOI] [PubMed] [Google Scholar]
- 6.Cawley J, Rizzo JA, Haas K. Occupation-specific absenteeism costs associated with obesity and morbid obesity. J Occup Environ Med. 2007;49(12):1317–1324. doi: 10.1097/JOM.0b013e31815b56a0. [DOI] [PubMed] [Google Scholar]
- 7.Finkelstein EA, Fiebelkorn IC, Wang G. State-level estimates of annual medical expenditures attributable to obesity. Obesity. 2004;12:18–24. doi: 10.1038/oby.2004.4. [DOI] [PubMed] [Google Scholar]
- 8.Centers for Disease Control and Prevention. National Health and Nutrition Examination Survey. [Accessed March 7, 2014]; Available at: http://www.cdc.gov/NCHS/nhanes.htm.
- 9.Centers for Disease Control and Prevention. National Health and Nutrition Examination Survey: Analytic Guidelines, 2011–2012. [Last accessed March 7, 2014];2013 Available at: http://www.cdc.gov/nchs/data/nhanes/analytic_guidelines_11_12.pdf.
- 10.Centers for Disease Control and Prevention. Behavioral Risk Factor Surveillance System. [Accessed March 7, 2014]; Available at: http://www.cdc.gov/brfss/annual_data/annual_2012.html.
- 11.Rowland ML. Reporting bias in height and weight data. Statistical Bulletin. 1989;70(2):2–11. [PubMed] [Google Scholar]
- 12.Burkhauser RV, Cawley J. Beyond BMI: the value of more accurate measures of fatness and obesity in social science research. J Health Econ. 2008;27(2):519–529. doi: 10.1016/j.jhealeco.2007.05.005. [DOI] [PubMed] [Google Scholar]
- 13.Ruggles S, Alexander JT, Genadek K, Goeken R, Schroeder MB, Sobek M. Integrated Public Use Microdata Series: Version 5.0. Minneapolis: University of Minnesota; 2010. [Machine-readable database]. [Google Scholar]
- 14.Hilbe J. Negative Binomial Regression. Second Edition. Cambridge, UK: Cambridge University Press; 2011. [Google Scholar]
- 15.Casella G, Berger RL. Statistical Inference. Second Edition. Pacific Grove, CA: Duxbury; 2002. [Google Scholar]
- 16.Ricci JA, Chee E. Lost productive time associated with excess weight in the U.S. workforce. J Occup Environ Med. 2005;47:1227–1234. doi: 10.1097/01.jom.0000184871.20901.c3. [DOI] [PubMed] [Google Scholar]
- 17.Goetzel RZ, Gibson TB, Short ME, et al. A multi-worksite analysis of the relationships among body mass index, medical utilization, and worker productivity. J Occup Environ Med. 2010;52(Suppl 1):S52–S58. doi: 10.1097/JOM.0b013e3181c95b84. [DOI] [PMC free article] [PubMed] [Google Scholar]
- 18.Gates DM, Succop P, Brehm BJ, Gillespie GL, Sommers BD. Obesity and presenteeism: the impact of body mass index on workplace productivity. J Occup Environ Med. 2008;50:39–45. doi: 10.1097/JOM.0b013e31815d8db2. [DOI] [PubMed] [Google Scholar]
- 19.Loeppke R, Taitel M, Haufle V, Parry T, Kessler RC, Jinnett K. Health and productivity as a business strategy: a multiemployer study. J Occup Environ Med. 2009;51:411–428. doi: 10.1097/JOM.0b013e3181a39180. [DOI] [PubMed] [Google Scholar]
- 20.Sarlio-Lahteenkorva S, Lahelma E. The association of body mass index with social and economic disadvantage in women and men. Int J Epidemiol. 1999;28(3):445–449. doi: 10.1093/ije/28.3.445. [DOI] [PubMed] [Google Scholar]
- 21.Pagan JA, Davila A. Obesity, occupational attainment, and earnings. SocSci Q. 1997;78(3):756–770. [Google Scholar]
Associated Data
This section collects any data citations, data availability statements, or supplementary materials included in this article.