

Abstract
Top signals from genome-wide association studies (GWASs) of type 2 diabetes (T2D) are enriched with expression quantitative trait loci (eQTLs) identified in skeletal muscle and adipose tissue. We therefore hypothesized that such eQTLs might account for a disproportionate share of the heritability estimated from all SNPs interrogated through GWASs. To test this hypothesis, we applied linear mixed models to the Wellcome Trust Case Control Consortium (WTCCC) T2D data set and to data sets representing Mexican Americans from Starr County, TX, and Mexicans from Mexico City. We estimated the proportion of phenotypic variance attributable to the additive effect of all variants interrogated in these GWASs, as well as a much smaller set of variants identified as eQTLs in human adipose tissue, skeletal muscle, and lymphoblastoid cell lines. The narrow-sense heritability explained by all interrogated SNPs in each of these data sets was substantially greater than the heritability accounted for by genome-wide-significant SNPs (∼10%); GWAS SNPs explained over 50% of phenotypic variance in the WTCCC, Starr County, and Mexico City data sets. The estimate of heritability attributable to cross-tissue eQTLs was greater in the WTCCC data set and among lean Hispanics, whereas adipose eQTLs significantly explained heritability among Hispanics with a body mass index ≥ 30. These results support an important role for regulatory variants in the genetic component of T2D susceptibility, particularly for eQTLs that elicit effects across insulin-responsive peripheral tissues.
Introduction
Numerous family-based studies of disease heritability have indicated that type 2 diabetes (T2D [MIM 125853]) is strongly heritable.1–5 These results have motivated many large-scale linkage, candidate-gene, and genome-wide association studies (GWASs), which together have identified over 70 variants that significantly associate with T2D or glucose traits and replicate across studies.6–16 However, this set of variants collectively explains only a fraction of the narrow-sense heritability previously estimated from family studies (31%–69%)5 and thereby constitutes a problem of “missing heritability.”16–19 Several hypotheses, including the possibility that genetic susceptibility to T2D is driven by rare variants that are poorly interrogated through GWASs,20–24 have since been put forward to explain the missing heritability of T2D. Consequently, a number of large-scale exome and whole-genome sequencing efforts to identify such rare variants underlying T2D risk within specific populations are ongoing.25,26
Alternatively, the majority of “missing” heritability might instead be “hidden” and explained by the cumulative effect of many variants with small effect sizes.27–30 Recently, investigators have tested this hypothesis by applying linear mixed models (LMMs), which treat individual SNP effects as random effects and allow for the estimation of total additive genetic variance.31–34 The application of these models has provided evidence that GWAS-interrogated variants explain sizable portions of the missing heritability for several complex traits, such as height, fasting glucose, and Tourette syndrome (MIM 137580).31,33,35,36 Indeed, recent studies have suggested that much of the missing heritability of T2D can be accounted for by the cumulative effect of common variants effectively interrogated through GWASs and therefore support a highly polygenic architecture for T2D susceptibility.37,38 This presents a major challenge in identifying disease-related genes given that the vast majority of interrogated SNPs are in noncoding regions and only weakly influence disease risk.16,18,22 Although T2D heritability might be attributable to the combined action of many variants, we hypothesize that the variants driving susceptibility are concentrated in pathways that influence molecular processes within metabolically important tissues.
Previous studies have shown that expression quantitative trait loci (eQTLs) are highly enriched within sets of disease-associated variants.39–42 Moreover, the extent of enrichment is greater for eQTLs mapped in tissues relevant to the disease.39 Importantly, eQTLs mapped in human adipose and skeletal-muscle tissue are enriched among sets of T2D-associated SNPs, whereas eQTLs mapped in human lymphoblastoid cell lines (LCLs) exhibit no such enrichment.39,43,44 It is thus reasonable to hypothesize that at least some of the overall heritability of T2D might be attributable to variants that regulate gene expression in insulin-responsive peripheral tissues (IRPTs).
In this study, we applied LMMs to the Wellcome Trust Case Control Consortium (WTCCC) GWAS data set for T2D and to data sets including Mexican Americans from Starr County, TX, and Mexicans from Mexico City to investigate the T2D variance explained by the combined effect of common variants with individually small effects across data sets including populations with distinct ancestries. Furthermore, we leveraged information on eQTLs mapped in human adipose tissue, skeletal muscle, and LCLs to elucidate the heritability contribution from regulatory variants mapped in IRPTs.
Here, we report that for each GWAS data set, the additive effect of the total set of interrogated SNPs accounts for more heritability than estimates previously reported for GWAS-significant variants. SNP subsets composed of eQTLs mapped in skeletal muscle and subcutaneous adipose tissues and of eQTL subsets identified in multiple tissues explain higher phenotypic variance than expected given the proportion of SNPs included in the analysis. These results suggest that T2D has a highly polygenic architecture that is disproportionately driven by regulatory variants, including those active in IRPTs.
Material and Methods
Ethics Statement
All study participants who donated adipose and muscle biopsies provided written informed consent under protocols originally approved by the institutional review board at the University of Arkansas for Medical Sciences. Informed consent was obtained from each participant from Mexico City, and research was approved by the ethical research boards of the Medical Center “Siglo XXI” and the University of Toronto. Informed consent was obtained from each participant from the Starr County Health Study, and research was approved by the institutional review boards of the University of Texas Health Science Center at Houston.
GWASs and eQTL Data Sets
We analyzed genotype data from the WTCCC GWAS of T2D in 1,924 case and 2,938 control subjects.11 The data set included 469,557 SNPs genotyped on the Affymetrix GeneChip 500K Mapping Array Set and was called with the CHIAMO algorithm. SNPs showing significant departures from Hardy-Weinberg equilibrium (HWE) could inflate estimates of narrow-sense heritability.34 We therefore excluded 33,618 markers with p values < 5% from a HWE exact test. An additional set of 63,236 SNPs with a minor allele frequency (MAF) < 1% were excluded, resulting in a pruned set of 370,139 SNPs that were carried forward in our estimation of phenotypic variances explained by GWAS-interrogated SNPs. Moreover, we ensured that SNPs with genotype missingness > 1% were not included in our analyses, and therefore only SNPs with <20 missing genotypes were included.
We also analyzed two GWAS data sets of Hispanic populations of Mexican descent in this study. The first data set was previously used in a GWAS43 of T2D in a Mexican American population from Starr County, TX (SCT data set), and consisted of 837 case and 781 control subjects (Table S1, available online). As previously described,43 individuals were genotyped on the Affymetrix Genome-Wide SNP Array 6.0, and the set of typed SNPs was imputed to a HapMap2 reference panel, resulting in a set of ∼1.8 million SNPs after quality-control measures. A total set of 1,733,064 SNPs remained after we removed SNPs with HWE-departure p values < 5% and SNPs with MAF < 1%.
The second Hispanic GWAS data set came from a Mexican population from Mexico City (MCM data set) and consisted of 967 case and 343 control subjects (Table S1). Individuals were genotyped on the Affymetrix Genome-Wide SNP Array 5.0, and the set of typed SNPs was imputed to both a phased HapMap2 and an unphased HapMap3 reference panel as previously described.45 We applied the same quality-control measures we used for the WTCCC and SCT data sets to the MCM data set, and the remaining set of 2,431,591 SNPs was carried forward for heritability analyses (Table S2). In order to increase the sample size for estimation of heritability among populations of Mexican descent, we merged the imputed SCT and MCM data sets together by chromosome and applied the same MAF and HWE-departure p value thresholds as in the individual GWAS data sets. This resulted in a data set including 1,652,821 SNP genotypes (Table S2) for a total of 2,928 subjects (1,804 case and 1,124 control individuals). We applied a stringent genotype-missingness threshold of 1% in the merged Hispanic data set (and thus SNPs with >20 missing genotypes were not included in our analyses).
A set of eQTLs mapped in 90 HapMap CEU (Utah residents with ancestry from northern and western Europe from the CEPH collection) lymphoblastoid cell lines (LCLs) were acquired from the SNP and CNV Annotation (SCAN) database, an online repository that provides physical and functional annotations for SNPs, copy-number variants, and genes.46 As previously described,46 we mapped eQTLs in LCL samples by applying a family-based quantitative transmission-disequilibrium test (QTDT) to a set of more than two million SNPs with MAF > 5% in order to evaluate associations with the reliable expression of >13,000 gene transcripts measured with the Affymetrix GeneChip Human Exon 1.0 ST Array. For this study, we included all SNPs with QTDT p values < 1.0 × 10⁻⁴ in the SCAN database.
Extraction and eQTL mapping of primary human adipose and skeletal-muscle tissue are described in Elbein et al.44 In brief, samples of subcutaneous adipose tissue (extracted via needle biopsy or incision) and skeletal muscle from the vastus lateralis were extracted by Bergstrom needle biopsy from 62 individuals with ages ranging from 20 to 55 years and body mass index (BMI) ranging from 19 to 42 kg/m2. Of these 62 individuals, 40 were of European American ancestry and 22 were of African American ancestry. Genotyping was performed with the Illumina 1M platform, and RNA-expression profiling was performed with the Agilent Human Whole Genome 4 × 44 array.44 The set of typed SNPs was imputed to a HapMap2 reference panel. For each tissue, we mapped eQTLs by testing each SNP for the additive effect of allele dosage on covariate-adjusted normalized probe-level expression intensity under a linear model that included the combined set of samples from both European and African American cohorts:
where P is the normalized probe-level expression value, μ is the expected value of the probe expression intensity, R is the covariate for genetic ancestry (i.e., principal component [PC] 1), and e is the residual error term. For the eQTL-based analyses, we included SNPs with gene-expression association p values < 1.0 × 10⁻⁴.
Estimation of Phenotypic Variance Explained by GWAS SNPs
For each GWAS data set, a genetic-relatedness matrix (GRM) was calculated from the full set of autosomal SNPs (i.e., not pruned for LD) with the program Genome-wide Complex Trait Analysis (GCTA), developed by Yang et al.47 We included only SNPs with MAF > 1% in our analyses because we were interested in evaluating the heritability attributable to common SNPs. We applied a relatedness threshold () to prune pairs of individuals sharing many genes identically by descent. This ensured that effects from nongenetic factors, such as a common environment shared between close relatives, did not upwardly bias estimates of chip heritability (i.e., the proportion of phenotypic variance explained by the additive effect of GWAS-interrogated SNPs).34 The inclusion of close relatives (i.e., monozygotic twins and first-degree relatives) would dominate heritability estimates and yield results similar to those of an additive genetic model even in the absence of a shared environment.32 When a pair of individuals share more than the specified genetic relatedness, GCTA employs a parsimonious algorithm that selectively removes an individual so as to maximize the number of individuals retained in the GRM.47 No pair of subjects in the WTCCC data set shared genetic relatedness in excess of 5%, whereas a considerable number of subjects in the Hispanic data sets surpassed this threshold. The primary analyses presented here utilized all the samples in the Hispanic data set. However, the results from our heritability analyses of this data set are robust across relatedness thresholds (see below).
PC analyses (PCAs)48 were performed for each data set with the PCA method implemented in GCTA. Mexican American and Mexican individuals showing poor clustering in PC cluster plots were identified, and a GRM was recalculated without these individuals for each of the individual Hispanic data sets and the merged Hispanic data set (Figure S1).
The proportion of narrow-sense heritability explained by the additive effect of GWAS SNPs (i.e., chip heritability) was estimated with the restricted maximum-likelihood estimation (REML) method implemented in GCTA. The actual binary phenotype of T2D status was transformed to an underlying liability model in which the disease threshold was dependent upon the prevalence of T2D in each population.47 A prevalence of 8% was specified for the REML estimation of additive genetic variance in the WTCCC data set. Population disease-prevalence values of 20% and 10% were specified for the analyses of the SCT and MCM data sets, respectively (Table S2). A population prevalence of 16% was specified for heritability estimation in the merged Hispanic data set and was calculated as a weighted average of the T2D prevalence from the two samples.
Covariate Selection
LMM models including fixed effects from potential covariates for T2D (i.e., age, BMI, sex, and PCs) were evaluated for each data set with available information (Table S3). Sex and the first five PCs were included as covariates in the analysis of the WTCCC data set. Sex, age (at diagnosis for case subjects and at enrollment for control subjects), and BMI were included as covariates in the analyses of the Hispanic data sets. Moreover, differences in global ancestry can potentially confound genetic association studies in admixed populations.49 To control for these effects, we included the first ten PCs as covariates in our estimation of heritability in the SCT, MCM, and merged Hispanic data sets.
Estimation of Phenotypic Variance Explained by SNPs that Colocalize with Known T2D-Associated Variants
A set of 141 unique SNPs significantly associated with T2D was obtained from the National Human Genome Research Institute (NHGRI) online catalog of published GWAS associations. Reference sets of SNPs composed of the 141 NHGRI SNPs and all HapMap2 SNPs within 1 kb, 10 kb, 100 kb, 500 kb, and 1 Mb of each of the NHGRI SNPs were constructed. For each GWAS data set, multiple joint analyses of narrow-sense heritability involving each NHGRI SNP set were performed. The total set of GWAS SNPs was partitioned into two unique SNP subsets whereby the first subset was composed of SNPs represented in a NHGRI subset (e.g., 1 kb) and the second subset was composed of the complement set of all SNPs not present in the first subset. A GRM was calculated for each subset with the --make-grm function implemented in GCTA, and the two GRMs were then incorporated into a joint analysis of the heritability attributable to both the NHGRI SNPs and the complement set of non-NHGRI SNPs. The additive genetic variance attributed to each subset was jointly estimated with the multiple GRM (--mgrm) and REML (--reml) functions implemented in GCTA.
Estimation of Phenotypic Variance Explained by eQTL SNP Subsets
We estimated the variance explained by eQTL sets by using the following mixed-effects model:
where Y is a vector of phenotypes and b is a vector of fixed effects (e.g., PCs, BMI, etc.). Here, AT is the GRM estimated from the eQTL set T, and denotes the genetic effect attributable to the eQTL set T with variance of equal to . C is the genetic effect of the complement set of SNPs. The phenotype is modeled as the sum of these genetic effects and the relevant covariates (fixed effects) and a residual. Variances were estimated with REML. The heritability attributable to the eQTL set T was then calculated as the fraction of the phenotypic variance :
In our analysis, we estimated the heritability explained by various eQTL sets (derived from several tissues) by partitioning, in multiple analyses, the genome into disjoint sets (composed of classes of eQTLs and the complement SNP set). We did not prune SNP subsets for LD because this could result in spurious “enrichment” of heritability (see Results).
Description of eQTL Subsets Evaluated in Heritability Analyses
For convenience, we provide a brief description of eQTL subsets we evaluated in our partition analyses of T2D heritability (Figure 1): eQTLs mapped in LCL samples from HapMap2 CEU individuals, but not included in either the adipose or the skeletal-muscle eQTL sets (L); eQTLs included in the adipose eQTL reference set, but not in any other eQTL reference set (A); eQTLs in the skeletal-muscle eQTL reference set, but not in any other eQTL reference set (M); eQTLs included in both the LCL and the adipose eQTL reference sets, but not in the skeletal-muscle eQTL reference set (AL); eQTLs present in both the LCL and the skeletal-muscle eQTL reference sets, but not in the adipose eQTL reference set (ML); eQTLs represented in both the adipose and the skeletal-muscle eQTL reference sets, but not in the LCL eQTL reference set (AM); the intersection of eQTLs represented in the LCL, adipose, and skeletal-muscle reference sets (AML); and the set of eQTLs mapped in IRPTs, defined as the union of eQTL sets A ∪ M ∪ AM.
Figure 1.
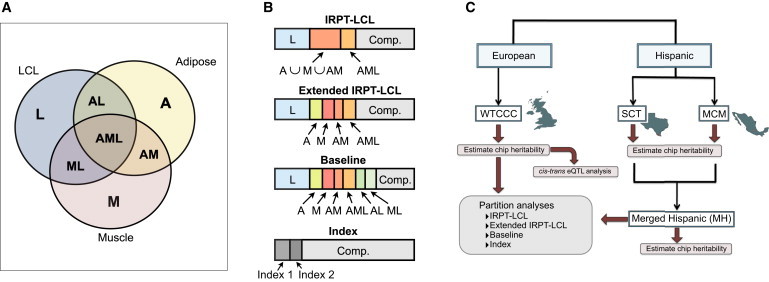
Study Overview
(A) Delineation of the eQTL subsets evaluated in the decomposition of T2D heritability.
(B) Diagram showing the constitution of each of the major partitions evaluated in this study.
(C) Schematic of the heritability analyses performed on the WTCCC, SCT, and MCM data sets.
Baseline-Subset Analysis
For this analysis, the total set of SNPs was partitioned into eight SNP subsets representing all possible disjoint eQTL sets (Figures 1A and 1B): L, A, M, AL, ML, AM, AML, and the complement set of SNPs not included in the eQTL subsets.
Analysis of IRPT versus LCL eQTLs
We sought to compare the heritability for regulatory variants identified in IRPTs as a group (A ∪ M ∪ AM) to that from eQTLs mapped in LCLs, a representative noninsulin responsive cell type. Moreover, we were interested in comparing these estimates to the heritability from eQTLs mapped across tissues (AML) in this analysis. The total set of SNPs in each GWAS data set was partitioned into nonoverlapping subsets: L, IRPT, AML, and the complement set of SNPs not included in these eQTL subsets.
Expanded Analysis of IRPT versus LCL eQTLs
This analysis was similar to the analysis of IRPT versus LCL eQTLs (IRPT-LCL analysis) with the distinction that the IRPT set was ungrouped into the A, M, and AM subsets. Alternatively, this analysis was similar to the baseline-subset analysis with the modification that the AL and ML subsets were included in the complement SNP subset. This analysis, unlike the IRPT-LCL analysis, allowed for a comparison of tissue-specific eQTLs while involving fewer subsets than the baseline-subset analysis.
Index-Subset Analysis
In order to further investigate relationships between eQTL subsets that significantly explain heritability, we performed a series of three-way partition analyses whereby we jointly estimated heritability for two “index” subsets along with the complement set of SNPs not included in either of the index subsets. For example, in the WTCCC analyses (see below), we observed that the muscle-specific and cross-tissue eQTL subsets explained disproportionate phenotypic variances relative to SNP-set proportions (Figure 3). We subsequently performed an index-subset analysis by grouping all cross-tissue eQTLs subsets (AL ∪ ML ∪ AM ∪ AML) and comparing this subset with the muscle-specific (M) and complement SNP subsets.
Figure 3.
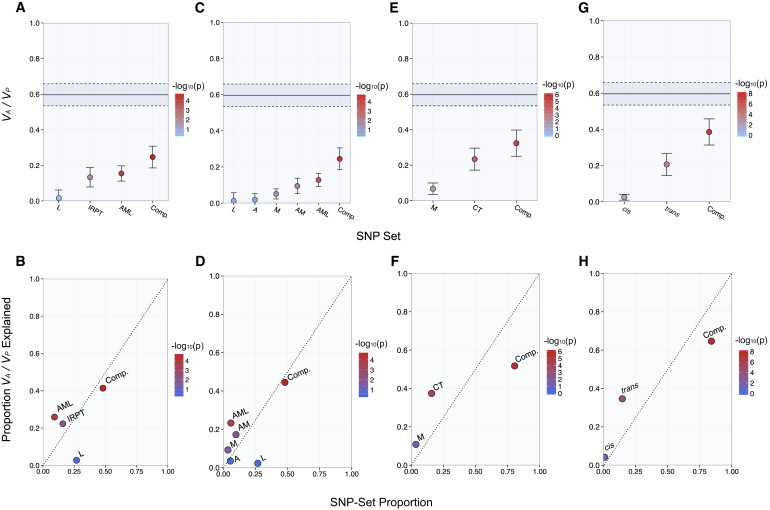
Heritability of T2D Explained by Metabolic-Tissue eQTLs in the WTCCC GWAS Data Set
The narrow-sense heritability estimates (VA / VP) attributable to nonoverlapping SNP subsets (top panels). The proportion of chip heritability explained by each subset is plotted with SNP-set proportion (bottom panels). Color is designated by the −log10 of the LRT p value, and estimates are shown with SE.
(A and B) IRPT-LCL analysis.
(C and D) Expanded IRPT-LCL analysis.
(E and F) Index-subset analysis with muscle-specific (M) and cross-tissue (CT) eQTLs as index sets.
(G and H) cis-trans analysis of cross-tissue eQTLs.
Estimation of Phenotypic Variance Explained by cis- and trans-eQTLs
In order to further delineate the eQTL subsets that explained the most phenotypic variance relative to SNP-set proportion in the WTCCC data set (i.e., cross-tissue and muscle-specific eQTLs; see Results), we partitioned according to cis and trans classification. eQTLs in each reference data set were designated as either cis or trans according to proximity to either the gene start site or the gene end site of the target transcripts. eQTLs within 4 Mb of a start or end site for a target gene were classified as cis-eQTLs, whereas eQTLs associated with genes beyond this threshold were designated as trans-eQTLs. SNPs associated with gene expression in multiple genes were classified as cis if at least one significant association was a cis association. Otherwise, a SNP was designated as a trans-eQTL.
Cross-tissue eQTLs were classified as cis-eQTLs if at least one association was a cis association. The total set of SNPs in the WTCCC data set was partitioned into three unique SNP subsets: cross-tissue cis-eQTLs, cross-tissue trans-eQTLs, and the remaining set of all SNPs not represented in the other two subsets. As in the eQTL-subset analyses described above, we calculated a GRM for each subset from the corresponding SNP genotypes and used the three GRMs to jointly estimate the heritability attributable to each subset by using REML. We performed a similar partition analysis in the WTCCC data set for skeletal-muscle-specific eQTLs.
BMI-Stratified Analysis of the Merged Hispanic Data Set
In order to evaluate T2D-heritability profiles among subjects of Mexican descent in the context of obesity, we stratified the merged Hispanic data set according to BMI whereby subjects with BMI < 30 were included in a “lean” group (997 case and 640 control subjects) and subjects with BMI ≥ 30 were included in a “nonlean” group (779 case and 475 control subjects). We performed two separate heritability analyses for each BMI-stratified group: (1) index-subset analysis (see above) with muscle-specific eQTLs (M) and cross-tissue eQTLs (AL ∪ ML ∪ AM ∪ AML) as the index subsets; and (2) index-subset analysis with adipose-specific eQTLs (A) and cross-tissue eQTLs as the index subsets. The first ten PCs were included as covariates, and the analyses were performed both with and without the inclusion of BMI as a covariate.
Permutation Analysis
In order to identify significant differences in the proportions of phenotypic variance explained by eQTL subsets, we performed a series of permutation-based analyses. For each joint heritability analysis, we investigated statistical differences in heritability estimates between subsets by defining a test statistic:
where and are the estimates of heritability attributable to SNP subsets x and y, respectively, and and are the SEs for SNP subsets x and y, respectively. We then permuted jointly the phenotype assignment and corresponding covariate values of each individual in the GWAS data set while maintaining the genotype structure. We used the permuted phenotypes to recalculate REML estimates of heritability with SE and obtained a test statistic. We repeated this process multiples times in order to generate a distribution of test statistics and obtained an empirical p value from the number of instances a permutation test statistic equaled or exceeded the observed test statistic from the nonpermuted analysis. For each joint heritability analysis in the WTCCC and Hispanic data sets, we performed a minimum of 200 phenotype permutations with REML.
In order to evaluate significant differences in heritability estimates between corresponding eQTL subsets in the lean and nonlean Hispanic cohorts, we defined the following test statistic:
where and are the estimates of heritability attributable to SNP subset x in the nonlean and lean cohorts, respectively, and and are the SEs for SNP subset x in the nonlean and lean cohorts, respectively. An empirical p value was similarly obtained from a distribution of permuted test statistics. For each intercohort comparison of eQTL heritability made between the nonlean and lean Hispanic groups, we performed 1,000 permutations.
Adjustment for Imperfect LD at Causal Variants
In order to evaluate the effect of imperfect LD between GWAS-interrogated SNPs and underlying causal variants on the observed relationships between eQTL subsets in our joint partition analyses, we applied a MAF-stratified correction to GRMs as described in Yang et al.31 The genomic relationship between individuals j and k at causal variants (Gjk) is approximated by the relatedness calculated from GWAS-interrogated SNPs (Ajk). Yang et al. determined empirically that when the MAF at causal variants is ≤θ, the regression coefficient from the regression of Gjk on Ajk is
where c depends on the MAF distribution of the causal SNPs and 1/N represents the sampling error from estimating the genetic relationship from N SNPs. We adjusted the GRM for each eQTL subset in the IRPT-LCL partition analysis with the --grm-adj function in GCTA by varying the c parameter (c = 6.2 × 10⁻⁶, 3.4 × 10⁻⁶, 1.8 × 10⁻⁶, 7.8 × 10⁻⁷, and 9.2 × 10⁻⁹ for θ = 0.1, 0.2, 0.3, 0.4, and 0.5, respectively) and estimated variances with REML.
We also considered the effect of an uneven distribution of local LD across the set of GWAS-interrogated SNPs; regions with high LD are likely to disproportionately contribute to estimates of heritability. Speed et al. proposed estimating an adjusted GRM, A∗, which is comparable to the standard GRM calculated in GCTA (A = XX′ / m′), where column Xj of the standardized genotype matrix (X) for SNP j in SNP set m is replaced by weighted vector and m′ is replaced by .50 We estimated weightings for the entire set of GWAS SNPs with the --cut-weights, --calc-weights, and --join-weights options implemented in the program LDAK (Linkage-Disequilibrium Adjusted Kinships). We then calculated adjusted GRMs for each SNP subset in the IRPT-LCL partition analysis with the --cut-kins and --calc-kins functions and applied the --partition-prefix and --partition-number (set to four) arguments to enable genomic partitioning. Estimates of heritability for each subset were calculated through REML implemented in GCTA as described above.
Figures were created in R51 with base graphics and the ggplot2 package.52
Results
Estimation of T2D Heritability Explained by GWAS SNPs
We applied an LMM method to estimate the phenotypic T2D variance explained by the additive effect of GWAS-interrogated SNPs (i.e., chip heritability) in three independent data sets: the WTCCC, SCT, MCM data sets (Figure 1A). For each of these populations, the narrow-sense heritability explained by the complete set of GWAS-interrogated SNPs was high and exceeded the range for previously reported GWAS-significant SNPs (Figure 2A; Table S2). The SE values of the heritability estimates were inversely related to sample size and thus were larger for the Hispanic data sets (Figure S3).
Figure 2.
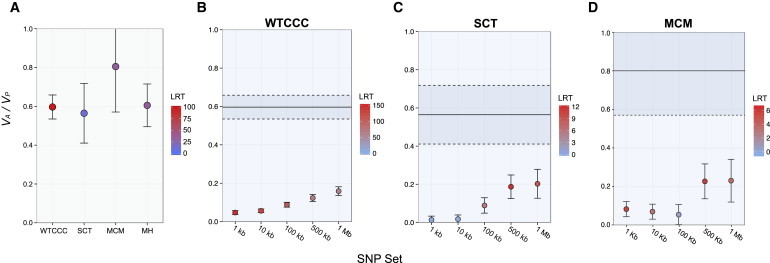
Estimates of Narrow-Sense T2D Heritability Explained by GWAS-Interrogated SNPs
(A) The REML estimates of phenotypic variance explained by the additive effect of SNPs interrogated in GWASs (VA / VP) on T2D are shown for the WTCCC, SCT, and MCM data sets.
(B–D) Heritability estimates for SNP subsets composed of T2D-associated variants from the NHGRI GWAS catalog and HapMap2 SNPs within 1 kb, 10 kb, 100 kb, 500 kb, and 1Mb are shown for the WTCCC (B), SCT (C), and MCM (D) data sets. Total chip heritability and SE for each GWAS are given by the solid and dashed black lines, respectively.
The color corresponds to the significance of each heritability estimate determined by the test statistic from the likelihood-ratio test (LRT).
To further investigate the heritability contribution from loci strongly implicated from GWASs, we referred to the NHGRI online catalog of published GWAS variants and jointly estimated the variance explained by subsets enriched with T2D-assocatied SNPs. For each GWAS data set, the significance of heritability estimates corresponding to the NHGRI subsets was high, and the explained phenotypic variance generally increased with the number of SNPs included in each subset (Figures 2B–2D; Table S4). However, in each data set, the heritability estimates attributable to subsets composed of T2D-associated SNPs were much lower than the total estimate of chip heritability (Figures 2A–2D; Tables S2 and S4).
Estimating T2D Heritability Explained by Metabolic-Tissue eQTLs in the WTCCC Data Set
Our group has previously shown that eQTLs mapped in human adipose and skeletal-muscle tissue are enriched among the set of variants that show genome-wide-significant association with T2D in populations of European and Mexican descent.43,44 We therefore hypothesized that eQTLs mapped in metabolically important tissues might also account for much of the heritability of T2D. In order to evaluate this hypothesis, we partitioned the set of GWAS-interrogated SNPs into subsets composed of eQTLs and performed joint analyses of variance components (Figures 1A–1C). We included eQTLs mapped in two IRPTs, adipose tissue, and skeletal muscle, as well as eQTLs mapped in LCLs (Table S5).
We performed an IRPT-LCL analysis (see Material and Methods) in order to compare the eQTL-derived heritability in IRPTs (i.e., adipose tissue and skeletal muscle) with that in LCLs, a representative noninsulin responsive cell type. Of the four subsets evaluated in the IRPT-LCL partition, the IRPT, AML, and complement subsets significantly explained phenotypic variance (Figure 3A; Table S6). Moreover, only the IRPT and AML subsets accounted for proportions of explained heritability that exceeded their SNP-set proportions; the AML set accounted for three times more heritability than would be expected from the number of represented SNPs (Figure 3B; Table S6). Interestingly, the LCL subset yielded a low and nonsignificant estimate of heritability despite the fact that it composed 27% of all GWAS-interrogated SNPs in the WTCCC data set (Figures 3A and 3B; Table S6). We performed a permutation-based analysis and observed that the variance explained by the IRPT eQTLs was significantly greater than the variance explained by the L subset (p < 0.01).
In order to resolve the tissue-specific contributions to the GWAS heritability estimate, we performed an expanded version of the IRPT-LCL analysis described above whereby we ungrouped the IRPT subset into the constituent A, M, and AM subsets. The subsets composed of muscle-specific eQTLs (M), cross-tissue eQTLs (AML), and complement SNPs significantly explained phenotypic variance, whereas the LCL (L) and adipose (A) subsets yielded low and nonsignificant estimates of heritability (Figure 3C; Table S7). Of these subsets, only the muscle-specific and cross-tissue eQTL subsets accounted for proportions of heritability that exceeded their SNP-set proportions (Figure 3C; Table S7). Moreover, we found that the difference in heritability estimates between the muscle-specific eQTL (M) and adipose-specific eQTL (A) subsets was significant in a permutation-based analysis (p = 0.025). However, in a separate analysis, we did not observe a significant difference between the variances explained by the M ∪ ML and A ∪ AL eQTL subsets (p = 0.72; Figure S8).
We performed a baseline-subset analysis to evaluate the phenotypic variance explained by each possible eQTL subset delineated in Figure 1B. We observed that each subset composed of cross-tissue eQTLs (i.e., AL, ML, AM, and AML) significantly explained proportions of chip heritability that exceeded their SNP-set proportions (Figure S3; Table S9).
We further investigated relationships between eQTL subsets that disproportionately explained phenotypic variance by performing an index-subset analysis (see Material and Methods) whereby we compared two index subsets along with the complement set of SNPs. For this analysis, we evaluated the muscle-specific eQTL subset (M) and a cross-tissue eQTL subset composed of eQTLs mapped in two or more tissues (AL ∪ ML ∪ AM ∪ AML). Each of the evaluated subsets significantly explained phenotypic variance, but only the muscle-specific (M) and cross-tissue eQTL subsets explained proportions of heritability that exceeded their SNP-set proportions (Figures 3E and 3F; Table S10). Moreover, the magnitude of this difference for each of these subsets was greater than a factor of 2 (Figure 3F; Table S10). Interestingly, the complement set of SNPs composed 80% of the GWAS-interrogated SNPs yet only accounted for 52% of the explained heritability (Figure 3F; Table S10).
Although the LCL-specific eQTL subset (L) did not significantly explain phenotypic variance in any of the above analyses, we performed an additional joint analysis to resolve the heritability contribution from LCL eQTLs. We estimated the variance explained by the A ∪ M ∪ AM and AL ∪ ML ∪ AML eQTL subsets and observed that both subsets significantly explained phenotypic variance and were enriched with heritability (Table S11). However, a permutation-based analysis showed that the enrichment for the A ∪ M ∪ AM subset was not significantly greater than that for the AL ∪ ML ∪ AML subset (p = 0.18). This supports a role for cross-tissue eQTLs mapped in LCLs and is consistent with the heritability enrichment observed for the AML subset.
Finally, we considered that the higher heritability attributable to cross-tissue eQTLs in this study might be due to the possibility that an eQTL mapped in two or more tissues can more robustly be classified as an eQTL. This could then explain why cross-tissue eQTL subsets consistently accounted for more heritability than the LCL eQTL subsets. However, we do not believe this to be the case given that a comparison of matched sets of highly significant LCL and cross-tissue eQTLs showed that cross-tissue eQTLs, but not LCL eQTLs, yielded significant estimates of heritability (Table S12). Taken together, these results indicate that subsets composed of muscle-specific eQTLs and cross-tissue eQTLs explain disproportionate amounts of heritability for T2D in the WTCCC data set.
Evaluating the Heritability Captured by cis- and trans-eQTLs in the WTCCC Data Set
The cross-tissue eQTL subset explained the most heritability in the WTCCC data set (see above); we therefore evaluated the respective heritability contributions from cross-tissue cis- and trans-eQTLs (see Material and Methods). Although the subset of cross-tissue cis-eQTLs accounted for a proportion of heritability that exceeded its SNP-set proportion, the REML estimate of variance was low and not significant at the 5% significance level (Figures 3G and 3H; Table S13). In contrast, the set of cross-tissue trans-eQTLs, although defined by a loose p value threshold for association with gene expression in each tissue, significantly explained most of the heritability accounted for by the total set of cross-tissue eQTLs (Figures 3G and 3H; Table S13). We observed similar results when we performed an analysis of the respective contributions of cis- and trans-eQTLs represented in the set of eQTLs specific to skeletal muscle (Figure S5; Table S14).
Estimating T2D Heritability Explained by Metabolic-Tissue eQTLs in GWAS Data Sets Representing Populations of Mexican Descent
Because heritability-partitioning analyses were unstable in the two Hispanic data sets (Tables S15–S17), we combined individuals from both data sets and merged both sets of imputed SNP genotypes to increase the sample size to nearly 3,000 subjects. The total set of GWAS-interrogated SNPs in the merged data set significantly explained 60% of the phenotypic variance in the merged Hispanic data set (Figure 2A; Table S2). We then performed an IRPT-LCL heritability analysis (see Material and Methods) and found that only the IRPT subset (A ∪ M ∪ AM) significantly explained phenotypic variance with an enrichment relative to the SNP-set proportion (Figures 4A and 4B; Table S18). We performed a permutation-based analysis to determine whether the variance explained by the IRPT subset was significantly greater than the variance explained by the LCL-specific (L) subset. Similar to our results from the corresponding WTCCC analysis, the IRPT eQTL subset significantly explained more variance than the LCL subset (p < 0.01).
Figure 4.
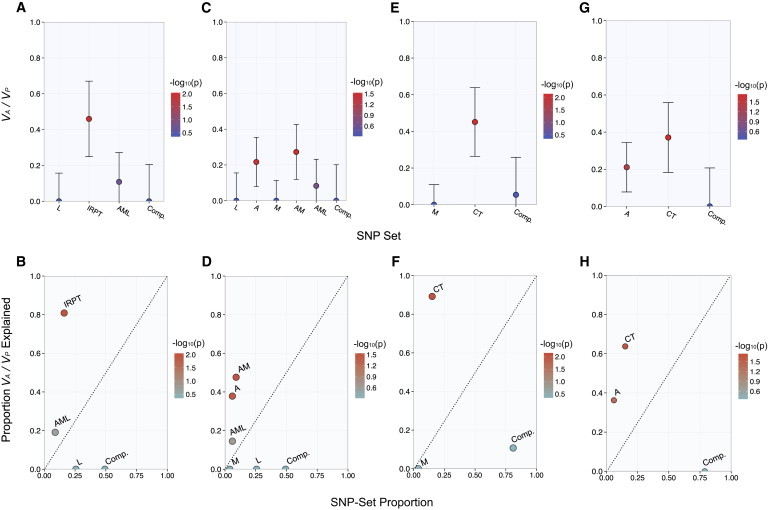
Heritability of T2D Explained by Metabolic-Tissue eQTLs in the Merged Hispanic Data Set
The narrow-sense heritability estimates (VA / VP) attributable to nonoverlapping SNP subsets (top panels). The proportion of chip heritability explained by each subset is plotted with SNP-set proportion (bottom panels). Color is designated by the −log10 of the LRT p value, and estimates are shown with SE.
(A and B) IRPT-LCL analysis.
(C and D) Expanded IRPT-LCL analysis.
(E and F) Index-subset analysis with muscle-specific (M) and cross-tissue (CT) eQTLs as index sets.
(G and H) Index-subset analysis with adipose-specific (A) and cross-tissue (CT) eQTLs as index sets.
Next, we performed an expanded IRPT-LCL analysis (see Material and Methods) to further resolve the tissue-specific contribution to heritability in the merged Hispanic data set. Adipose-specific eQTLs and cross-tissue eQTLs mapped in adipose and skeletal-muscle tissue significantly explained phenotypic variance and accounted for most of the estimated heritability (Figure 4C; Table S19). However, muscle-specific eQTLs did not significantly explain phenotypic variance in the merged Hispanic data set (Figures 4C and 4D; Table S19), and a permutation-based analysis showed that the enrichment of adipose-specific eQTLs was significantly greater than that of muscle-specific eQTLs (p < 0.01).
We performed a baseline-subset analysis (see Material and Methods) and observed that the set of eQTLs mapped in both adipose and skeletal-muscle tissue (AM), but not LCLs, disproportionately explained the most chip heritability relative to the SNP-set proportion (Figure S4; Table S20). Moreover, we corroborated that adipose-specific (A) and cross-tissue eQTLs, but not muscle-specific (M) eQTLs, significantly and disproportionately explained phenotypic variance in a set of index-subset analyses (Figures 4E–4H; Tables S21 and S22).
We performed an additional index-subset analysis and observed that the A ∪ AL subset was significantly enriched with heritability in relation to the M ∪ ML subset (p < 0.01) (Table S23). Furthermore, subsets of cross-tissue eQTLs mapped in LCLs did not contribute to heritability in the Hispanic data set, given that the AL ∪ ML ∪ AML subset did not significantly explain variance and yielded a heritability estimate that was significantly lower than that for the A ∪ M ∪ AM subset (p < 0.01) (Table S24).
Although the merged Hispanic data set was better powered to resolve heritability estimates between eQTL subsets, the heritability estimate for the complement subset in the IRPT-LCL and expanded IRPT-LCL analyses was nonsignificant with high SE. However, in a two-way partition analysis of L and complement subsets, the complement subset (including eQTLs mapped in adipose tissue and skeletal muscle) yielded a high and significant estimate of heritability (Table S25). Taken together, these results differ from the WTCCC results in that they support a greater heritability contribution from subsets composed of eQTLs mapped in human adipose tissue.
BMI-Stratified Analysis of Heritability Explained by eQTL Subsets in the Hispanic Data Set
We observed that 44% of the subjects in the merged Hispanic data set had a BMI ≥ 30. Therefore, the fact that more heritability was attributable to adipose-specific eQTLs in this data set than in the WTCCC data set might be explained by differences in the BMI distribution (Figure S6). We explored this hypothesis by first stratifying the merged Hispanic data set into a lean group composed of subjects with a BMI < 30 and a nonlean group composed of subjects with a BMI ≥ 30. Although individuals with BMI values less than 30 but greater than 25 can be considered overweight, we included them in the lean cohort to enable a more even comparison both in terms of sample size and as a contrast to obese subjects.
We performed a set of index-subset analyses in each group to compare the heritability contributions from adipose- and muscle-specific eQTLs in relation to cross-tissue eQTLs. The set of cross-tissue eQTLs consistently explained the most heritability within the lean group, whereas the heritability estimates corresponding to the muscle-specific (M) and adipose-specific (A) eQTL sets were not significant and centered on 0 (Figures 5A–5D; Tables S26 and S27). In contrast, cross-tissue eQTLs did not significantly explain phenotypic variance in the nonlean group in an index-subset analysis that included muscle-specific (M) eQTLs as an index set (Figures 5E and 5F; Table S28). Moreover, phenotypic variance was most significantly explained by the complement set of SNPs in this analysis (Figures 5E and 5F; Table S28). However, both the magnitude and the significance of the heritability estimate attributable to the complement set were considerably reduced when we jointly estimated the heritability explained by adipose-specific eQTLs (Figures 5G and 5H; Table S29). Furthermore, adipose-specific eQTLs consistently explained the most phenotypic variance within the nonlean group whether or not we included BMI as a covariate for T2D in the REML estimation of genetic variance (Figures 5G and 5H; Tables S29 and S30). All results shown in Figure 5 correspond to analyses in which we included BMI as a covariate.
Figure 5.
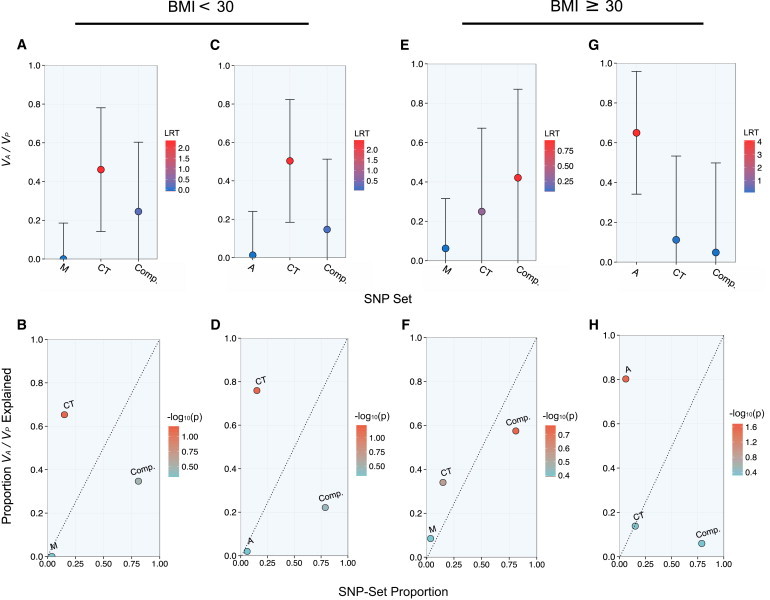
Partition of Metabolic-Tissue Heritability among Hispanics in Low- and High-BMI Subgroups
The narrow-sense heritability estimates (VA / VP) attributable to nonoverlapping SNP subsets are shown with SE and color corresponding to LRT (top panels). The proportion of chip heritability explained by each subset is plotted with SNP-set proportion and is color coded by the −log10 of the LRT p value (bottom panels). Results from an index-subset analysis with muscle-specific (M) and cross-tissue (CT) eQTLs as the index sets are shown for Hispanic subjects with a BMI < 30 (A and B) and subjects with a BMI ≥ 30 (E and F). Results from an index-subset analysis with adipose-specific (A) and cross-tissue (CT) eQTLs as the index sets are shown for Hispanic subjects with a BMI < 30 (C and D) and subjects with a BMI ≥ 30 (F and G).
Next, we performed a permutation-based analysis to evaluate the difference in enrichment by the adipose-specific eQTL subset between the two cohorts and found that the heritability explained by the adipose-specific eQTL subset in the nonlean cohort was significantly greater than that in the lean cohort (p < 0.001). Moreover, we performed a set of analysis to assess the difference in the variances explained by the A ∪ AM subset between cohorts and similarly found a greater enrichment for this subset in the nonlean cohort than in the lean cohort (p = 0.003; Table S31).
Joint Estimation of eQTL Heritability and Adjustment for Incomplete LD with Causal Variants
Imperfect LD between causal variants and tagging SNPs can affect the estimation of heritability. Thus, Yang et al. proposed a GRM adjustment that corrects for greater prediction error when the MAF distribution of causal variants deviates from that of the GWAS-interrogated SNPs.31,53 In order to determine how imperfect LD at causal loci might affect our joint analyses of heritability, we investigated our results from the IRPT-LCL analysis for both GWAS data sets by adjusting across different values of θ such that the assumed MAF at causal SNPs was MAF ≤ θ (see Material and Methods). Although the significance of the heritability estimates decreased and the SE increased with decreasing values of θ, the relationships between the eQTL subsets reported above were maintained (Figures S7 and S8).
Speed et al. proposed a weighted GRM approach that involves the calculation of local LD throughout the set of GWAS SNPs and that adjusts the GRM according to an appropriate weighting for each SNP.50 In order to investigate the effect of local LD correction on joint estimation of eQTL heritability, we incorporated this weighted GRM approach implemented in the program LDAK into our IRPT-LCL analysis in both GWAS data sets (Material and Methods). The relationships between eQTL subsets reported from this analysis were maintained (i.e., eQTLs mapped in IRPT disproportionately explained T2D heritability, whereas eQTLs mapped in LCL did not) (Figures S9 and S10; Tables S32 and S33).
Evaluation of the Robustness of eQTL Relationships
As mentioned above, we included the full set of individuals in the merged Hispanic data set in our estimation of heritability. We evaluated relatedness thresholds ranging from 5% to 20% and found no meaningful change in the total estimate of heritability, although there was, as expected, an increase in the SE with each corresponding decrease in sample size (Table S34). Moreover, we observed consistent relationships between heritability estimates in eQTL partition analyses across relatedness thresholds (Figure S11). We also observed that the relationships between eQTL subsets in the IRPT-LCL partition analysis were maintained across MAF thresholds in both the WTCCC and the Hispanic data sets (Figures S12 and S13; Tables S35 and S36).
Discussion
In this study, we found that the cumulative effect of GWAS-interrogated SNPs explained a large proportion of phenotypic variation for T2D (>50%) in the WTCCC data set and in two independent data sets representing Hispanic populations of Mexican descent (Figure 2A). Moreover, the heritability attributable to the total set of GWAS-interrogated SNPs for each GWAS data set was greater than the heritability attributable to SNP subsets enriched with previously reported T2D-associated variants (Figures 2A–2D). These results provide evidence that a considerable proportion of heritability of T2D in these data sets is driven by many SNPs that individually do not attain genome-wide significance in GWASs and therefore support a highly polygenic architecture for T2D.
We have also shown that SNP subsets composed of eQTLs mapped in IRPTs explain disproportionate heritability in these data sets. Our results showing differences between the partitioning of heritability by adipose eQTLs between the WTCCC and Hispanic data sets, and between leaner and more obese subjects within the Hispanic data set, might reflect disparate genetic architectures for T2D in which inherited variants underlying disease susceptibility among lean individuals are distinct from those contributing to risk among obese subjects. Indeed, large-scale GWASs on T2D stratified by BMI have identified numerous loci that significantly associate with T2D among lean individuals, but not obese individuals.54
Previous studies have shown that when total sets of GWAS-interrogated SNPs are partitioned by chromosome, larger SNP subsets corresponding with longer chromosomes explain more phenotypic variance than smaller subsets.36,55 However, we did not observe a similar relationship between SNP-set proportion and proportion of explained heritability for the eQTL subsets in our study. As a class of variants, eQTLs share a set of characteristics (e.g., allele-frequency distribution, proximity to genes). Therefore, eQTLs mapped in LCL samples enable a more meaningful comparison with adipose and skeletal-muscle eQTLs than a random set of SNPs simply matched for MAF. Notably, the LCL eQTL subset consistently composed approximately 25% of the total SNPs across data sets yet accounted for much less heritability and yielded nonsignificant heritability estimates (Figures 3A–3D and 4A–4D). We considered the possibility that observed differences in heritability estimates might be attributable to differences in the properties of SNP subsets independently of eQTL associations. Notably, the permutation-based analyses we conducted preserved both the MAF and the LD properties of the SNPs. Therefore, in these permutation studies, the relationships between heritability estimates attributable to eQTL subsets were robust to any differences in the SNP properties of eQTLs. These results suggest that heritability can be highly “concentrated” by small subsets of variants that influence gene expression in tissues relevant to T2D.
The fact that eQTLs mapped in Europeans and African Americans “concentrated” heritability in Hispanics suggests that at least a proportion of these variants are functionally relevant in Hispanics and can be considered cross-population eQTLs. Recently, Marten et al. reported that eQTLs previously mapped in LCLs exhibited similar effects across samples from seven different populations represented in the Human Genome Diversity Panel.56 Although some eQTLs might be highly population specific, we could not ascertain such eQTLs in the Hispanic data set because comprehensive eQTL mapping has not been reported for these samples or others of Mexican descent. Thus, heritability estimates reported in this study might be a lower bound for the heritability that might be attributable to eQTLs mapped in these tissues in individuals of Mexican ancestry.
It is important to note that a significant correlation between genome-wide ancestry and T2D has not been observed in the Starr County population.43 In contrast, a strong correlation between PC 1 and T2D has been previously reported in the MCM data set. However, the control individuals in the MCM study had greater European ancestry that was strongly confounded by socioeconomic status (SES).43,45 Moreover, a relationship between SES and T2D has not been observed in the Starr County study because there is much less variability in SES among subjects in the SCT data set than among subjects in the MCM data set. Therefore, even though we observed a significant effect from PC 1 in the merged Hispanic data set (p < 2 × 10⁻¹⁶ from a regression of T2D on PC 1), we cannot conclude that this was driven by differences in genetic ancestry between case and control individuals.
In this study, we evaluated T2D variance explained by eQTLs mapped in IRPTs. This approach differs from a genetic-correlation analysis of T2D and gene expression in that the former tests functional classes of inherited variants and the latter constitutes a gene-based study. Our study provides insight into the overall genetic architecture of T2D susceptibility and prioritizes tissues for expression-based analyses. Therefore, these study designs are complementary approaches that yield distinct information.
A straightforward interpretation of these results suggests that eQTLs regulating gene expression in skeletal muscle and adipose tissues are important drivers of T2D heritability. Indeed, skeletal muscle is an important IRPT that plays a predominant role in the postprandial insulin response.57 Moreover, increased secretion of free fatty acids from adipocytes can promote T2D pathogenesis by promoting hepatic gluconeogenesis, insulin resistance in peripheral tissues, and impaired insulin secretion from pancreatic β-cells.58–60 However, it is possible that many of the eQTLs considered tissue specific in this study might also influence gene expression in other key metabolic tissues, such as the liver or pancreatic islet. Similarly, some of the heritability attributed to trans-eQTLs might be secondary to cis-regulatory effects in tissues that could not be included in this analysis. Therefore, the eQTL contribution to T2D heritability observed in this study could be attributable to biologic effects in tissues not evaluated here. In order to better resolve variation driving disease susceptibility within and across populations, it will be important to extend studies of T2D heritability and include regulatory variants mapped in a more comprehensive collection of tissues.61
Partitioning heritability by eQTL classes also provides an avenue for identifying genes and pathways that are relevant to disease susceptibility and that might complement current practices for implicating disease-associated genes from associated loci. As previously reported, the majority of trait-associated variants for T2D and other complex diseases are located in noncoding regions, such as intergenic sites.17,18 This complicates interpretability, and investigators often report the gene most proximal to the associated variant as the putative disease-associated gene. However, it is possible that trait-associated variants occupy enhancer elements that modulate the expression of genes distal to the associated loci. For example, noncoding variants within introns of FTO (MIM 610966) strongly associate with obesity (MIM 601665) and have replicated across multiple studies.62 However, recent molecular studies have provided evidence that the obesity-associated intronic sequences within FTO function as long-range enhancers of the homeobox gene IRX3 (MIM 612985) and increase IRX3, but not FTO, expression in the human brain.63 Moreover, the dramatic weight reduction observed in Irx3-deficient mice corroborates a direct relationship between IRX3 expression and body-fat composition.63 Incorporating eQTL information into studies of heritability not only can provide insight into the relative contribution of tissue-specific regulatory variation to disease susceptibility but also might help implicate genes while eschewing assumptions based on proximity.
Acknowledgments
This work was supported by NIH grants R01 HL102830 (C.L.H.), U01 DK085501 (C.L.H.), R01 MH101820 (N.J.C.), R01 MH090937 (N.J.C), P30 DK020595 (G.I.B), and F31 DK101202 (J.M.T). In Mexico, this work was supported by the Fondo Sectorial de Investigación en Salud y Seguridad Social (SSA/IMSS/ISSSTE-CONACYT, project 150352), and M.C. is a recipient of the Fundación Instituto Mexicano del Seguro Social Scholarship. E.J.P. was supported by an operating grant from the Canadian Institutes of Health Research and the Banting and Best Diabetes Centre. Genotyping services were provided by the Center for Inherited Disease Research, funded through a federal contract (HHSN268200782096C) from the NIH to the Johns Hopkins University. We thank Lea K. Davis, Hae Kyung Im, and Anna Plushnikov for insightful comments and suggestions regarding heritability partitioning. We also thank Graeme I. Bell, David Carmody, and Honggang Ye for useful discussions regarding analyses of type 2 diabetes in the Mexican American and Mexican data sets.
Supplemental Data
Web Resources
The URLs for data presented herein are as follows:
Genome-wide Complex Trait Analysis (GCTA), http://www.complextraitgenomics.com/software/gcta/
Linkage-Disequilibrium Adjusted Kinships (LDAK), http://www.ldak.org
NHGRI Catalog of Published Genome-Wide Association Studies, http://www.genome.gov/gwastudies
Online Mendelian Inheritance in Man (OMIM), http://www.omim.org
The R Project for Statistical Computing, http://www.r-project.org
SNP and CNV Annotation (SCAN) Database, http://www.scandb.org
References
- 1.Poulsen P., Kyvik K.O., Vaag A., Beck-Nielsen H. Heritability of type II (non-insulin-dependent) diabetes mellitus and abnormal glucose tolerance—a population-based twin study. Diabetologia. 1999;42:139–145. doi: 10.1007/s001250051131. [DOI] [PubMed] [Google Scholar]
- 2.Kaprio J., Tuomilehto J., Koskenvuo M., Romanov K., Reunanen A., Eriksson J., Stengård J., Kesäniemi Y.A. Concordance for type 1 (insulin-dependent) and type 2 (non-insulin-dependent) diabetes mellitus in a population-based cohort of twins in Finland. Diabetologia. 1992;35:1060–1067. doi: 10.1007/BF02221682. [DOI] [PubMed] [Google Scholar]
- 3.Newman B., Selby J.V., King M.C., Slemenda C., Fabsitz R., Friedman G.D. Concordance for type 2 (non-insulin-dependent) diabetes mellitus in male twins. Diabetologia. 1987;30:763–768. doi: 10.1007/BF00275741. [DOI] [PubMed] [Google Scholar]
- 4.Lyssenko V., Almgren P., Anevski D., Perfekt R., Lahti K., Nissén M., Isomaa B., Forsen B., Homström N., Saloranta C., Botnia study group Predictors of and longitudinal changes in insulin sensitivity and secretion preceding onset of type 2 diabetes. Diabetes. 2005;54:166–174. doi: 10.2337/diabetes.54.1.166. [DOI] [PubMed] [Google Scholar]
- 5.Almgren P., Lehtovirta M., Isomaa B., Sarelin L., Taskinen M.R., Lyssenko V., Tuomi T., Groop L., Botnia Study Group Heritability and familiality of type 2 diabetes and related quantitative traits in the Botnia Study. Diabetologia. 2011;54:2811–2819. doi: 10.1007/s00125-011-2267-5. [DOI] [PubMed] [Google Scholar]
- 6.Reynisdottir I., Thorleifsson G., Benediktsson R., Sigurdsson G., Emilsson V., Einarsdottir A.S., Hjorleifsdottir E.E., Orlygsdottir G.T., Bjornsdottir G.T., Saemundsdottir J. Localization of a susceptibility gene for type 2 diabetes to chromosome 5q34-q35.2. Am. J. Hum. Genet. 2003;73:323–335. doi: 10.1086/377139. [DOI] [PMC free article] [PubMed] [Google Scholar]
- 7.Horikawa Y., Oda N., Cox N.J., Li X., Orho-Melander M., Hara M., Hinokio Y., Lindner T.H., Mashima H., Schwarz P.E. Genetic variation in the gene encoding calpain-10 is associated with type 2 diabetes mellitus. Nat. Genet. 2000;26:163–175. doi: 10.1038/79876. [DOI] [PubMed] [Google Scholar]
- 8.Gloyn A.L., Hashim Y., Ashcroft S.J., Ashfield R., Wiltshire S., Turner R.C., UK Prospective Diabetes Study (UKPDS 53) Association studies of variants in promoter and coding regions of beta-cell ATP-sensitive K-channel genes SUR1 and Kir6.2 with Type 2 diabetes mellitus (UKPDS 53) Diabet. Med. 2001;18:206–212. doi: 10.1046/j.1464-5491.2001.00449.x. [DOI] [PubMed] [Google Scholar]
- 9.Frayling T.M., Hattersley A.T., McCarthy A., Holly J., Mitchell S.M.S., Gloyn A.L., Owen K., Davies D., Smith G.D., Ben-Shlomo Y. A putative functional polymorphism in the IGF-I gene: association studies with type 2 diabetes, adult height, glucose tolerance, and fetal growth in U.K. populations. Diabetes. 2002;51:2313–2316. doi: 10.2337/diabetes.51.7.2313. [DOI] [PubMed] [Google Scholar]
- 10.Altshuler D., Hirschhorn J.N., Klannemark M., Lindgren C.M., Vohl M.C., Nemesh J., Lane C.R., Schaffner S.F., Bolk S., Brewer C. The common PPARgamma Pro12Ala polymorphism is associated with decreased risk of type 2 diabetes. Nat. Genet. 2000;26:76–80. doi: 10.1038/79216. [DOI] [PubMed] [Google Scholar]
- 11.Wellcome Trust Case Control Consortium Genome-wide association study of 14,000 cases of seven common diseases and 3,000 shared controls. Nature. 2007;447:661–678. doi: 10.1038/nature05911. [DOI] [PMC free article] [PubMed] [Google Scholar]
- 12.Sladek R., Rocheleau G., Rung J., Dina C., Shen L., Serre D., Boutin P., Vincent D., Belisle A., Hadjadj S. A genome-wide association study identifies novel risk loci for type 2 diabetes. Nature. 2007;445:881–885. doi: 10.1038/nature05616. [DOI] [PubMed] [Google Scholar]
- 13.Voight B.F., Scott L.J., Steinthorsdottir V., Morris A.P., Dina C., Welch R.P., Zeggini E., Huth C., Aulchenko Y.S., Thorleifsson G., MAGIC investigators. GIANT Consortium Twelve type 2 diabetes susceptibility loci identified through large-scale association analysis. Nat. Genet. 2010;42:579–589. doi: 10.1038/ng.609. [DOI] [PMC free article] [PubMed] [Google Scholar]
- 14.Zeggini E., Weedon M.N., Lindgren C.M., Frayling T.M., Elliott K.S., Lango H., Timpson N.J., Perry J.R.B., Rayner N.W., Freathy R.M., Wellcome Trust Case Control Consortium (WTCCC) Replication of genome-wide association signals in UK samples reveals risk loci for type 2 diabetes. Science. 2007;316:1336–1341. doi: 10.1126/science.1142364. [DOI] [PMC free article] [PubMed] [Google Scholar]
- 15.Scott L.J., Mohlke K.L., Bonnycastle L.L., Willer C.J., Li Y., Duren W.L., Erdos M.R., Stringham H.M., Chines P.S., Jackson A.U. A genome-wide association study of type 2 diabetes in Finns detects multiple susceptibility variants. Science. 2007;316:1341–1345. doi: 10.1126/science.1142382. [DOI] [PMC free article] [PubMed] [Google Scholar]
- 16.Sanghera D.K., Blackett P.R. Type 2 diabetes genetics: beyond GWAS. J Diabetes Metab. 2012;3:e1000198. doi: 10.4172/2155-6156.1000198. [DOI] [PMC free article] [PubMed] [Google Scholar]
- 17.Manolio T.A., Collins F.S., Cox N.J., Goldstein D.B., Hindorff L.A., Hunter D.J., McCarthy M.I., Ramos E.M., Cardon L.R., Chakravarti A. Finding the missing heritability of complex diseases. Nature. 2009;461:747–753. doi: 10.1038/nature08494. [DOI] [PMC free article] [PubMed] [Google Scholar]
- 18.Billings L.K., Florez J.C. The genetics of type 2 diabetes: what have we learned from GWAS? Ann. N Y Acad. Sci. 2010;1212:59–77. doi: 10.1111/j.1749-6632.2010.05838.x. [DOI] [PMC free article] [PubMed] [Google Scholar]
- 19.Imamura M., Maeda S. Genetics of type 2 diabetes: the GWAS era and future perspectives [Review] Endocr. J. 2011;58:723–739. doi: 10.1507/endocrj.ej11-0113. [DOI] [PubMed] [Google Scholar]
- 20.Eichler E.E., Flint J., Gibson G., Kong A., Leal S.M., Moore J.H., Nadeau J.H. Missing heritability and strategies for finding the underlying causes of complex disease. Nat. Rev. Genet. 2010;11:446–450. doi: 10.1038/nrg2809. [DOI] [PMC free article] [PubMed] [Google Scholar]
- 21.Dickson S.P., Wang K., Krantz I., Hakonarson H., Goldstein D.B. Rare variants create synthetic genome-wide associations. PLoS Biol. 2010;8:e1000294. doi: 10.1371/journal.pbio.1000294. [DOI] [PMC free article] [PubMed] [Google Scholar]
- 22.Ridderstråle M., Groop L. Genetic dissection of type 2 diabetes. Mol. Cell. Endocrinol. 2009;297:10–17. doi: 10.1016/j.mce.2008.10.002. [DOI] [PubMed] [Google Scholar]
- 23.Gibson G. Rare and common variants: twenty arguments. Nat. Rev. Genet. 2011;13:135–145. doi: 10.1038/nrg3118. [DOI] [PMC free article] [PubMed] [Google Scholar]
- 24.Groop L., Pociot F. Genetics of diabetes—are we missing the genes or the disease? Mol. Cell. Endocrinol. 2014;382:726–739. doi: 10.1016/j.mce.2013.04.002. [DOI] [PubMed] [Google Scholar]
- 25.Lohmueller K.E., Sparsø T., Li Q., Andersson E., Korneliussen T., Albrechtsen A., Banasik K., Grarup N., Hallgrimsdottir I., Kiil K. Whole-exome sequencing of 2,000 Danish individuals and the role of rare coding variants in type 2 diabetes. Am. J. Hum. Genet. 2013;93:1072–1086. doi: 10.1016/j.ajhg.2013.11.005. [DOI] [PMC free article] [PubMed] [Google Scholar]
- 26.Huang K., Nair A.K., Muller Y.L., Piaggi P., Bian L., Del Rosario M., Knowler W.C., Kobes S., Hanson R.L., Bogardus C., Baier L.J. Whole exome sequencing identifies variation in CYB5A and RNF10 associated with adiposity and type 2 diabetes. Obesity (Silver Spring) 2014;22:984–988. doi: 10.1002/oby.20647. [DOI] [PMC free article] [PubMed] [Google Scholar]
- 27.Purcell S.M., Wray N.R., Stone J.L., Visscher P.M., O’Donovan M.C., Sullivan P.F., Sklar P., International Schizophrenia Consortium Common polygenic variation contributes to risk of schizophrenia and bipolar disorder. Nature. 2009;460:748–752. doi: 10.1038/nature08185. [DOI] [PMC free article] [PubMed] [Google Scholar]
- 28.Visscher P.M., McEvoy B., Yang J. From Galton to GWAS: quantitative genetics of human height. Genet. Res. 2010;92:371–379. doi: 10.1017/S0016672310000571. [DOI] [PubMed] [Google Scholar]
- 29.Gibson G. Hints of hidden heritability in GWAS. Nat. Genet. 2010;42:558–560. doi: 10.1038/ng0710-558. [DOI] [PubMed] [Google Scholar]
- 30.Park J.H., Wacholder S., Gail M.H., Peters U., Jacobs K.B., Chanock S.J., Chatterjee N. Estimation of effect size distribution from genome-wide association studies and implications for future discoveries. Nat. Genet. 2010;42:570–575. doi: 10.1038/ng.610. [DOI] [PMC free article] [PubMed] [Google Scholar]
- 31.Yang J., Benyamin B., McEvoy B.P., Gordon S., Henders A.K., Nyholt D.R., Madden P.A., Heath A.C., Martin N.G., Montgomery G.W. Common SNPs explain a large proportion of the heritability for human height. Nat. Genet. 2010;42:565–569. doi: 10.1038/ng.608. [DOI] [PMC free article] [PubMed] [Google Scholar]
- 32.Visscher P.M., Yang J., Goddard M.E. A commentary on ‘common SNPs explain a large proportion of the heritability for human height’ by Yang et al. (2010) Twin Res. Hum. Genet. 2010;13:517–524. doi: 10.1375/twin.13.6.517. [DOI] [PubMed] [Google Scholar]
- 33.Lee S.H., DeCandia T.R., Ripke S., Yang J., Sullivan P.F., Goddard M.E., Keller M.C., Visscher P.M., Wray N.R., Schizophrenia Psychiatric Genome-Wide Association Study Consortium (PGC-SCZ) International Schizophrenia Consortium (ISC) Molecular Genetics of Schizophrenia Collaboration (MGS) Estimating the proportion of variation in susceptibility to schizophrenia captured by common SNPs. Nat. Genet. 2012;44:247–250. doi: 10.1038/ng.1108. [DOI] [PMC free article] [PubMed] [Google Scholar]
- 34.Lee S.H., Wray N.R., Goddard M.E., Visscher P.M. Estimating missing heritability for disease from genome-wide association studies. Am. J. Hum. Genet. 2011;88:294–305. doi: 10.1016/j.ajhg.2011.02.002. [DOI] [PMC free article] [PubMed] [Google Scholar]
- 35.Vattikuti S., Guo J., Chow C.C. Heritability and genetic correlations explained by common SNPs for metabolic syndrome traits. PLoS Genet. 2012;8:e1002637. doi: 10.1371/journal.pgen.1002637. [DOI] [PMC free article] [PubMed] [Google Scholar]
- 36.Davis L.K., Yu D., Keenan C.L., Gamazon E.R., Konkashbaev A.I., Derks E.M., Neale B.M., Yang J., Lee S.H., Evans P. Partitioning the heritability of Tourette syndrome and obsessive compulsive disorder reveals differences in genetic architecture. PLoS Genet. 2013;9:e1003864. doi: 10.1371/journal.pgen.1003864. [DOI] [PMC free article] [PubMed] [Google Scholar]
- 37.Stahl E.A., Wegmann D., Trynka G., Gutierrez-Achury J., Do R., Voight B.F., Kraft P., Chen R., Kallberg H.J., Kurreeman F.A.S., Diabetes Genetics Replication and Meta-analysis Consortium. Myocardial Infarction Genetics Consortium Bayesian inference analyses of the polygenic architecture of rheumatoid arthritis. Nat. Genet. 2012;44:483–489. doi: 10.1038/ng.2232. [DOI] [PMC free article] [PubMed] [Google Scholar]
- 38.Morris A.P., Voight B.F., Teslovich T.M., Ferreira T., Segrè A.V., Steinthorsdottir V., Strawbridge R.J., Khan H., Grallert H., Mahajan A., Wellcome Trust Case Control Consortium. Meta-Analyses of Glucose and Insulin-related traits Consortium (MAGIC) Investigators. Genetic Investigation of ANthropometric Traits (GIANT) Consortium. Asian Genetic Epidemiology Network–Type 2 Diabetes (AGEN-T2D) Consortium. South Asian Type 2 Diabetes (SAT2D) Consortium. DIAbetes Genetics Replication And Meta-analysis (DIAGRAM) Consortium Large-scale association analysis provides insights into the genetic architecture and pathophysiology of type 2 diabetes. Nat. Genet. 2012;44:981–990. doi: 10.1038/ng.2383. [DOI] [PMC free article] [PubMed] [Google Scholar]
- 39.Nicolae D.L., Gamazon E., Zhang W., Duan S., Dolan M.E., Cox N.J. Trait-associated SNPs are more likely to be eQTLs: annotation to enhance discovery from GWAS. PLoS Genet. 2010;6:e1000888. doi: 10.1371/journal.pgen.1000888. [DOI] [PMC free article] [PubMed] [Google Scholar]
- 40.Nica A.C., Montgomery S.B., Dimas A.S., Stranger B.E., Beazley C., Barroso I., Dermitzakis E.T. Candidate causal regulatory effects by integration of expression QTLs with complex trait genetic associations. PLoS Genet. 2010;6:e1000895. doi: 10.1371/journal.pgen.1000895. [DOI] [PMC free article] [PubMed] [Google Scholar]
- 41.Hernandez D.G., Nalls M.A., Moore M., Chong S., Dillman A., Trabzuni D., Gibbs J.R., Ryten M., Arepalli S., Weale M.E. Integration of GWAS SNPs and tissue specific expression profiling reveal discrete eQTLs for human traits in blood and brain. Neurobiol. Dis. 2012;47:20–28. doi: 10.1016/j.nbd.2012.03.020. [DOI] [PMC free article] [PubMed] [Google Scholar]
- 42.Gamazon, E.R., Im, H.K., and Liu, C., Nicolae, D.L., and Cox, N.J.; Bipolar Disorder Genome Study (BiGS) (2013). The convergence of eQTL mapping, heritability estimation and polygenic modeling: emerging spectrum of risk variation in bipolar disorder. arXiv, arXiv:1303.6227, http://arxiv.org/abs/1303.6227.
- 43.Below J.E., Gamazon E.R., Morrison J.V., Konkashbaev A., Pluzhnikov A., McKeigue P.M., Parra E.J., Elbein S.C., Hallman D.M., Nicolae D.L. Genome-wide association and meta-analysis in populations from Starr County, Texas, and Mexico City identify type 2 diabetes susceptibility loci and enrichment for expression quantitative trait loci in top signals. Diabetologia. 2011;54:2047–2055. doi: 10.1007/s00125-011-2188-3. [DOI] [PMC free article] [PubMed] [Google Scholar]
- 44.Elbein S.C., Gamazon E.R., Das S.K., Rasouli N., Kern P.A., Cox N.J. Genetic risk factors for type 2 diabetes: a trans-regulatory genetic architecture? Am. J. Hum. Genet. 2012;91:466–477. doi: 10.1016/j.ajhg.2012.08.002. [DOI] [PMC free article] [PubMed] [Google Scholar]
- 45.Parra E.J., Below J.E., Krithika S., Valladares A., Barta J.L., Cox N.J., Hanis C.L., Wacher N., Garcia-Mena J., Hu P., Diabetes Genetics Replication and Meta-analysis (DIAGRAM) Consortium Genome-wide association study of type 2 diabetes in a sample from Mexico City and a meta-analysis of a Mexican-American sample from Starr County, Texas. Diabetologia. 2011;54:2038–2046. doi: 10.1007/s00125-011-2172-y. [DOI] [PMC free article] [PubMed] [Google Scholar]
- 46.Gamazon E.R., Zhang W., Konkashbaev A., Duan S., Kistner E.O., Nicolae D.L., Dolan M.E., Cox N.J. SCAN: SNP and copy number annotation. Bioinformatics. 2010;26:259–262. doi: 10.1093/bioinformatics/btp644. [DOI] [PMC free article] [PubMed] [Google Scholar]
- 47.Yang J., Lee S.H., Goddard M.E., Visscher P.M. GCTA: a tool for genome-wide complex trait analysis. Am. J. Hum. Genet. 2011;88:76–82. doi: 10.1016/j.ajhg.2010.11.011. [DOI] [PMC free article] [PubMed] [Google Scholar]
- 48.Price A.L., Patterson N.J., Plenge R.M., Weinblatt M.E., Shadick N.A., Reich D. Principal components analysis corrects for stratification in genome-wide association studies. Nat. Genet. 2006;38:904–909. doi: 10.1038/ng1847. [DOI] [PubMed] [Google Scholar]
- 49.Tian C., Gregersen P.K., Seldin M.F. Accounting for ancestry: population substructure and genome-wide association studies. Hum. Mol. Genet. 2008;17(R2):R143–R150. doi: 10.1093/hmg/ddn268. [DOI] [PMC free article] [PubMed] [Google Scholar]
- 50.Speed D., Hemani G., Johnson M.R., Balding D.J. Improved heritability estimation from genome-wide SNPs. Am. J. Hum. Genet. 2012;91:1011–1021. doi: 10.1016/j.ajhg.2012.10.010. [DOI] [PMC free article] [PubMed] [Google Scholar]
- 51.R Development Core Team . R Foundation for Statistical Computing; Vienna: 2011. R: A Language and Environment for Statistical Computing. [Google Scholar]
- 52.Wickham H. Springer; New York: 2009. ggplot2: Elegant Graphics for Data Analysis. [Google Scholar]
- 53.Yang J., Lee S.H., Goddard M.E., Visscher P.M. Genome-wide complex trait analysis (GCTA): methods, data analyses, and interpretations. Methods Mol. Biol. 2013;1019:215–236. doi: 10.1007/978-1-62703-447-0_9. [DOI] [PubMed] [Google Scholar]
- 54.Perry J.R.B., Voight B.F., Yengo L., Amin N., Dupuis J., Ganser M., Grallert H., Navarro P., Li M., Qi L., MAGIC. DIAGRAM Consortium. GIANT Consortium Stratifying type 2 diabetes cases by BMI identifies genetic risk variants in LAMA1 and enrichment for risk variants in lean compared to obese cases. PLoS Genet. 2012;8:e1002741. doi: 10.1371/journal.pgen.1002741. [DOI] [PMC free article] [PubMed] [Google Scholar]
- 55.Yang J., Manolio T.A., Pasquale L.R., Boerwinkle E., Caporaso N., Cunningham J.M., de Andrade M., Feenstra B., Feingold E., Hayes M.G. Genome partitioning of genetic variation for complex traits using common SNPs. Nat. Genet. 2011;43:519–525. doi: 10.1038/ng.823. [DOI] [PMC free article] [PubMed] [Google Scholar]
- 56.Martin A.R., Costa H.A., Lappalainen T., Henn B.M., Kidd J.M., Yee M.C., Grubert F., Cann H.M., Snyder M., Montgomery S.B., Bustamante C.D. Transcriptome sequencing from diverse human populations reveals differentiated regulatory architecture. PLoS Genet. 2014;10:e1004549. doi: 10.1371/journal.pgen.1004549. [DOI] [PMC free article] [PubMed] [Google Scholar]
- 57.DeFronzo R.A. Pathogenesis of type 2 diabetes mellitus. Med. Clin. North Am. 2004;88:787–835. doi: 10.1016/j.mcna.2004.04.013. ix. [DOI] [PubMed] [Google Scholar]
- 58.Boden G. Role of fatty acids in the pathogenesis of insulin resistance and NIDDM. Diabetes. 1997;46:3–10. [PubMed] [Google Scholar]
- 59.Roden M., Price T.B., Perseghin G., Petersen K.F., Rothman D.L., Cline G.W., Shulman G.I. Mechanism of free fatty acid-induced insulin resistance in humans. J. Clin. Invest. 1996;97:2859–2865. doi: 10.1172/JCI118742. [DOI] [PMC free article] [PubMed] [Google Scholar]
- 60.Carpentier A., Mittelman S.D., Bergman R.N., Giacca A., Lewis G.F. Prolonged elevation of plasma free fatty acids impairs pancreatic beta-cell function in obese nondiabetic humans but not in individuals with type 2 diabetes. Diabetes. 2000;49:399–408. doi: 10.2337/diabetes.49.3.399. [DOI] [PubMed] [Google Scholar]
- 61.GTEx Consortium The Genotype-Tissue Expression (GTEx) project. Nat. Genet. 2013;45:580–585. doi: 10.1038/ng.2653. [DOI] [PMC free article] [PubMed] [Google Scholar]
- 62.Farooqi I.S. FTO and obesity: the missing link. Cell Metab. 2011;13:7–8. doi: 10.1016/j.cmet.2010.12.016. [DOI] [PubMed] [Google Scholar]
- 63.Smemo S., Tena J.J., Kim K.H., Gamazon E.R., Sakabe N.J., Gómez-Marín C., Aneas I., Credidio F.L., Sobreira D.R., Wasserman N.F. Obesity-associated variants within FTO form long-range functional connections with IRX3. Nature. 2014;507:371–375. doi: 10.1038/nature13138. [DOI] [PMC free article] [PubMed] [Google Scholar]
Associated Data
This section collects any data citations, data availability statements, or supplementary materials included in this article.