

Abstract
Despite the discovery of copy-number variation (CNV) across the genome nearly 10 years ago, current SNP-based analysis methodologies continue to collapse the homozygous (i.e., A/A), hemizygous (i.e., A/0), and duplicative (i.e., A/A/A) genotype states, treating the genotype variable as irreducible or unaltered by other colocalizing forms of genetic (e.g., structural) variation. Our understanding of common, genome-wide CNVs suggests that the canonical genotype construct might belie the enormous complexity of the genome. Here we present multiple analyses of several phenotypes and provide methods supporting a conceptual shift that embraces the structural dimension of genotype. We comprehensively investigate the impact of the structural dimension of genotype on (1) GWAS methods, (2) interpretation of rare LOF variants, (3) characterization of genomic architecture, and (4) implications for mapping loci involved in complex disease. Taken together, these results argue for the inclusion of a structural dimension and suggest that some portion of the “missing” heritability might be recovered through integration of the structural dimension of SNP effects on complex traits.
Introduction
Germline copy-number variation (CNV) has, since its discovery on a large scale a decade ago, been of enormous interest in medical genetics and has been extensively studied across a number of phenotypes.1–8 Although there remain challenges to generating high-confidence CNV data sets, there has been significant progress in the development of detection algorithms and validation methods.9–17
However, the direct effect of copy-number variability on genotype dosage has received far less attention. For example, the hemizygous genotype left behind in the wake of a deletion and the multiplicative genotype in a region of segmental duplication both vary with respect to a structural dimension representing genotype categories that do not fit neatly into homozygous or heterozygous designations. This observation has important implications for the impact of genotypic complexity (i.e., layering of SNP variation within copy-number-variable [CNV] and copy-number-stable [CNS] regions) on genome annotation and on disease gene mapping.18–20 Here we offer methods, provide real-world results, and assess the functional impact of including the structural architecture of genotype across different modes of analysis (i.e., GWAS, rare variant, variance components) and phenotypes, challenging the long-held convention that genotype essentially exists in only three states.
We investigated the structural dimension of SNP effects on (1) GWAS methods, (2) interpretation of rare LOF variants, (3) characterization of genomic architecture, and (4) implications for mapping loci involved in complex disease (Figure 1). First, we sought to test the hypothesis that by integrating both the number of alleles (derivative of CNV) and the allelic content in a single test we would more precisely delimit genotype, thereby increasing power to identify significant associations and recover additional heritability. We apply our approach, termed copy-number-indexed GWAS (cni-GWAS), in a proof-of-principle experiment, to the detection of expression quantitative trait loci (eQTLs) but note that our approach applies, without loss of generality, to other traits. Our approach differs from previously described methods19 in that it utilizes post-QC CNV data generated from any CNV caller and subject to the desired quality-control stringency, allowing for the use of a vetted CNV data set. This important distinction allows the analyst (1) to reliably detect CNVs using multiple SNPs simultaneously with multiple algorithms, reflecting the current state-of-the-art methods for CNV detection, (2) to determine the level of QC stringency required for the CNV data, and (3) to mine massive amounts of publically available CNV and genotyping results that have already been generated. For these reasons, we believe this approach is preferable to attempting to determine dosage on a SNP-by-SNP basis.
Figure 1.
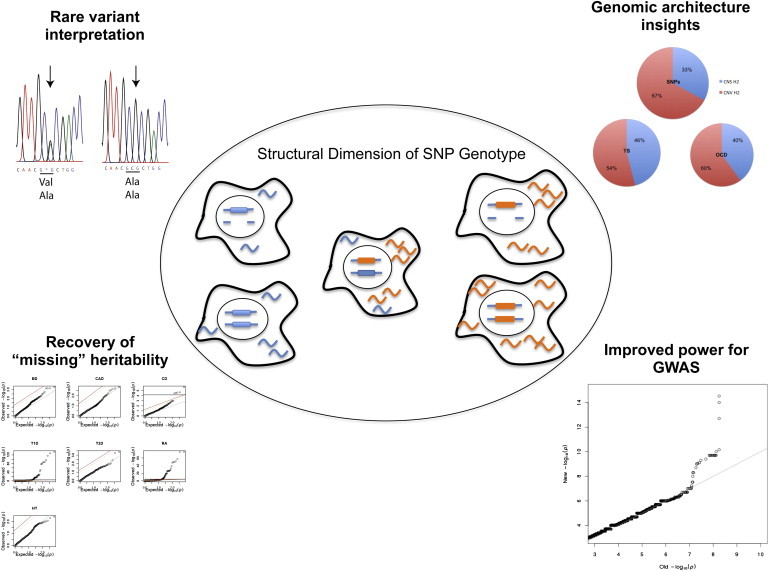
Schematic Diagram of the Analytic Approach
We developed an approach that incorporates structural information to identify regulatory variants hidden from standard GWASs. The central figure displays a cartoon image of two alleles (orange and blue) each associated with a specific level of transcriptional efficiency and each represented with multiple structural variations. The remaining panels of the figure illustrate the focus of analyses presented in the paper including GWAS methods, interpretation of rare LOF variants, characterization of genomic architecture, and implications for mapping loci involved in complex disease.
Our use of eQTL detection as a test case also permits us to explore the broad relevance of these “unmasked” association signals to complex human disease traits. It has been previously established that trait-associated SNPs discovered by GWASs21 are enriched for eQTLs22–25 identified in LCLs. Using the results from the NHGRI GWAS catalog21 as well as all results from the seven disease association studies conducted by the Wellcome Trust Case Control Consortium,26 we tested several additional hypotheses relating to the enrichment and biological relevance of eQTLs derived from cni-GWAS compared to eQTLs derived from traditional GWASs.
Second, in order to assess the extent of genomic complexity on rare variants from exome sequencing, we investigated the structural architecture of the genome in regions harboring putatively deleterious loss-of-function (LOF) variants (Figure 1). We determined the proportion of LOF variants that fall within CNS versus CNV regions of the genome in exomes from healthy controls,27 as well as transmitted and de novo LOF variants drawn from recent studies of autism exomes.28–31 We then investigated differences in the functional characteristics of LOF variants in CNV and CNS regions to gain insight into the relevance of the structural dimension on the phenotypic consequences of rare coding variation. With cni-GWAS and the LOF analysis, we demonstrate the impact of the structural dimension of genotype on rare variants and variants tested individually in a GWAS framework.
However, it has become clear that many complex traits are highly polygenic, so we provide a third and final line of evidence for the global and pan-phenotypic impact of the structural dimension on genotype in a polygenic framework. Here we partition the genome according to known CNV and CNS regions and calculate the heritability of Tourette syndrome (TS [MIM 137580]) and obsessive compulsive disorder (OCD [MIM 164230]) captured by each partition using a mixed linear model. We assessed the significance of the partitioned heritability to determine whether CNV or CNS regions of the genome appeared to concentrate heritability.
Material and Methods
Unmasking Novel Regulatory Variation by Modeling the Structural Dimension of SNPs
cni-GWAS Analysis
Using the combined HapMap genotype data, we ascertained SNPs located within the boundaries of a set of CNV regions that had been previously identified in the same samples.32 This resulted in a total of 17,565 SNP variants in 1,397 CNV regions. We developed cni-GWAS, which assumes an additive linear model that utilizes locus-specific covariate adjustment, with CNV status as a covariate, then tests the SNP genotype against all gene expression phenotypes. This approach effectively integrates both SNP allelic content and copy number dosage in a single model and estimates their joint effects on gene expression. In contrast to the traditional eQTL mapping approach that assumes diploidy at each candidate eQTL SNP or assumes no SNPs at a CNV locus, we assume that CNVs and SNPs may colocalize (genome-wide). We thus fit the following regression model:
| (Equation 1) |
where Y is a gene expression trait, C is the CNV genotype, S is the SNP genotype, β1 is the CNV genotype effect, β2 is the SNP genotype effect, Xβ is the effect of nongenotype covariates (e.g., age, sex, or principal components), and e is the residual. The residuals e are assumed to be independently and identically (normally) distributed. Note that, in the absence of a CNV, the model reduces to the simple model that tests only for the presence of a SNP effect. Furthermore, in the absence of a SNP at a CNV locus, the model reduces to a regression that tests for the presence of a CNV eQTL effect.33 Thus, this approach contains the traditional single-variant approaches as special cases. We note that the model in Equation 1 tests for a nonzero additive SNP effect unmasked by incorporating the CNV effect. To test for “SNP × CNV epistasis” and for departure from additivity of SNP effect, we subsequently fit the following interaction model for SNP and CNV pairs for which marginal SNP association with gene expression, using Equation 1, was found:
| (Equation 2) |
Here β3 is the SNP × CNV epistatic effect.
High correlation between SNP and CNV genotypes in the model (Equation 1) may have undesirable consequences. Indeed, such correlation would likely induce a less precise estimate of the SNP effect on gene expression while controlling for CNV status. Furthermore, the redundancy in information provided by SNP genotype and CNV status may produce overfitting in the regression model. However, as the cni-GWAS approach deals with the association of SNPs that lie within regions of CNV, linkage disequilibrium (LD) between the SNP being tested and the CNV being tested is not a significant concern. This is because, in the case of deletions, the remaining allele is on the opposite chromosome as the deleted allele and therefore not in LD with the deletion. In the case of duplications, one allele exists within the duplicated haplotype and is therefore in perfect LD with the CNV, and the model is irreducible. In both cases, the presence of the CNV dictates the allelic dosage (i.e., 0, 1, 2, 3) to be used in the model.
Quality Control
Both CNV and SNP genotype data used in this study may be considered well-vetted sources of data (for details please see the primary publications Mills et al.32 and Conrad et al.34; all data from human subjects has been published previously with documentation of oversight from institution review boards or similar entities and was conducted in accordance with Declaration of Helsinki). Nevertheless, we were presented with additional opportunity for QC and examined the data to test for genotypic incompatibilities (i.e., heterozygous genotype in regions of unique deletion). No genotypic incompatibilities were detected for the data reported here. Finally, in an effort to measure and control for the possibility of overfitting, we calculated the correlation between the SNP-level p value and the CNV-level p value from the cni-GWAS analysis. Furthermore, we identified SNP-CNV pairs with significant coefficients for both SNP genotype and CNV status as well as those pairs with a significant coefficient for only one.
Defining cni-GWAS eQTLs, eSNPs, and eCNVs
cis eQTLs are defined as SNPs within 1 Mb of their target genes (FDR < 0.05).36 Given the number of SNPs present in regions of CNV (17,565) and the number of expressed genes (13,080) tested, we defined a trans eQTL as a SNP associated with a (distal) gene expression trait at p < 2.18 × 10⁻¹⁰ ( = 0.05 / (17,565 ∗ 13,080)). Throughout our study, we strictly reserve the term “eQTLs” to refer to SNPs that are significantly associated with a gene expression trait after multiple testing adjustment (e.g., FDR < 0.05 for cis eQTLs, p < 2.18 × 10⁻¹⁰ for trans eQTLs).36
For the purposes of methodological comparison and additional exploratory analyses, we also defined a broader group of SNPs showing moderate association with gene expression (p < 10−4), which we refer to as “eSNPs” throughout the manuscript. eSNPs have been useful in exploratory functional analyses and enrichment analyses relative to random sets of SNPs in the genome that are matched on genomic features of the eSNPs, enabling genomic discoveries that may be difficult to obtain through single-locus analyses.37–39
While the remaining analyses focus on eSNPs, we also summarized the eCNV results under cni-GWAS (Figure S3 and Table S1 available online). The cni-GWAS-derived p values for the eCNVs shown in Figure S3 were calculated after accounting for the presence of a SNP within the CNV region. This set of results refines previous traditional GWAS analysis identifying CNVs as eQTLs without conditioning on SNP genotype.33
Comparison of cni-GWAS and Traditional GWAS eQTL Mapping Approaches
In order to assess the power of cni-GWAS to detect associations, we examined the distribution of p values yielded by both cni-GWAS and the traditional GWAS approach to eQTL detection. This allows a comparison of the methods for eSNP detection and a test of the sensitivity of our findings using a variety of significance thresholds. Additionally, we compared the list of eQTLs identified through cni-GWAS to that of eQTLs identified through traditional GWASs in order to measure the number of novel discoveries generated by the new method.
To determine whether the improvement in significance under cni-GWAS was driven by spurious small p values stemming from low MAF variants, we examined the relationship between MAF and p value and compared the minor allele frequency distribution of eSNPs from cni-GWAS compared to standard GWAS. Furthermore, we compared the expression mean and variance of the eQTL targets from the two approaches (i.e., cni-GWAS and standard GWAS) to test whether CNV-driven differences in gene expression variance could have contributed to the gain in significance.
We provide summary statistics for the cni-GWAS eQTLs (eSNP and eCNVs), including coefficient of determination (R2), p value, and beta, through the publicly available SCAN database.23,40
Functional Analysis of cni-GWAS eSNPs via ENCODE
We downloaded ChromHMM data, DNaseI hypersensitivity uniform peaks data in the lymphoblastoid cell line GM12878, and transcription factor binding site (TFBS) ChIP-seq data from the UCSC Genome Browser website.41,42 Regions identified as enhancers or weak enhancers were classified into a single enhancer annotation.
Using bedtools, we mapped SNPs in CNV regions to genomic features defined by these regulatory annotations from functional and epigenomic data sets, facilitating the annotation of such SNPs with information on (1) chromatin state (enhancers; active, weak, and poised promoters; Polycomb-repressed regions; heterochromatic and repetitive regions); (2) colocalization with open chromatin regions from DNaseI hypersensitivity data; and (3) overlap with TFBS regions.43
We tested for enrichment of cni-GWAS eSNPs within chromatin state and DNaseI hypersensitivity annotations by first identifying the cni-GWAS eSNPs that map to these regulatory annotations and then, with the frequency in the genome as the expectation, we applied the binomial test to obtain an enrichment p value. We also investigated the effect of the cni-GWAS eSNPs on regulatory motifs. The difference in log-odds (LOD) score between the reference allele and the alternative allele was used as a measure of the differential allelic effect of the eSNP on the TFBS. If an eSNP was annotated with multiple transcription factors, we used the maximum, over all affected motifs, of the LOD scores. Using the Wilcoxon test, we compared the LOD scores at the cni-GWAS eSNPs and the remaining SNPs.
Analysis of cni-GWAS eSNPs in NHGRI GWAS Catalog
A subset of SNPs reproducibly associated with a broad spectrum of complex traits has been curated in the NHGRI GWAS catalog.21 From the 3,124 unique trait-associated SNPs (NHGRI Catalog date 03/2013) with association p values less than 10−8, we generated an expanded set of SNPs in LD (r2 ≥ 0.80, n = 28,417) with the trait-associated SNPs and determined the overlap with the set of 17,565 SNPs included in cni-GWAS. We then determined how many of these trait-associated SNPs and their proxies were identified as eSNPs under cni-GWAS. We evaluated the significance of the observed count relative to random sets of SNPs (N = 1,000) matched, using trait-associated SNPs, on minor allele frequency (which determines power to detect an association) and on distance to nearest gene (given that the trait-associated SNPs may be enriched for SNPs near genes).
In addition to identifying the eSNPs overlapping or colocalizing with the reported (NHGRI) trait-associated SNPs, we generated a Q-Q plot illustrating the strength of SNP association with gene expression for the NHGRI SNPs and their LD proxies (i.e., the expanded set) in CNV regions under cni-GWAS. We compared this to the Q-Q plot for the remaining set of NHGRI SNPs to test for the existence of differential effect on the transcriptome and to assess to what extent SNPs in CNV regions may contribute to eSNP enrichment (in LCLs) among the trait-associated SNPs. Lastly, we identified both novel eQTLs and eSNPs associated with phenotypic categories among the NHGRI SNPs (i.e., autoimmune disorder-, neuropsychiatric-, cancer-, and metabolic-related traits, etc.).
Analysis of cni-GWAS eSNPs in WTCCC Phenotypes
In order to illustrate the relevance of cni-GWAS results to disease, we examined our cni-GWAS eSNPs (p < 10−4) for associations with the seven WTCCC diseases: Crohn disease (CD), rheumatoid arthritis (RA [MIM 180300]), coronary artery disease (CAD), hypertension (HT), type 1 diabetes (T1D [MIM 222100]), type 2 diabetes (T2D [MIM 125853]), and bipolar disorder (BD [MIM 125480]).26 The summary results in the second release of the WTCCC data were downloaded with permission. Next, the eSNPs identified with cni-GWAS (p < 10−4) were extracted from each set of disease associations and the results of only those disease associations were plotted in a Q-Q plot for each disease. The degree of enrichment is represented by the leftward shift (Appendix A) from the diagonal line (on which there is perfect agreement between observed and expected p values). Three FDR thresholds are represented (FDR < 0.05, FDR < 0.10, and FDR < 0.25) with each disease trait to quantify the enrichment.
Quantifying the Phenotypic Variance Explained by cni-GWAS eSNPs
For each disease phenotype, we evaluated the amount of additional heritability that could be explained by the cni-GWAS eSNPs outside of the human leukocyte antigen (HLA) region. A variance-components-based approach (via restricted maximum likelihood) to the estimation of the heritability explained by eSNPs has also been previously described44 and applied to reveal differences in genetic architecture between related diseases.39 Here, taking into account LD between SNPs in a locus and assuming multivariate effects or allelic heterogeneity, we use the theory of quadratic forms to estimate the explained variance for an eSNP locus. An unbiased estimate of the variance explained by a locus L consisting of p variant effects can be written in terms of the SNP correlation matrix C, the sample size n, and the p-vector of estimated (marginal) effect sizes (such as from readily available GWAS summary statistics):
| (Equation 3) |
See Appendix A for details.
Detecting Effects of Rare Coding Variants in CNV and CNS Regions of the Genome
Determining CNV and CNS Regions of the Genome
Copy-number-variable regions of the genome were defined according to their presence in the Database of Genomic Variation.45 This includes all autosomal regions of deletion or duplication between 50 bp and 3 Mb in size detected in healthy controls and reported in at least one of 55 studies of CNVs deposited in the DGV. Variants identified with bacterial artificial chromosome (BAC) array technology were removed, because these variants are known to overestimate CNV size.46 Additionally, variants spanning a gap in the reference assembly or corresponding to Decipher Genomic Disorders database were also filtered. Variants that overlap at least 70% by length and position reported in the same study were merged. Copy-number-stable regions of the genome were stringently defined as all remaining regions of the genome not otherwise annotated as copy-number variable in the DGV download.
Exonic Loss-of-Function Variants in Variable and Stable Genomic Regions
We used publically available lists of loss-of-function (LOF) variants identified through next-generation sequencing methods in healthy individuals from the 1000 Genomes Project27 as well as inherited and de novo LOF variants found in case subjects and control subjects from the recently published autism exome analysis.28–31 We annotated these variants to indicate their presence in CNV or CNS regions as defined above. Then, using data from the 1000 Genomes Project, we tested the LOF variants in CNV and CNS regions for differential effects on nonsense-mediated decay. Furthermore, we evaluated whether both types of LOF variants (CNV and CNS) are equally likely to affect all known transcripts of the affected gene or to leave some known transcripts of a gene unaffected. For this analysis, we included only those LOF variants that had been confirmed by one of several methods (1KG-P12, ImmunoChip, Omni2.5, Sequenom, or through HapMap), as previously described by MacArthur et al.27
Aggregating Distributed SNP Effects across CNV and CNS Regions
Estimating Heritability of CNV and CNS Regions of the Genome
We used data from a recently published study of the SNP heritability of TS and OCD, including 617 TS case subjects and 4,116 TS control subjects genotyped on 393,387 SNPs, as well as 1,061 OCD case subjects and 4,236 OCD control subjects genotyped on 373,846 SNPs after extensive quality control.39 We fit a linear mixed-effects model with two random effects (representing the complementary CNV and CNS regions) and the top 20 principal component covariates as fixed effects:
| (Equation 4) |
Here, Y is a vector of phenotype values, gCNV and gCNS are random (polygenic) effects corresponding to the CNV and CNS regions with gi ∼ N(0, Aiσ2i), b is a vector of fixed effects, and e is the residual term. GCTA v.1.247 was used to generate two genetic relationship matrix (GRM) files containing IBD relationship calculations for all pair-wise sets of individuals. One GRM, ACNV, utilized all SNPs residing in CNV regions of the genome and the other GRM, ACNS, included all SNPs in CNS regions of the genome. The restricted maximum likelihood (REML) approach was then used to estimate the variance components corresponding to the CNV and CNS regions. A population prevalence conversion (i.e., 0.8% for TS and 2.5% for OCD) transformed the observed heritability to the underlying liability scale.
Assessing the Significance of the CNV- and CNS-Anchored Heritability Estimates
To determine the significance of the heritability estimates for the CNV and CNS regions derived from the mixed-effects model, we performed phenotype permutation analyses, swapping case-control labels to generate null data sets (N = 1,000). We preserve the overall LD structure between SNPs (in the CNV and CNS regions, separately) for both the actual and permuted data sets. The proportion of permuted sets for which the estimated heritability matches or exceeds the observed heritability yields an empirical p value for the significance of the heritability estimate. This empirical p value is to be distinguished from the p value derived from the likelihood ratio test statistic (i.e., twice the difference of the log likelihood for the full model and that for the reduced model) in the REML analysis, which, in the case of multiple genetic variance components, has the theoretical distribution of a mixture of 0 and chi-square (with degrees of freedom equal to the number of components evaluated) with probability of 0.5. The significance of the difference between CNV- and CNS-anchored heritability estimates was assessed with a test statistic applied to permuted and actual test data. This test statistic was defined as the difference between the CNV and CNS estimates (divided by the standard error of the difference).
Results
cni-GWAS eSNPs and eCNVs
The cni-GWAS results showed a substantial increase in eSNPs (p < 10−4) when compared to the standard GWAS (Table 1) and 106 new eQTLs (i.e., FDR < 0.05 for cis eQTLs, p < 2.18 × 10⁻¹⁰ for trans eQTLs). The mean gain in significance for SNP/gene associations significant at p < 0.01 was 1.35 orders of magnitude (i.e., mean of –log10 (Pnew / Pold) = 1.35) (Figure 3) and 20% of SNP/gene associations increased in significance by nearly two orders of magnitude. A total of 451 SNP/gene associations increased in significance by at least three orders of magnitude (Table 1). Moreover, we observed a dramatic change in the rank order of the SNPs by association, as opposed to a simple scaling upward of p values, and discovered a total of 418 new eSNPs. Based on the number of variants (17,565) and the number of expressed genes (13,080) tested, we found 73 significant trans eQTL associations (p < 2.18 × 10⁻¹⁰) under cni-GWAS. Of these, 14 (∼19%) are novel trans eQTLs identified only under cni-GWAS.
Table 1.
Comparison of Standard Regression and cni-GWAS Analysis and Results
| Traditional GWAS | Copy-Number-Indexed GWAS | |
|---|---|---|
| Total Number of SNPs | ||
| Total number of SNPs tested | 17,565 | 17,565 |
| Total number of structural variants tested | 1,397 | 1,397 |
| Total NHGRI SNPs tested | 3,124 | 3,124 |
| eQTLs Discovered (FDR < 0.05 for cis eQTLs, p < 2.18 × 10⁻¹⁰ for trans eQTLs) | 90 | 106 |
| eSNPs discovered (p < 10−4) | 4,152 | 4,570 |
| eSNPs in LD with NHGRI SNPs | 216 | 242 |
| p Value Change in Orders of Magnitude | ||
| Number of SNP/gene pairs with log(Pnew/Pold) > 1 | NA | 142,794 |
| Number of SNP/gene pairs with log(Pnew/Pold) > 3 | NA | 451 |
| Number of SNP/gene pairs with log(Pnew/Pold) > 5 | NA | 12 |
Figure 3.
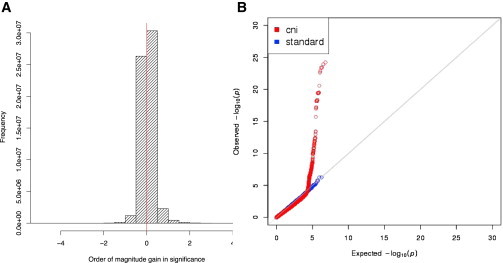
Evaluation of Association Results under cni-GWAS
(A) A histogram of the change in significance (in log10 scale) for the SNPs found to be associated with gene expression at p < 0.01 under cni-GWAS. The mean gain was 1.35, which indicates a gain of at least one order of magnitude. 20% of these SNP-gene associations identified by cni-GWAS showed an improvement of nearly two orders of magnitude. The red line indicates no change in significance between cni-GWAS and standard GWAS. All results to the right of the red line represent an increase in significance and results to the left represent a decrease in significance.
(B) SNPs in CNV regions drive eSNP enrichment (in LCLs) among NHGRI trait-associated SNPs and their LD proxies. cni-GWAS eSNPs showed a significant excess of low p values with gene expression under cni-GWAS (red). Furthermore, when we excluded the SNPs in CNVs and their LD proxies from the NHGRI catalog, this excess of low p values with gene expression for these trait-associated SNPs was no longer present (blue), suggesting that the observed eSNP enrichment among the trait-associated SNPs was driven by this special class of SNPs.
The minor allele frequency distributions of the eSNPs identified by the two approaches were similar (Figure S1), showing no excess of low-frequency variants among the cni-GWAS eSNPs relative to the standard eSNPs. An analysis of the SNP-gene association p value distribution in separate MAF bins showed no difference between cni-GWAS and standard GWAS in the low-frequency (≥5% and <10%) and mid-frequency (≥10% and <20%) range, but revealed a substantial gain in significant associations among the common eSNPs (≥20%) for cni-GWAS (Figure 2). Thus, the substantial increase in eSNPs from cni-GWAS was not due to spurious small p values from low-frequency variants and, given the sample size and the allele frequency of a candidate SNP (both important determinants of power to detect an eQTL), cni-GWAS was more likely to identify an eSNP than standard GWAS among common SNPs.
Figure 2.
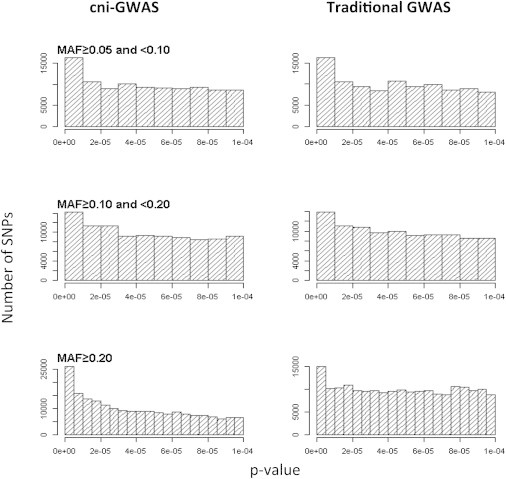
p Value Distribution of SNP-Gene Associations by MAF Bins under cni-GWAS and Traditional GWAS
An analysis of the SNP-gene association p value distribution in separate MAF bins showed no difference between cni-GWAS and standard GWAS in the low-frequency (≥5% and <10%) and mid-frequency (≥10% and <20%) range, but revealed a substantial gain for cni-GWAS in low p values among common variants (≥20%).
Due to the high degree of structural and regulatory complexity present in the HLA region, we removed entirely all cis and trans eQTLs associated with the HLA to ensure our genome-wide results were not driven completely by HLA complexity.48,49 The HLA region did show a greater-than-average degree of variation and a highly significant improvement in eQTL detection with the cni-GWAS approach, but the results of our global analysis remained robust to the removal of this region of the genome.
By symmetry, the method described in Equation 1 identifies CNVs associated with expression in the presence of a colocalizing SNP. We report the distribution of p values from eCNV results of cni-GWAS analysis (Figure S3) and the eCNV cni-GWAS summary statistics (Table S1). The results demonstrate robust detection of CNV eQTLs after accounting for the effects of colocalizing SNP variation.
We finally fit a “SNP × CNV epistasis” model (see Equation 2 in Material and Methods) for the identified eSNPs to test for any departure from SNP additive effect. We found no significant evidence of epistasis after multiple testing adjustment (Bonferroni-adjusted p < 0.05), which implies either no substantial departure from additivity of SNP effect or lack of power to detect such interaction. The most significant p value for the epistatic effect with the eSNPs (N = 4,570) from this analysis was p = 1.5 × 10⁻³.
Functional Analysis of SNPs Located in CNV Regions
We tested for overlap with ENCODE-derived regulatory elements identified in the LCL GM12878, a cell line derived from the HapMap CEU sample used in this paper. The cni-GWAS eSNPs showed highly significant enrichment for enhancer elements (p = 0.03): 245 were found with 213 expected (SD = 14). We found no such enrichment (p > 0.05) for promoter-associated epigenetic marks. However, we observed a significant enrichment for DNaseI hypersensitivity sites among the cni-GWAS eSNPs (p = 0.038), indicating that the cni-GWAS eSNPs are enriched for accessible chromatin zones; 57 such sites were identified with 43 expected (SD = 6.5). To further evaluate the role of these variants in transcriptional regulation, we tested for the presence of differential allelic effect on transcription factor binding sites (see Material and Methods) in the same cell line GM12878. We found a greater (p = 6.62 × 10⁻¹⁵; see Material and Methods) difference in the effect of the reference and alternative allele for these variants on binding motifs relative to what is expected in the genome.
eSNP Analysis of NHGRI GWAS Catalog
Upon inspection of the NHGRI catalog, we discovered that 751 NHGRI GWAS SNPs (p < 10−8 or SNPs in strong LD with them [r2 ≥ 0.80]) resided in CNV regions within our samples and had therefore been tested with the cni-GWAS model. Of these, cni-GWAS identified 242 as eSNPs while traditional GWAS identified only 216 as eSNPs. This represents a significant enrichment (p < 0.001) of cni-GWAS eSNPs among NHGRI catalog SNPs as well as a significant enrichment (p = 0.04) relative to the eSNPs identified by standard GWAS. For further discussion of this method, as well as an example of novel insights to a previous disease association, see Supplemental Data.
In addition, we discovered that the reported NHGRI SNPs and their LD proxies showed a significant excess of low p values with gene expression under cni-GWAS. Furthermore, when we excluded the SNPs in CNVs and their LD proxies from the NHGRI catalog, this excess of low p values with gene expression for these trait-associated SNPs was no longer present, suggesting that the observed eSNP enrichment among the trait-associated SNPs was indeed driven by this special class of SNPs (Figure 3). The 26 (= 242 − 216) additional trait-associated SNPs and their proxies identified as eSNPs by cni-GWAS have been implicated in autoimmune, neuropsychiatric, and hypertension phenotypes among others (Supplemental Data).
Association Analysis of cni-GWAS-Derived eSNPs with WTCCC Disease Phenotypes
We determined the utility of the identified cni-GWAS eSNPs in disease mapping studies. We extracted, from each WTCCC disease set of GWAS results, the set of eSNPs (gene expression association p < 10−4) identified with cni-GWAS and examined their association with WTCCC phenotypes. We found that by restricting to the cni-GWAS eSNPs, we retained the very most significant associations with phenotype for type 1 diabetes and rheumatoid arthritis, but also identified novel associations with Crohn disease (Bonferroni-corrected p < 0.05 among the tested eSNPs) (Figure 4). Furthermore, the most significant findings for these autoimmune disorders are highly enriched for eSNPs identified through the cni-GWAS approach (Figure 4), consistent with the utility of LCLs as a surrogate tissue for these traits.
Figure 4.
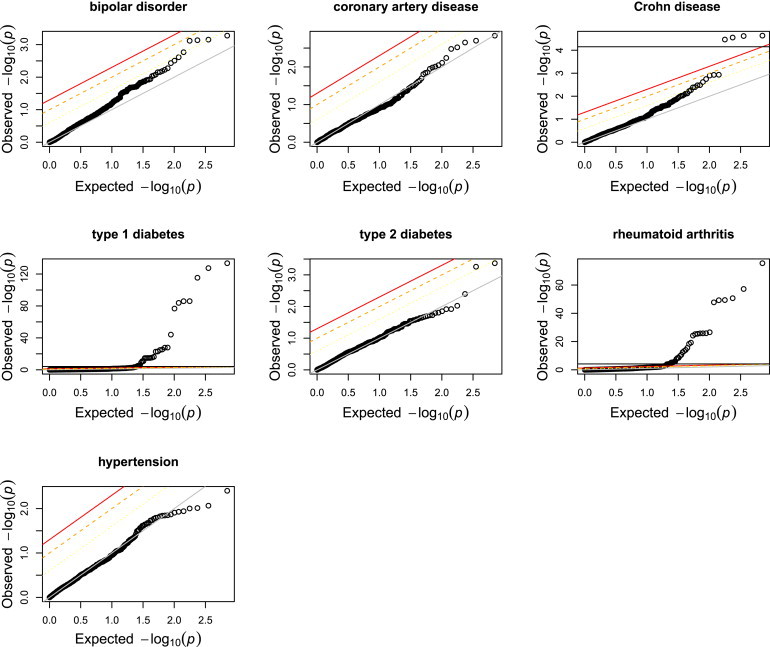
cni-GWAS eSNPs and Association with Disease
Shown here are the Q-Q plots of the distribution of p values for association with disease from each of the seven WTCCC phenotypes for those eSNPs identified by cni-GWAS. Note the enrichment for trait associations with autoimmune disorders. Furthermore, several of the cni-GWAS eSNPs attained FDR < 0.25 with bipolar disorder, in contrast to the full GWAS SNPs. The leftward shifts corresponding to FDR < 0.05, FDR < 0.10, and FDR < 0.25 are shown as red, orange, and yellow lines, respectively (in relation to the diagonal gray line of perfect concordance between observed and expected p value). A horizontal black line representing Bonferroni correction is also shown whenever the eSNPs meet this threshold.
As CNVs are known to be enriched for genes involved in immunity, we considered the possibility that our cni-GWAS-derived eSNPs may be enriched for target genes involved in immunity as well. Taking advantage of this point, we performed joint multi-SNP association analyses of the cni-GWAS eSNPs in T1D, RA, and CD. The eSNPs identified by our model selection approach for each disease are shown in Table S2, which also shows each SNP’s effect size, standard error of the beta, and the p value from the joint multi-SNP analysis. In total, 22, 28, and 33 cni-GWAS eSNPs were included in the T1D, RA, and CD joint eSNP models, respectively. Further details of the joint multi-SNP analyses are presented in Supplemental Data.
We found extensive overlap between T1D and RA for the target genes of the cni-GWAS eSNPs identified by the joint association analysis (Table S2); the overlap includes well-known genes in the HLA region.50,51 Indeed, 27 of the 55 (49%) target genes (significantly more than expected by chance, p < 2 × 10⁻¹⁶) of the cni-GWAS eSNPs included in the RA joint eSNP model were also expression targets of the eSNPs included in the T1D joint eSNP model. In contrast, only 3 of the 55 (5%) were shared between RA and CD although this was still greater than expected by chance (p = 1.7 × 10⁻⁴). Notably, the substantial level of overlap between T1D and RA held robustly (p < 2 × 10⁻¹⁶) when the two implicated gene targets from the HLA region were excluded.
As we noted before, the very most significant associations (meeting genome-wide significance, p < 5 × 10⁻⁸) with T1D and RA were also identified as cni-GWAS eSNPs. Therefore, we assessed the variance in liability to disease explained by the cni-GWAS eSNPs, excluding the HLA region, which is already known to explain up to 50% of familial clustering of T1D.50 We accounted for additional heritability by non-HLA cni-GWAS-identified eSNPs, which explained 2%, 10%, and 1.8% of the variance in disease risk for T1D, RA, and CD, respectively.
Results of Analysis on CNV and CNS Exonic Loss of Function
Our results show that approximately 70% of LOF mutations found in exome studies fall within regions of the genome known to be polymorphic with respect to copy-number variation. These results were consistent across mutation type (i.e., frameshift, nonsense, splice site) and phenotype with the same rates observed in autism case subjects and healthy control subjects, and regardless of de novo status.
Using the 1000 Genomes data, we tested for differential effect of LOF variants between CNV and CNS regions. We found suggestive evidence that LOF variants in CNS regions are more likely to trigger nonsense-mediated decay (p = 0.07). However, LOF variants in CNV regions are significantly more likely to impact all known transcripts of the affected gene (p = 0.03).
Aggregate SNP Effects in CNV/CNS Regions: Heritability Analyses in TS and OCD
We used a linear mixed-effects model with 2 random effects representing the CNV and CNS regions of the genome and used REML to quantify the corresponding variances. The significance of the h2 in the CNV and CNS regions of the genome was evaluated using a permutation analysis approach (see Material and Methods) that preserves the LD structure of each region. In the analysis of directly genotyped data, CNS variants represented 33% of the total SNPs tested, but accounted for 46% (h2 = 0.26, SE = 0.06; p < 0.001) of the total TS heritability and 40% (h2 = 0.15, SE = 0.05, p < 0.001) of the total OCD heritability (Table S3).
Discussion
Our findings highlight the improvement in power to detect trait-associated loci with a nuanced mapping approach and show that cni-GWAS has “unmasked” additional regulatory variation. The integrative GWAS method termed cni-GWAS shows compelling support for improved eQTL detection in the number of associations and the gain in significance (Table 1 and Figure 3). Additionally, we see the most substantial gain in significance for eSNPs with a MAF > 20%, indicating that the result is not influenced by spurious association driven by low MAF SNPs (Figure 2). But is this improvement in power reason enough to adopt a novel approach to GWASs and a structural dimension to genotype? We demonstrate through further analyses of additional phenotypes and genetic architectures that base content and chromosome structure are indivisibly linked and the degree to which we integrate the structural dimension of genotype in genome analysis may well determine how effectively we can bridge the genotype-phenotype divide (Figure 1).
The functional importance of eSNPs with dosage-sensitive effect is provided by their enrichment for regulatory annotations including enhancer elements and DNase hypersensitivity sites. Additionally, this class of eSNPs can be found within transcription factor binding sites with greater-than-expected binding affinity. This finding shows that SNPs within CNVs have dosage-sensitive effects and provides a plausible biology through which these properties manifest in a tissue, highlighting the link between structure and function of a genotype. Given these observations, it will be important to determine whether the structural dimension of eSNPs equally influences expression across tissues, or whether there is any part of eSNP structural architecture that is tissue specific. These results lay the groundwork for the investigation of covariation of CNVs and eQTLs across different tissues such as now being facilitated by the Genotype-Tissue Expression (GTEx) Project.52
While enrichment for functional elements provides a plausible biological explanation for expression regulation, it does not necessarily provide evidence that accounting for the structural architecture of genotype is relevant to genomics of human disease. In order to address this claim, we should first note that SNPs significantly associated with human traits (e.g., NHGRI GWAS catalog SNPs and their LD proxies) are more likely to be eQTLs than expected from GWASs.22,24 Analyses described here refine this initial observation and importantly show that SNPs with dosage-sensitive regulatory effect are (1) driving this enrichment and are (2) more significantly associated with gene expression when tested under the cni-GWAS model (Figure 3).
NHGRI GWAS catalog SNPs represent a unique set of SNPs with known phenotypic consequences, which probably do not reflect typical SNPs studied in GWASs. Therefore we also investigated the distribution of cni-GWAS eSNPs among all SNPs tested for association with WTCCC disease phenotypes (Figure 4). The eSNPs identified through the cni-GWAS method were enriched for significant associations with multiple WTCCC disease phenotypes including type 1 diabetes (T1D), Crohn disease (CD), and rheumatoid arthritis (RA), accounting for additional heritability in each phenotype. Using this set of eSNPs, we were also able to identify shared risk between T1D and RA as nearly half of the disease associated eSNP target genes were shared between these phenotypes (Table S2). The strength of the results are not surprising given the discovery tissue type (LCLs) and the observation that CNVs are also enriched for genes in immune pathways, suggesting that cni-GWAS may be particularly powerful for mapping of autoimmune-related disease genes and variants.34 However, as our variance components analysis of TS and OCD show, the importance of genomic complexity is not likely to be restricted to autoimmune phenotypes (Table S3).
While these results all highlight the importance of accounting for structure in a polygenic framework, we also note that results from rare variant data may benefit from annotations of known stable and variable regions of the genome. Detecting rare alleles that actually increase susceptibility for common diseases is challenging given the abundance of rare but neutral mutations in the genome, and gene-based tests of rare variants, such as those identified by exome sequencing, are still underpowered.53,54 Nevertheless, the observed proportion of LOF variants in CNV regions suggests the value of a structural annotation approach to rare coding variation and is consistent with reduced purifying selection in CNV regions.55 Moreover, CNS regions harbor a larger proportion of LOF variants that trigger nonsense-mediated decay than CNV regions while LOF variants in CNV regions are more likely to affect all known transcripts of a gene, highlighting the importance of the structural dimension for elucidating the downstream functional consequences of such variants.
The methods and results provided here are not without limitation. First, the CNV data were primarily composed of deletion regions, as these were the main focus of the CNV studies on the HapMap/1000 Genomes samples. Duplications were explored in less detail, which may translate into a loss of signal among results presented here. Additionally, complex duplications or deletions within duplications were not considered in this analysis. The results presented here provide rationale for the development of a more nuanced method to efficiently phase CNV and SNP genotype data, which would facilitate a fully integrated approach to analysis of variation in regions of high structural complexity.
In 1966, Dr. John Stewart Bell formally described the problem of hidden variable: “whether the quantum mechanical states can be regarded as ensembles of states further specified by additional variables such that given values of these variables together with the state vector determine precisely the results of individual measurement.”56 Modern genetics has acknowledged that genotypic complexity (e.g., an ensemble of colocalizing genetic variations) is fundamentally a problem of hidden variables, yet there have been surprisingly few attempts to address this problem head-on. We argue that the ubiquity of structural variation raises the fundamental question “how should we define genotype?” In this study, we provide proof-of-principle evidence using multiple approaches, data sources, and phenotypes to show that the genotype state at any genomic position should be regarded as an ensemble of states comprised of SNP allelic content and copy-number status. This is not solely an important philosophical point, but also carries with it practical implications for genetic analyses.
Acknowledgments
L.K.D. wishes to acknowledge posthumously, with deep gratitude and profound thanks, the intellectual contributions to this study provided by George Stephen Karatheodoris whose generous perspective on science is here honored. We wish to thank Dr. Mathew Barber for discussions regarding the statistical analysis described in this manuscript and Dr. Jeffrey MacDonald (The Centre for Applied Genomics) for assistance with specialized DGV data requests. This study makes use of data generated by the Wellcome Trust Case Control Consortium, funding for which was provided by the Wellcome Trust under award 076113. The WTCCC bears no responsibility for the further analysis or interpretation of these data, over and above that published by the Consortium. We acknowledge the International Obsessive-Compulsive Foundation Genetics Consortium (IOCDFGC; Steering Committee: Pino Alonso, Paul Arnold, Helena Brentani, Danielle Cath, Eske Derks, Gregory Hanna, James Knowles, Carol Mathews, Dennis Murphy, Gerry Nestadt, David Pauls, Jeremiah Scharf, Evelyn Stewart, Michael Wagner, Danielle Posthuma, Susanne Walitza, and Yin Yao) and the Tourette Syndrome Association International Consortium for Genetics (TSAICG; Steering Committee: Jeremiah Scharf, Carol Mathews, Benjamin Neale, Nelson Freimer, Nancy Cox, Giovanni Coppola, Danielle Posthuma, David Pauls) for use of the TS and OCD GWAS data. This work was funded in part by the Conte Center for Computational Neuropsychiatric Genomics (NIH P50MH94267). We wish to acknowledge additional support for this study provided by R01 MH090937, U01 HG005773, P60 DK20595, U19 GM61393, P50 HD055751, and the National Center for Advancing Translational Sciences of the NIH under Award Number KL2TR000431 (L.K.D.).
Appendix A
Quantifying the Improvement in False Discovery Rate for cni-GWAS eSNPs
We define, following Storey et al.,36,57 the false discovery rate (FDR) as follows:
| (Equation A1) |
where m denotes the number of eSNPs included in the analysis, is the set of their p values with disease indexed by the eSNP i, and is the estimate for the proportion of null SNPs, which is quantified here as follows:
| (Equation A2) |
for a given tuning parameter (chosen here, as in Storey et al.,36 as 0.5). We find, from Equation A1, that the –log10( ) is approximately equal to the difference between log10(empirical quantile) and log10(p), assuming that is close to 1, as would be expected from GWASs. From Equation A1, this assumption actually yields a conservative estimate of FDR. We note that this numerical difference between log10(empirical quantile) and log10(p) corresponds, in a Q-Q plot, to the leftward shift from the diagonal line of perfect concordance; furthermore, a greater shift corresponds to lower FDR. The eSNPs detected using cni-GWAS that meet FDR < 0.05, FDR < 0.10, and FDR < 0.25 with each disease trait were identified.
Examination of the data from the bipolar disorder GWAS conditioned on cni-GWAS eSNP status showed that four SNPs passed FDR < 0.25 (namely, rs1422969, rs2161430, rs10893666, and rs10893668), in marked contrast to the results conditioned on eSNP status from traditional GWASs (data not shown). Furthermore, these data show that SNPs highly associated with many of the WTCCC phenotypes are also detected as eQTLs in LCLs when conditioned on CNV status, as in the cni-GWAS approach.
Heritability Analysis at an eSNP Locus
For a causal variant g with genotype X, the variance explained is a function of the effect size β (with , where ε ∼ N (0, σ2)):
Here without loss of generality, we suppose that phenotype and genotype have been normalized, with mean zero and unit variance across the samples. We quantify the explained variance at a locus, using LD information from a reference (population) panel and assuming multivariate effect sizes. The variance explained by a given locus L (such as one included in our final joint eSNP model; see Supplemental Data) consisting of p variants can be quantified in terms of the quadratic form:
where C is the SNP correlation matrix (calculated from the genotype n × p matrix X as ) and is the p-vector of effect sizes. In our GWAS examples, n >> p; the condition n ≥ p is a necessary condition for being invertible (of full rank). We also assume the Gauss-Markov condition on errors being uncorrelated and of equal variance. We denote by the p-vector of estimated (marginal) effect sizes from least-squares regression (readily available, for example, as summary statistics from a single-SNP GWAS):
| (Equation A3) |
To derive an unbiased estimate for , we note, from the theory of quadratic forms,58 the following expression on the expected value of a quadratic form in :
where E() and tr() are the expectation and trace operators, respectively, and Σ is the covariance matrix of . (We note here that the matrix C can be calculated using a reference data set [e.g., HapMap or 1000 Genomes].) Thus, we consider the following estimator of :
| (Equation A4) |
Again, from the theory of quadratic forms, the variance of a quadratic form in is given by the following:
| (Equation A5) |
Substituting the expression for Σ (Equation A3, replacing by its unbiased estimate ) into Equation A4 yields:
Simplifying yields an unbiased estimate of :
| (Equation A6) |
Using Equation A6, we can estimate the total explained variance for the joint model as the sum over all (disjoint and independent) loci . From Equations A4 and A5, we also obtain an estimate of the variance of :
| (Equation A7) |
As a corollary, the use of a smaller subset of (conditionally independent) SNP predictors in the formulation of the joint eSNP model (as described in the Supplemental Data) reduces the noise in the variance explained by the locus . Finally, we note that the variance explained by the locus L (estimated using marginal SNP effects in Equation A6) can also be estimated from the joint-SNP model using the residual sum of squares:
Further details of the joint multi-SNP analyses are presented in the Supplemental Data.
Supplemental Data
This analysis identified a list of cni-GWAS eSNPs with conditionally independent sources of association with the immune-related diseases (T1D, RA, and CD). Shown are the beta, the standard error of the beta, and the p value from the joint eSNP analysis as well as the gene targets of each eSNP.
Web Resources
The URLs for data presented herein are as follows:
1000 Genomes, http://browser.1000genomes.org
bedtools2, https://github.com/arq5x/bedtools2
ChromHMM, http://compbio.mit.edu/ChromHMM/
Database of Genomic Variants (DGV), http://dgv.tcag.ca/dgv/app/home
National Human Genome Research Institute, http://www.genome.gov/
Online Mendelian Inheritance in Man (OMIM), http://www.omim.org/
SCAN: SNP and CNV Annotation Database, http://www.scandb.org/newinterface/about.html
UCSC Genome Browser, http://genome.ucsc.edu
WTCCC, http://www.wtccc.org.uk
References
- 1.Szatmari P., Paterson A.D., Zwaigenbaum L., Roberts W., Brian J., Liu X.Q., Vincent J.B., Skaug J.L., Thompson A.P., Senman L., Autism Genome Project Consortium Mapping autism risk loci using genetic linkage and chromosomal rearrangements. Nat. Genet. 2007;39:319–328. doi: 10.1038/ng1985. [DOI] [PMC free article] [PubMed] [Google Scholar]
- 2.Xu B., Roos J.L., Levy S., van Rensburg E.J., Gogos J.A., Karayiorgou M. Strong association of de novo copy number mutations with sporadic schizophrenia. Nat. Genet. 2008;40:880–885. doi: 10.1038/ng.162. [DOI] [PubMed] [Google Scholar]
- 3.Davis L.K., Meyer K.J., Rudd D.S., Librant A.L., Epping E.A., Sheffield V.C., Wassink T.H. Novel copy number variants in children with autism and additional developmental anomalies. J. Neurodev. Disord. 2009;1:292–301. doi: 10.1007/s11689-009-9013-z. [DOI] [PMC free article] [PubMed] [Google Scholar]
- 4.Elia J., Gai X., Xie H.M., Perin J.C., Geiger E., Glessner J.T., D’arcy M., deBerardinis R., Frackelton E., Kim C. Rare structural variants found in attention-deficit hyperactivity disorder are preferentially associated with neurodevelopmental genes. Mol. Psychiatry. 2010;15:637–646. doi: 10.1038/mp.2009.57. [DOI] [PMC free article] [PubMed] [Google Scholar]
- 5.Glessner J.T., Reilly M.P., Kim C.E., Takahashi N., Albano A., Hou C., Bradfield J.P., Zhang H., Sleiman P.M., Flory J.H. Strong synaptic transmission impact by copy number variations in schizophrenia. Proc. Natl. Acad. Sci. USA. 2010;107:10584–10589. doi: 10.1073/pnas.1000274107. [DOI] [PMC free article] [PubMed] [Google Scholar]
- 6.Bentley R.W., Pearson J., Gearry R.B., Barclay M.L., McKinney C., Merriman T.R., Roberts R.L. Association of higher DEFB4 genomic copy number with Crohn’s disease. Am. J. Gastroenterol. 2010;105:354–359. doi: 10.1038/ajg.2009.582. [DOI] [PubMed] [Google Scholar]
- 7.Robinson J.I., Carr I.M., Cooper D.L., Rashid L.H., Martin S.G., Emery P., Isaacs J.D., Barton A., Wilson A.G., Barrett J.H., Morgan A.W., BRAGGSS Confirmation of association of FCGR3B but not FCGR3A copy number with susceptibility to autoantibody positive rheumatoid arthritis. Hum. Mutat. 2012;33:741–749. doi: 10.1002/humu.22031. [DOI] [PubMed] [Google Scholar]
- 8.Krepischi A.C., Achatz M.I., Santos E.M., Costa S.S., Lisboa B.C., Brentani H., Santos T.M., Gonçalves A., Nóbrega A.F., Pearson P.L. Germline DNA copy number variation in familial and early-onset breast cancer. Breast Cancer Res. 2012;14:R24. doi: 10.1186/bcr3109. [DOI] [PMC free article] [PubMed] [Google Scholar]
- 9.Diskin S.J., Li M., Hou C., Yang S., Glessner J., Hakonarson H., Bucan M., Maris J.M., Wang K. Adjustment of genomic waves in signal intensities from whole-genome SNP genotyping platforms. Nucleic Acids Res. 2008;36:e126. doi: 10.1093/nar/gkn556. [DOI] [PMC free article] [PubMed] [Google Scholar]
- 10.Wang K., Bucan M. Copy number variation detection via high-density SNP genotyping. CSH Protoc. 2008;2008:top46. doi: 10.1101/pdb.top46. [DOI] [PubMed] [Google Scholar]
- 11.Wang K., Li M., Hadley D., Liu R., Glessner J., Grant S.F., Hakonarson H., Bucan M. PennCNV: an integrated hidden Markov model designed for high-resolution copy number variation detection in whole-genome SNP genotyping data. Genome Res. 2007;17:1665–1674. doi: 10.1101/gr.6861907. [DOI] [PMC free article] [PubMed] [Google Scholar]
- 12.Wu L.Y., Chipman H.A., Bull S.B., Briollais L., Wang K. A Bayesian segmentation approach to ascertain copy number variations at the population level. Bioinformatics. 2009;25:1669–1679. doi: 10.1093/bioinformatics/btp270. [DOI] [PubMed] [Google Scholar]
- 13.Ponchel F., Toomes C., Bransfield K., Leong F.T., Douglas S.H., Field S.L., Bell S.M., Combaret V., Puisieux A., Mighell A.J. Real-time PCR based on SYBR-Green I fluorescence: an alternative to the TaqMan assay for a relative quantification of gene rearrangements, gene amplifications and micro gene deletions. BMC Biotechnol. 2003;3:18. doi: 10.1186/1472-6750-3-18. [DOI] [PMC free article] [PubMed] [Google Scholar]
- 14.Kim S.Y., Kim J.H., Chung Y.J. Effect of combining multiple CNV defining algorithms on the reliability of CNV calls from SNP genotyping data. Genomics Inform. 2012;10:194–199. doi: 10.5808/GI.2012.10.3.194. [DOI] [PMC free article] [PubMed] [Google Scholar]
- 15.Shi J., Li P. An integrative segmentation method for detecting germline copy number variations in SNP arrays. Genet. Epidemiol. 2012;36:373–383. doi: 10.1002/gepi.21631. [DOI] [PubMed] [Google Scholar]
- 16.Coin L.J., Asher J.E., Walters R.G., Moustafa J.S., de Smith A.J., Sladek R., Balding D.J., Froguel P., Blakemore A.I. cnvHap: an integrative population and haplotype-based multiplatform model of SNPs and CNVs. Nat. Methods. 2010;7:541–546. doi: 10.1038/nmeth.1466. [DOI] [PubMed] [Google Scholar]
- 17.Dellinger A.E., Saw S.M., Goh L.K., Seielstad M., Young T.L., Li Y.J. Comparative analyses of seven algorithms for copy number variant identification from single nucleotide polymorphism arrays. Nucleic Acids Res. 2010;38:e105. doi: 10.1093/nar/gkq040. [DOI] [PMC free article] [PubMed] [Google Scholar]
- 18.Johansson A.C., Feuk L. Characterization of copy number-stable regions in the human genome. Hum. Mutat. 2011;32:947–955. doi: 10.1002/humu.21524. [DOI] [PubMed] [Google Scholar]
- 19.Korn J.M., Kuruvilla F.G., McCarroll S.A., Wysoker A., Nemesh J., Cawley S., Hubbell E., Veitch J., Collins P.J., Darvishi K. Integrated genotype calling and association analysis of SNPs, common copy number polymorphisms and rare CNVs. Nat. Genet. 2008;40:1253–1260. doi: 10.1038/ng.237. [DOI] [PMC free article] [PubMed] [Google Scholar]
- 20.Davis L. Commentary “In Search of Genomic Stability: Characterizing Copy Number Stable Regions”. Hum. Mutat. 2011;32:v. [Google Scholar]
- 21.Hindorff L.A., Sethupathy P., Junkins H.A., Ramos E.M., Mehta J.P., Collins F.S., Manolio T.A. Potential etiologic and functional implications of genome-wide association loci for human diseases and traits. Proc. Natl. Acad. Sci. USA. 2009;106:9362–9367. doi: 10.1073/pnas.0903103106. [DOI] [PMC free article] [PubMed] [Google Scholar]
- 22.Nicolae D.L., Gamazon E., Zhang W., Duan S., Dolan M.E., Cox N.J. Trait-associated SNPs are more likely to be eQTLs: annotation to enhance discovery from GWAS. PLoS Genet. 2010;6:e1000888. doi: 10.1371/journal.pgen.1000888. [DOI] [PMC free article] [PubMed] [Google Scholar]
- 23.Gamazon E.R., Zhang W., Konkashbaev A., Duan S., Kistner E.O., Nicolae D.L., Dolan M.E., Cox N.J. SCAN: SNP and copy number annotation. Bioinformatics. 2010;26:259–262. doi: 10.1093/bioinformatics/btp644. [DOI] [PMC free article] [PubMed] [Google Scholar]
- 24.Nica A.C., Parts L., Glass D., Nisbet J., Barrett A., Sekowska M., Travers M., Potter S., Grundberg E., Small K., MuTHER Consortium The architecture of gene regulatory variation across multiple human tissues: the MuTHER study. PLoS Genet. 2011;7:e1002003. doi: 10.1371/journal.pgen.1002003. [DOI] [PMC free article] [PubMed] [Google Scholar]
- 25.Abecasis G.R., Altshuler D., Auton A., Brooks L.D., Durbin R.M., Gibbs R.A., Hurles M.E., McVean G.A., 1000 Genomes Project Consortium A map of human genome variation from population-scale sequencing. Nature. 2010;467:1061–1073. doi: 10.1038/nature09534. [DOI] [PMC free article] [PubMed] [Google Scholar]
- 26.Wellcome Trust Case Control Consortium Genome-wide association study of 14,000 cases of seven common diseases and 3,000 shared controls. Nature. 2007;447:661–678. doi: 10.1038/nature05911. [DOI] [PMC free article] [PubMed] [Google Scholar]
- 27.MacArthur D.G., Balasubramanian S., Frankish A., Huang N., Morris J., Walter K., Jostins L., Habegger L., Pickrell J.K., Montgomery S.B., 1000 Genomes Project Consortium A systematic survey of loss-of-function variants in human protein-coding genes. Science. 2012;335:823–828. doi: 10.1126/science.1215040. [DOI] [PMC free article] [PubMed] [Google Scholar]
- 28.Neale B.M., Kou Y., Liu L., Ma’ayan A., Samocha K.E., Sabo A., Lin C.F., Stevens C., Wang L.S., Makarov V. Patterns and rates of exonic de novo mutations in autism spectrum disorders. Nature. 2012;485:242–245. doi: 10.1038/nature11011. [DOI] [PMC free article] [PubMed] [Google Scholar]
- 29.O’Roak B.J., Vives L., Girirajan S., Karakoc E., Krumm N., Coe B.P., Levy R., Ko A., Lee C., Smith J.D. Sporadic autism exomes reveal a highly interconnected protein network of de novo mutations. Nature. 2012;485:246–250. doi: 10.1038/nature10989. [DOI] [PMC free article] [PubMed] [Google Scholar]
- 30.Sanders S.J., Murtha M.T., Gupta A.R., Murdoch J.D., Raubeson M.J., Willsey A.J., Ercan-Sencicek A.G., DiLullo N.M., Parikshak N.N., Stein J.L. De novo mutations revealed by whole-exome sequencing are strongly associated with autism. Nature. 2012;485:237–241. doi: 10.1038/nature10945. [DOI] [PMC free article] [PubMed] [Google Scholar]
- 31.Iossifov I., Ronemus M., Levy D., Wang Z., Hakker I., Rosenbaum J., Yamrom B., Lee Y.H., Narzisi G., Leotta A. De novo gene disruptions in children on the autistic spectrum. Neuron. 2012;74:285–299. doi: 10.1016/j.neuron.2012.04.009. [DOI] [PMC free article] [PubMed] [Google Scholar]
- 32.Mills R.E., Walter K., Stewart C., Handsaker R.E., Chen K., Alkan C., Abyzov A., Yoon S.C., Ye K., Cheetham R.K., 1000 Genomes Project Mapping copy number variation by population-scale genome sequencing. Nature. 2011;470:59–65. doi: 10.1038/nature09708. [DOI] [PMC free article] [PubMed] [Google Scholar]
- 33.Gamazon E.R., Nicolae D.L., Cox N.J. A study of CNVs as trait-associated polymorphisms and as expression quantitative trait loci. PLoS Genet. 2011;7:e1001292. doi: 10.1371/journal.pgen.1001292. [DOI] [PMC free article] [PubMed] [Google Scholar]
- 34.Conrad D.F., Pinto D., Redon R., Feuk L., Gokcumen O., Zhang Y., Aerts J., Andrews T.D., Barnes C., Campbell P., Wellcome Trust Case Control Consortium Origins and functional impact of copy number variation in the human genome. Nature. 2010;464:704–712. doi: 10.1038/nature08516. [DOI] [PMC free article] [PubMed] [Google Scholar]
- 36.Storey J.D., Tibshirani R. Statistical significance for genomewide studies. Proc. Natl. Acad. Sci. USA. 2003;100:9440–9445. doi: 10.1073/pnas.1530509100. [DOI] [PMC free article] [PubMed] [Google Scholar]
- 37.Below J.E., Gamazon E.R., Morrison J.V., Konkashbaev A., Pluzhnikov A., McKeigue P.M., Parra E.J., Elbein S.C., Hallman D.M., Nicolae D.L. Genome-wide association and meta-analysis in populations from Starr County, Texas, and Mexico City identify type 2 diabetes susceptibility loci and enrichment for expression quantitative trait loci in top signals. Diabetologia. 2011;54:2047–2055. doi: 10.1007/s00125-011-2188-3. [DOI] [PMC free article] [PubMed] [Google Scholar]
- 38.Davis L.K., Gamazon E.R., Kistner-Griffin E., Badner J.A., Liu C., Cook E.H., Sutcliffe J.S., Cox N.J. Loci nominally associated with autism from genome-wide analysis show enrichment of brain expression quantitative trait loci but not lymphoblastoid cell line expression quantitative trait loci. Mol. Autism. 2012;3:3. doi: 10.1186/2040-2392-3-3. [DOI] [PMC free article] [PubMed] [Google Scholar]
- 39.Davis L.K., Yu D., Keenan C.L., Gamazon E.R., Konkashbaev A.I., Derks E.M., Neale B.M., Yang J., Lee S.H., Evans P. Partitioning the heritability of Tourette syndrome and obsessive compulsive disorder reveals differences in genetic architecture. PLoS Genet. 2013;9:e1003864. doi: 10.1371/journal.pgen.1003864. [DOI] [PMC free article] [PubMed] [Google Scholar]
- 40.Gamazon E.R., Huang R.S., Cox N.J. SCAN: a systems biology approach to pharmacogenomic discovery. Methods Mol. Biol. 2013;1015:213–224. doi: 10.1007/978-1-62703-435-7_14. [DOI] [PMC free article] [PubMed] [Google Scholar]
- 41.Ernst J., Kellis M. Discovery and characterization of chromatin states for systematic annotation of the human genome. Nat. Biotechnol. 2010;28:817–825. doi: 10.1038/nbt.1662. [DOI] [PMC free article] [PubMed] [Google Scholar]
- 42.Ernst J., Kheradpour P., Mikkelsen T.S., Shoresh N., Ward L.D., Epstein C.B., Zhang X., Wang L., Issner R., Coyne M. Mapping and analysis of chromatin state dynamics in nine human cell types. Nature. 2011;473:43–49. doi: 10.1038/nature09906. [DOI] [PMC free article] [PubMed] [Google Scholar]
- 43.Quinlan A.R., Hall I.M. BEDTools: a flexible suite of utilities for comparing genomic features. Bioinformatics. 2010;26:841–842. doi: 10.1093/bioinformatics/btq033. [DOI] [PMC free article] [PubMed] [Google Scholar]
- 44.Gamazon, E.R., Im, H.K., Liu, C., Nicolae, D.L., and Cox, N.J. (2013) The convergence of eQTL mapping, heritability estimation and polygenic modeling: emerging spectrum of risk variation in bipolar disorder. arXiv, arXiv:13036227.
- 45.MacDonald J.R., Ziman R., Yuen R.K., Feuk L., Scherer S.W. The Database of Genomic Variants: a curated collection of structural variation in the human genome. Nucleic Acids Res. 2014;42(Database issue):D986–D992. doi: 10.1093/nar/gkt958. [DOI] [PMC free article] [PubMed] [Google Scholar]
- 46.Zollner S., Teslovich T.M. Using GWAS data to identify copy number variants contributing to common complex diseases. Stat. Sci. 2009;24:530–546. [Google Scholar]
- 47.Yang J., Lee S.H., Goddard M.E., Visscher P.M. GCTA: a tool for genome-wide complex trait analysis. Am. J. Hum. Genet. 2011;88:76–82. doi: 10.1016/j.ajhg.2010.11.011. [DOI] [PMC free article] [PubMed] [Google Scholar]
- 48.Wennerström A., Pietinalho A., Vauhkonen H., Lahtela L., Palikhe A., Hedman J., Purokivi M., Varkki E., Seppänen M., Lokki M.L., Selroos O., Finnish Sarcoidosis Study Group HLA-DRB1 allele frequencies and C4 copy number variation in Finnish sarcoidosis patients and associations with disease prognosis. Hum. Immunol. 2012;73:93–100. doi: 10.1016/j.humimm.2011.10.016. [DOI] [PubMed] [Google Scholar]
- 49.Saxena K., Kitzmiller K.J., Wu Y.L., Zhou B., Esack N., Hiremath L., Chung E.K., Yang Y., Yu C.Y. Great genotypic and phenotypic diversities associated with copy-number variations of complement C4 and RP-C4-CYP21-TNX (RCCX) modules: a comparison of Asian-Indian and European American populations. Mol. Immunol. 2009;46:1289–1303. doi: 10.1016/j.molimm.2008.11.018. [DOI] [PMC free article] [PubMed] [Google Scholar]
- 50.Ounissi-Benkalha H., Polychronakos C. The molecular genetics of type 1 diabetes: new genes and emerging mechanisms. Trends Mol. Med. 2008;14:268–275. doi: 10.1016/j.molmed.2008.04.002. [DOI] [PubMed] [Google Scholar]
- 51.Mehers K.L., Gillespie K.M. The genetic basis for type 1 diabetes. Br. Med. Bull. 2008;88:115–129. doi: 10.1093/bmb/ldn045. [DOI] [PubMed] [Google Scholar]
- 52.Consortium G., GTEx Consortium The Genotype-Tissue Expression (GTEx) project. Nat. Genet. 2013;45:580–585. doi: 10.1038/ng.2653. [DOI] [PMC free article] [PubMed] [Google Scholar]
- 53.Keinan A., Clark A.G. Recent explosive human population growth has resulted in an excess of rare genetic variants. Science. 2012;336:740–743. doi: 10.1126/science.1217283. [DOI] [PMC free article] [PubMed] [Google Scholar]
- 54.Kiezun A., Garimella K., Do R., Stitziel N.O., Neale B.M., McLaren P.J., Gupta N., Sklar P., Sullivan P.F., Moran J.L. Exome sequencing and the genetic basis of complex traits. Nat. Genet. 2012;44:623–630. doi: 10.1038/ng.2303. [DOI] [PMC free article] [PubMed] [Google Scholar]
- 55.Nguyen D.Q., Webber C., Hehir-Kwa J., Pfundt R., Veltman J., Ponting C.P. Reduced purifying selection prevails over positive selection in human copy number variant evolution. Genome Res. 2008;18:1711–1723. doi: 10.1101/gr.077289.108. [DOI] [PMC free article] [PubMed] [Google Scholar]
- 56.Bell J. On the problem of hidden variables in quantum mechanics. Rev. Mod. Phys. 1966;38:447–452. [Google Scholar]
- 57.Gamazon E.R., Huang R.S., Dolan M.E., Cox N.J., Im H.K. Integrative genomics: quantifying significance of phenotype-genotype relationships from multiple sources of high-throughput data. Front. Genet. 2012;3:202. doi: 10.3389/fgene.2012.00202. [DOI] [PMC free article] [PubMed] [Google Scholar]
- 58.Mathai A.M., Provost S.B. Dekker; New York: 1992. Quadratic Forms in Random Variables: Theory and Applications: M. [Google Scholar]
Associated Data
This section collects any data citations, data availability statements, or supplementary materials included in this article.
Supplementary Materials
This analysis identified a list of cni-GWAS eSNPs with conditionally independent sources of association with the immune-related diseases (T1D, RA, and CD). Shown are the beta, the standard error of the beta, and the p value from the joint eSNP analysis as well as the gene targets of each eSNP.