

Abstract
Intratumor heterogeneity implies heterogeneous protein function, facilitating tumor adaptation which results in therapeutic failure. We hypothesized that tumor heterogeneity at protein level may influence the course of the disease. As a single biopsy might not represent the full biologic complexity of the tumor, we have analyzed immunohistochemically four different cores obtained from each primary tumor within the cohort of 364 patients with endometrial cancer (EC). The following proteins were examined: estrogen receptor 1 (ESR1), progesterone receptor, epidermal growth factor receptor, v-erb-b2 erythroblastic leukemia viral oncogene homolog 2, receptor tyrosine-protein kinase erbB-3, v-erb-b2 avian erythroblastic leukemia viral oncogene homolog 4, phosphatidylinositol-4,5-bisphosphate 3-kinase, phosphorylated v-akt murine thymoma viral oncogene homolog 1, v-myc avian myelocytomatosis viral oncogene homolog, DNA topoisomerase II alpha 170 kDa (TOP2A), cyclin-dependent kinase inhibitor 2A (CDKN2A), tumor protein p53, RAD21 homolog, S. pombe, and runt-related transcription factor 1. Particularly strong correlation was found between TOP2A and CDKN2A heterogeneity and higher stage of the disease (P = .0002 and P = .0003, respectively). Most correlations with clinicopathologic data were observed for ESR1 heterogeneity that correlated with non-endometrioid carcinomas (P=.02), higher stage (P=.005), grade (P=.01), and the presence of metastases (P = .01). Thirty-nine (11.0%) patients were classified as “globally heterogeneous”. Cumulative tumor heterogeneity strongly correlated with the presence of metastases, higher stage, and higher grade of the disease (all P b .05). It also carried negative prognostic value (P=.0008). We show that the degree of heterogeneity in EC might serve as a clinically valid molecular marker.
Introduction
Endometrial cancer (EC) is the most frequent malignancy of the female genital tract in the Western world, with approximately 90,000 new cases registered each year in the European Union [1]. Despite the high prevalence, the understanding of the molecular background of EC with regard to its pathogenesis and disease progression remains insufficient. Data concerning tumor heterogeneity in EC are especially scarce. Recent discoveries have shown that tumor composition is heterogeneous and consists of various cell clones. This intratumor heterogeneity depends on heterogeneous protein function, which can facilitate tumor adaptation, resulting in therapeutic failure through Darwinian selection [2]. Furthermore, intratumor heterogeneity was detected in all types of studied cancers [3], [4] and may lead to more aggressive tumor behavior and unfavorable outcome [5], [6].
As a single biopsy might not represent the full biologic complexity of the tumor, we used immunohistochemistry (IHC) to analyze four different cores obtained from each primary tumor within the cohort of patients with EC. Tumor heterogeneity might affect the response to treatment. Thus, the study included the expression analysis of the proteins often related to target therapies. The following proteins were examined: estrogen receptor 1 (ESR1), progesterone receptor (PGR), epidermal growth factor receptor (ERBB1), v-erb-b2 erythroblastic leukemia viral oncogene homolog 2(ERBB2, also known as HER2), receptor tyrosine-protein kinase erbB-3 (ERBB3), v-erb-b2 avian erythroblastic leukemia viral oncogene homolog 4 (ERBB4), phosphatidylinositol-4,5-bisphosphate 3-kinase (PIK3CA), phosphorylated v-akt murine thymoma viral oncogene homolog 1 (pAKT1), v-myc avian myelocytomatosis viral oncogene homolog (MYC), DNA topoisomerase II alpha, 170 kDa (TOP2A), cyclin-dependent kinase inhibitor 2A (CDKN2A, also known as p16), tumor protein p53 (TP53), RAD21 (RAD21 homolog, S. pombe), and runt-related transcription factor 1 (RUNX1). We hypothesized that the existence of cellular heterogeneity within the tumor, identified in four different cores (analyzed by IHC) belonging to the same patient, may influence the course of the disease and affect patients’ survival.
Patients and Methods
Patients and Tissues
The study included 364 formalin-fixed paraffin-embedded (FFPE) primary tumor samples retrospectively collected from a cohort of EC patients who were operated in the Department of Gynaecology, Gynaecological Oncology and Gynaecological Endocrinology, Medical University of Gdańsk (Gdańsk, Poland) between 2000 and 2010. Each patient was primarily treated by surgery, with the possible option of radiotherapy and/or chemotherapy administration. The inclusion criteria were operable EC (stage IVB patients underwent cytoreductive surgery) confirmed by histologic examination and a signed consent form. The study was accepted by the Independent Ethics Committee of the Medical University of Gdańsk (NKEBN/269/2009, date: 14 September 2009). Procedures involving human subjects were in accordance with the Helsinki Declaration of 1975, as revised in 1983.
The tumor samples included all stages of endometrial carcinoma, from stage IA to IVB, as distinguished by the International Federation of Gynecology and Obstetrics (FIGO) in 2009 [7]. We analyzed all primary carcinomas of the uterine corpus, separating them into endometrioid and non-endometrioid tumors. The latter included serous, clear cell, mucinous, mixed, squamous cell, and undifferentiated carcinomas [8]. Metastases included lymph node and distant metastases. The patients’ characteristics are summarized in Table 1. The median age was 63 (range, 26-89 years). Patients with a body mass index higher than 30 were classified as obese [9]. A survival analysis was performed for 362 (99.5%) patients. After a median follow-up of 72.5 months (range, 0-158), 107 (29.4%) patients had died. The last follow-up data were collected in September 2013. The study was performed in accordance with the REcommendations for Tumor MARKer Prognostic Studies (REMARK) criteria [10].
Table 1.
EC Patients' Characteristics (N = 364)
| Variable | Number of Cases (%) |
|---|---|
| Menopausal status | |
| Premenopausal | 27 (7.4%) |
| Perimenopausal | 22 (6.0%) |
| Postmenopausal | 314 (86.3%) |
| Missing data | 1 (0.3%) |
| Age | |
| ≤ 50 years | 39 (10.7%) |
| > 50 years | 325 (89.3%) |
| Obesity | |
| Absent | 173 (47.5%) |
| Present | 190 (52.2%) |
| Missing data | 1 (0.3%) |
| Histology | |
| Endometrioid | 332 (91.2%) |
| Non-endometrioid | 27 (7.4%) |
| Missing data | 5 (1.4%) |
| Stage (FIGO) | |
| IA-IB | 246 (67.6%) |
| II | 53 (14.6%) |
| IIIA-IIIC | 44 (12.1%) |
| IVA-IVB | 16 (4.4%) |
| Missing data | 5 (1.4%) |
| Grade | |
| I | 173 (47.5%) |
| II | 134 (36.8%) |
| III | 47 (12.9%) |
| Missing data | 10 (2.7%) |
| Cervical invasion | |
| Absent | 268 (73.6%) |
| Present | 91 (25.0%) |
| Missing data | 5 (1.4%) |
| Myometrial infiltration | |
| ≤ 1/2 | 168 (46.2%) |
| > 1/2 | 191 (52.3%) |
| Missing data | 5 (1.4%) |
| Metastases | |
| Absent | 321 (88.2%) |
| Present | 34 (9.3%) |
| Missing data | 9 (2.5%) |
IHC on Tissue Microarrays
Samples were collected by surgical excision before any systemic treatment and were fixed in 10% (vol/vol) neutral buffered formalin for up to 24 hours, dehydrated in 70% ethanol, and embedded in paraffin. FFPE tissue blocks were stored at room temperature for up to 14 years. The percentage of tumor cells in each FFPE specimen was evaluated by hematoxylin and eosin staining reviewed by a certified pathologist. Tissue microarrays (TMAs) were constructed from FFPE surgical resection tumor specimens and control samples. Four 1.5-mm-diameter cores from each tumor were obtained from the most representative areas (well-preserved fragments of invasive carcinoma, without necrosis, autolysis, and squamous metaplasia) using a tissue-arraying instrument (MTA-I; Beecher Instruments, Sun Prairie, WI), and then reembedded in microarray blocks. Punches of normal tissues were added to each array to introduce built-in internal controls to the system. Consecutive 4-μm-thick TMA sections were cut and placed on charged polylysine-coated slides (Superfrost Plus; BDH, Braunschweig, Germany) for subsequent IHC analysis.
Protein expression was examined by IHC on TMA blocks using the following antibodies: ESR1 – clone SP1 (Roche, Basel, Switzerland), PGR – clone 1E2 (Roche), ERBB1 – clone EGFR113 (Novocastra, Wetzlar, Germany), ERBB2 – clone 4B5 (Roche), ERBB3 – clone DAK-H3-IC (DAKO, Glostrup, Denmark), ERBB4 – clone HFR1 (Abcam, Cambridge, United Kingdom), PIK3CA – clone C73F8 (Cell Signaling Technology, Danvers, MA), pAKT1 – clone D9E (Cell Signaling Technology), MYC – clone 9E11 (Novocastra), TOP2A – clone Ki-S1 (DAKO), CDKN2A – clone JC8 (Santa Cruz Biotechnology, Dallas, TX), TP53 – clone BP-53-11 (Roche), RAD21 – polyclonal antibody (Abcam), and RUNX1 – clone DW71 (Santa Cruz Biotechnology). The staining has been performed in accordance with the manufacturers’ guidelines; details are presented as Supplementary Materials (Table W1).
Protein expression evaluation was performed by two pathologists (H.M. and J.G.) blinded to clinical data. ESR1 and PGR evaluation of the nuclear staining was performed on the basis of Allred score [11]. ERBB2 receptor status was determined on the basis of the criteria of HercepTest (DAKO) according to the manufacturer’s guidelines, as previously described [12], [13]. The interpretation criteria for the remaining proteins were based on the intensity of the staining and the percentage of cells showing positive reaction (0-100%), which gave the final staining score, as the result of either sum or multiplication, dependent on reported criteria for a particular protein [14], [15], [16], [17], [18], [19], [20]. Data published on The Human Protein Atlas were also taken into account (http://www.proteinatlas.org/, last accessed: 16 June 2014). Cutoff point determination of expression positivity, based on result distribution, was performed with the use of Cutoff Finder Web Application [21]. Cutoff point determination of the tumor heterogeneity, understood as different staining intensities between the cores belonging to the same patient, was performed individually for each protein as the proteins differed in staining characteristics. Details are presented as Supplementary Materials (Table W2). For tumor heterogeneity evaluation, staining determination of at least three cores was required. As an example, ESR1 and TOP2A tumor heterogeneity is presented in the four cores taken from the same primary tumor sample (Figure W1, Figure W2). Additionally, cumulative heterogeneity was determined for each patient, based on nine proteins that correlated with clinicopathologic characteristics and/or survival (ESR1, PGR, PIK3CA, pAKT1, MYC, TOP2A, CDKN2A, RAD21, and RUNX1). For each patient, a score between 0 and 9 was obtained (1 point for each protein classified as heterogeneous, according to the criteria described in Table W2). On the basis of the result distribution, primary tumors with a score of at least 3 were classified as “globally” heterogeneous.
Statistical Analysis
STATISTICA software (version 10; StatSoft Co, Tulsa, OK) was used for all calculations. The tests that were used and their applications were given as follows: testing normality of the data set — Shapiro-Wilk test; comparison of the tumor heterogeneity with clinicopathologic data of the patients – crosstabs statistics with Pearson Chi-square test; correlations between the heterogeneity of the studied proteins – crosstabs statistics with Pearson Chi-square test. The Kaplan-Meier estimator was employed for survival analysis, and the generated curves were compared with the log-rank test. The endpoint for the study was overall survival (OS). OS was defined as the time from sample collection to death or censoring. Censoring was defined as loss of follow-up or alive at the end of follow-up. Statistical significance was assumed when P ≤ .05. Cox proportional hazards regression analysis was used to identify the independent predictors of OS. Univariate predictors that are significant with a value of P ≤ .10 were entered into a step-wise multivariate model to identify those with independent prognostic information.
Results
Flow of Samples
For tumor heterogeneity evaluation, staining determination of at least three cores was required. Within the group of 364 patients, tumor heterogeneity was assessed for 310 to 355 (85.2-97.5%) cases, depending on the staining success of a given protein (Table W2). Global heterogeneity was assessed for 355 patients, as cases with less than five assessed proteins were not considered in the context of global heterogeneity due to the lack of significant proportion of data. Graphical representation of tumor heterogeneity within this group is presented in Figure 1.
Figure 1.
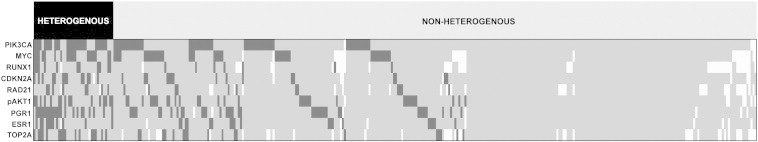
Graphical representation of tumor heterogeneity.
Correlation of Tumor Heterogeneity with Clinical and Pathologic Data
Tumor heterogeneity of the studied proteins was compared with tumor histology, grade, and stage as well as the presence of metastases (Table 2). Parameters such as menopausal status, age, obesity, or myometrial infiltration were not included in the table as these analyses yielded statistically insignificant results. Particularly strong correlation was found between TOP2A and CDKN2A heterogeneity and higher stage of the disease (P = .0002 and P = .0003, respectively). Most correlations with clinicopathologic data were observed for ESR1 heterogeneity that correlated with non-endometrioid tumors (P = .02), higher stage (P = .005), grade (P = .01), and the presence of metastases (P = .00001). No correlations were found between the studied parameters (histology, stage, grade, metastases) and the tumor heterogeneity of ERBB1, ERBB2, ERBB3, ERBB4, pAKT1, and TP53, thus these proteins were included in Table W3 only.
Table 2.
Patients Classified as Protein Heterogeneous in the Context of Clinicopathologic Data
| PIK3CA |
MYC |
TOP2A |
ESR1 |
||||||
|---|---|---|---|---|---|---|---|---|---|
| Number of Heterogeneous Samples | P Value | Number of Heterogeneous Samples | P Value | Number of Heterogeneous Samples | P Value | Number of Heterogeneous Samples | P Value | ||
| Histology | Endometrioid | 70/323 (21.7%) | .28 | 51/298 (17.1%) | .38 | 28/286 (9.8%) | .21 | 24/320 (7.5%) | .02 |
| Non-endometrioid | 8/26 (30.8%) | 6/25 (24.0%) | 4/22 (18.2%) | 5/24 (20.8%) | |||||
| Stage | I, II | 58/289 (20.1%) | .01 | 45/266 (16.9%) | .29 | 19/255 (7.5%) | .0002 | 14/238 (5.9%) | .005 |
| III, IV | 21/60 (35.0%) | 13/57 (22.8%) | 13/52 (25.0%) | 15/108 (13.9%) | |||||
| Grade | 1, 2 | 64/298 (21.5%) | .15 | 42/274 (15.3%) | .002 | 24/260 (9.2%) | .14 | 21/295 (7.2%) | .01 |
| 3 | 14/45 (31.1%) | 15/43 (34.9%) | 7/42 (16.7%) | 8/43 (18.6%) | |||||
| Metastases | Absent | 65/311 (20.9%) | .02 | 49/288 (17.0%) | .10 | 25/275 (9.1%) | .02 | 20/308 (6.5%) | .01 |
| Present | 13/34 (38.2%) | 9/31 (29.0%) | 7/30 (23.3%) | 6/31 (19.4%) | |||||
| PGR |
RUNX1 |
RAD21 |
CDKN2A |
||||||
| Number of Heterogeneous Samples | P Value | Number of Heterogeneous Samples | P Value | Number of Heterogeneous Samples | P Value | Number of Heterogeneous Samples | P Value | ||
| Histology | Endometrioid | 52/318 (16.4%) | .20 | 16/283 (5.7%) | .79 | 17/296 (5.7%) | .18 | 23/319 (7.2%) | .03 |
| Non-endometrioid | 7/27 (25.9%) | 1/23 (4.4%) | 3/24 (12.5%) | 5/26 (19.2%) | |||||
| Stage | I, II | 48/286 (16.8%) | .33 | 10/252 (4.0%) | .002 | 13/268 (4.9%) | .005 | 17/285 (6.0%) | .0003 |
| III, IV | 13/59 (22.0%) | 8/53 (15.1%) | 8/52 (15.4%) | 12/59 (20.3%) | |||||
| Grade | 1, 2 | 46/297 (15.5%) | .004 | 14/258 (5.4%) | .66 | 17/270 (6.3"%) | .92 | 20/296 (6.8%) | .001 |
| 3 | 14/42 (33.3%) | 3/42 (7.1%) | 3/45 (6.7%) | 9/42 (21.4%) | |||||
| Metastases | Absent | 52/308 (16.9%) | .14 | 13/274 (4.7%) | .005 | 14/290 (4.8%) | .00004 | 20/307 (6.5%) | .0004 |
| Present | 9/33 (27.3%) | 5/28 (17.9%) | 7/28 (25.0%) | 8/33 (24.2%) | |||||
Correlations between the Heterogeneity of the Studied Proteins
Tumor heterogeneity of the studied proteins was compared with each other. Strong correlation was found between ESR1 and PGR heterogeneity (r = 0.30, P = .000002), ESR1 and RAD21 heterogeneity (r = 0.23, P = .0003), and pAKT1 and ERBB1 heterogeneity (r = 0.24, P = .0002).
Survival Analysis
Protein heterogeneity of MYC, TOP2A, ESR1, and RAD21 correlated with shortened OS. The same trend was observed for ERBB4, RUNX1, and CDKN2A. No prognostic impact was detected for ERBB1, ERBB2, ERBB3, PIK3CA, pAKT1, PGR, and TP53 tumor heterogeneity (Table 3). Staining intensity was also analyzed in the context of prognosis. Low ESR1, PGR, and ERBB3 expression as well as high ERBB2, TOP2A, and TP53 expression correlated with shorter OS (Table W4).
Table 3.
Univariate Analysis of Protein Tumor Heterogeneity as Prognostic Factors in EC
| Status of the Analyzed Protein (Heterogeneous vs Non-heterogeneous) | Univariate Analysis |
||
|---|---|---|---|
| HR | 95% CI | P Value | |
| ERBB1 | 0.51 | 0.16-1.61 | .25 |
| ERBB2 | 1.36 | 0.80-2.32 | .25 |
| ERBB3 | 0.76 | 0.51-1.13 | .17 |
| ERBB4 | 1.42 | 0.96-2.10 | .08 |
| PIK3CA | 1.11 | 0.70-1.75 | .65 |
| MYC | 1.7 | 1.08-2.70 | .02 |
| pAKT1 | 1.31 | 0.78-2.20 | .31 |
| TOP2A | 2.11 | 1.24-3.60 | .006 |
| ESR1 | 1.89 | 1.06-3.34 | .03 |
| PGR | 1.42 | 0.88-2.30 | .15 |
| RUNX1 | 1.99 | 0.99-4.00 | .05 |
| RAD21 | 2.23 | 1.17-4.23 | .01 |
| CDKN2A | 1.75 | 0.97-3.16 | .06 |
| TP53 | 1.11 | 0.66-1.86 | .70 |
Note: HR, hazard ratio; CI, confidence interval.
Cumulative Tumor Heterogeneity
As hierarchical clustering of the results brought no satisfying results (data not shown), we scored the heterogeneity of the proteins, which have yielded statistically significant correlations with either clinicopathologic data and/or survival. The proteins included in the cumulative tumor heterogeneity assessment were given as follows: ESR1, PGR, PIK3CA, pAKT1, MYC, TOP2A, CDKN2A, RAD21, and RUNX1. Thirty-nine (11.0%) patients were classified as “globally heterogeneous”, with a score of at least 3. One hundred forty-three (40.3%) patients were entirely homogenous, with a score of 0. Cumulative tumor heterogeneity was compared with clinicopathologic data and OS (Table 4 and Figure 2). It correlated with higher stage, higher grade, non-endometrioid histology, and the presence of metastases as well as shorter OS (all P < .05). Due to multiple correlations among the studied parameters, only global tumor heterogeneity, not the heterogeneity of separate proteins, was included into the multivariate analysis. Cumulative heterogeneity remained an independent prognostic factor, along with the stage and tumor histology (Table 5).
Table 4.
Patients Classified as Globally Heterogeneous in the Context of Clinicopathologic Data
| Number of Positive Samples | P Value | ||
|---|---|---|---|
| Histology | Endometrioid | 31/323 (9.6%) | .04 |
| Non-endometrioid | 6/27 (22.2%) | ||
| Stage | I, II | 24/291 (8.3%) | .001 |
| III, IV | 13/59 (22.0%) | ||
| Grade | 1, 2 | 24/300 (8.0%) | .00003 |
| 3 | 13/44 (29.6%) | ||
| Metastases | Absent | 25/313 (8.3%) | .00001 |
| Present | 11/33 (33.3%) |
Figure 2.
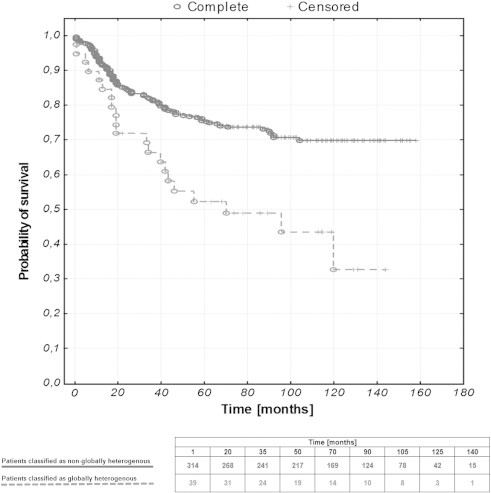
Kaplan-Meier curves representing the OS of EC patients stratified against the status of global tumor heterogeneity (P = .0008).
Table 5.
Univariate and Multivariate Analyses of Clinicopathologic Data and Global Tumor Heterogeneity as Prognostic factors in EC Patients
| Analyzed Parameter | Univariate Analysis |
Multivariate Analysis |
||||
|---|---|---|---|---|---|---|
| HR | 95% CI | P Value | HR | 95% CI | P Value | |
| Histology (non-endometrioid vs endometrioid) | 4.36 | 2.61-7.29 | .0000001 | 3.68 | 2.16-6.27 | .000002 |
| Stage (III, IV vs I, II) | 1.97 | 1.62-2.39 | .0000001 | 1.58 | 1.20-2.10 | .001 |
| Grade (3 vs 1, 2) | 1.38 | 1.09-1.74 | .008 | Not significant | ||
| Metastases (present vs absent) | 3.60 | 2.23-5.81 | .0000001 | Not significant | ||
| Tumor heterogeneity (present vs absent) | 2.33 | 1.44-3.76 | .0005 | 1.71 | 1.05-2.80 | .03 |
Discussion
Intratumor heterogeneity is presumed to be the main reason based on a single biopsy personalized treatment failure [2]. It can also disturb pathologic evaluation of the tumor and thus diagnosis. However, emerging evidence suggests that the heterogeneity degree itself might serve as a clinically valid molecular marker [22], [23]. Although genetic landscape of endometrial carcinoma has been extensively studied [24], the protein heterogeneity in EC has received far less attention. Analysis of the four cores collected from different regions of the primary tumor provided evidence of protein heterogeneity in the majority of the studied patients with EC. Thus, a single biopsy indeed reveals only a small fraction of protein expression changes present in an entire tumor.
Heterogeneity of tumors has been extensively studied in breast cancer. Breast carcinomas were shown to possess allelic imbalance, karyotypic diversity, and cell subpopulations of diverse therapy sensitivity [25], [26]. Furthermore, variable expression of ERBB2, cyclin D1 (CCND1), MYC, and TOP2A has been reported within breast tumors [27], [28]. Triple negative breast carcinoma, known from its aggressiveness and unfavorable prognosis, was characterized by explicit intratumor genetic heterogeneity [29]. In non–small cell lung cancer, ERBB1 amplification heterogeneity lowered targeted therapy efficiency [30]. ERBB2 heterogeneity reported in endometrial and gastric cancers was found to be the reason for discordant results with fluorescence in situ hybridization [31], [32]. Yoon et al. have demonstrated that heterogeneous amplification of ERBB2 in esophageal adenocarcinoma confers poor prognosis [33]. Studies of esophageal precancers revealed that the degree of clonal diversity was found to increase the probability of progression from esophageal precancer to adenocarcinoma [22]. Minor subpopulations of primary tumors were shown to be responsible for relapse after drug administration [34]. Intratumor heterogeneity of PTEN protein expression corresponded with loss of heterozygosity and shorter OS in glioblastoma [35]. Tumor heterogeneity of Ki-67 protein in prostate cancer correlated with more aggressive tumor characteristics [5]. In this study, we have demonstrated that heterogeneity of individual proteins, namely PIK3CA, MYC, TOP2A, ESR1, PGR, RUNX1, RAD21, and CDKN2A, correlates with more aggressive tumor behavior and, in case of MYC, TOP2A, ESR1, and RAD21, also confers poor prognosis. Interestingly, prognostic significance of the studied proteins depends on whether the heterogeneity or the expression level is being analyzed. Apart from ESR1, PGR, and TOP2A, which were significantly correlated with prognosis in terms of both the heterogeneity and the expression level, there were also proteins that were either informative in the context of tumor heterogeneity (PIK3CA, MYC, CDKN2A, RAD21, and RUNX1) or protein expression level (ERBB2, ERBB3, and TP53). Thus, protein heterogeneity and staining intensity might be two distinct phenomena, differently reflecting the course of the disease.
Correlations between protein heterogeneity of ESR1 and PGR, ESR1 and RAD21, and ERBB1 and pAKT1 were especially strong. ESR1 and PGR1 expression was found to correlate strongly in EC [36]. Investigation of ERBB1 and pAKT1 expression revealed strong correlation between those two proteins in head and neck squamous cell carcinoma [37]. Similarly, we have found statistically significant correlations between ESR1 and PGR, ESR1 and RAD21, and ERBB1 and pAKT1 (data not shown). Mentioned proteins are functionally related. Perhaps if their expression is co-dependent, so could be the heterogeneity.
Cumulative tumor heterogeneity of selected proteins’ heterogeneity proved to be an independent predictor of survival and showed the strongest correlations with clinicopathologic data. Apparently, simultaneous analysis of a large number of protein markers gives more thorough image of clonal diversity present in the tumor. Therefore, we conclude that the larger the extent of intratumor heterogeneity in EC, the more aggressive the tumor behavior is and thus the worse the prognosis is.
One of the limitations of the study was relatively short follow-up period. Furthermore, due to variable quality and sometimes small amount of collected material, reliable analysis of all four cores per patient not always could have been achieved. This issue was even greater in case of global protein heterogeneity determination. However, despite TMA limitations, there is an increasing number of publications based on tumor microarrays due to their convenience. Even if performed analysis included four cores per patient, which represents only a small proportion of the tumor studied, this number still remains significant and gives deeper insight into tumor composition than commonly used one core. Perhaps a method of Spiral Array block generation would be of even better use for heterogeneity determination [38]. Nevertheless, it was our study that indicated clearly the heterogeneity of which proteins might be of use in EC.
Another problem was the lack of a unified system that would serve accessing the heterogeneity within the studied markers. However, the analyzed proteins have different functions within cells, which means that they differ in terms of localization and quantity. Ergo, different scoring criteria had to be assumed and unified evaluation and cutoff determination were simply not feasible.
The studies concerning intratumor heterogeneity were primarily performed at the genomic or transcriptomic level [2], [39], [40], [41] and the contribution of tumor diversity to disease progression has so far received rather scarce attention. Nevertheless, effective cancer treatment requires a complex idea about tumor structure and intratumor heterogeneity needs to be taken into account [23]. To the best of our knowledge, we are the first to present tumor heterogeneity distribution measured by IHC in such a wide context. We show that heterogeneity degree in EC might serve as a clinically valid molecular marker and IHC could be a fast and simple method of its determination.
The following are the supplementary data related to this article.
Consecutive cores of Patient No. 276 illustrating the tumor heterogeneity in the context of estrogen receptor staining.
Consecutive cores of Patient No. 125 illustrating the tumor heterogeneity in the context of topoisomerase II staining.
IHC Staining Details
Details of IHC Evaluation
Patients Classified as Protein Heterogeneous in the Context of Clinicopathologic Data (Additional Proteins)
Univariate Analysis of Protein Staining Intensity as Prognostic Factors in EC
Acknowledgments
The research has been financed by the Ministry of Science and Higher Education under grant N407571538. The research has been co-financed by the European Commission in the framework of the European Social Fund, by the European Social Fund, by the State Budget, and by the Pomorskie Voivodeship Budget according to the Operational Programme Human Capital, Priority VIII, Action 8.2, Under-action 8.2.2: ‘Regional Innovative Strategy’ within the system project of the Pomorskie Voivodeship “InnoDoktorant – Scholarships for PhD students, Vth edition”.
Footnotes
This article refers to supplementary materials, which are designated by Tables W1–W4 and Figures W1 and W2 and are available online at www.transonc.com.
Conflict of interest statement: The authors declare that they have no conflict of interest. Statement of author contributions: S.L.-S., W.B., and D.W. acquired the specimen material. A.S., A.J.Z., and S.L.-S. conceived the study design. H.M., J.G., and A.S. carried out the experiments. A.S. and A.J.Z. analyzed the data. All authors were involved in writing the paper and had final approval of the submitted and published versions.
References
- 1.Colombo N, Preti E, Landoni F, Carinelli S, Colombo A, Marini C, Sessa C, Group EGW. Endometrial cancer: ESMO Clinical Practice Guidelines for diagnosis, treatment and follow-up. Ann Oncol. 2011;22(Suppl. 6):vi35–vi39. doi: 10.1093/annonc/mdr374. [DOI] [PubMed] [Google Scholar]
- 2.Gerlinger M, Rowan AJ, Horswell S, Larkin J, Endesfelder D, Gronroos E, Martinez P, Matthews N, Stewart A, Tarpey P. Intratumor heterogeneity and branched evolution revealed by multiregion sequencing. N Engl J Med. 2012;366:883–892. doi: 10.1056/NEJMoa1113205. [DOI] [PMC free article] [PubMed] [Google Scholar]
- 3.Meacham CE, Morrison SJ. Tumour heterogeneity and cancer cell plasticity. Nature. 2013;501:328–337. doi: 10.1038/nature12624. [DOI] [PMC free article] [PubMed] [Google Scholar]
- 4.Vogelstein B, Papadopoulos N, Velculescu VE, Zhou S, Diaz LA, Kinzler KW. Cancer genome landscapes. Science. 2013;339:1546–1558. doi: 10.1126/science.1235122. [DOI] [PMC free article] [PubMed] [Google Scholar]
- 5.Mesko S, Kupelian P, Demanes DJ, Huang J, Wang PC, Kamrava M. Quantifying the ki-67 heterogeneity profile in prostate cancer. Prostate Cancer. 2013;2013:1–5. doi: 10.1155/2013/717080. [DOI] [PMC free article] [PubMed] [Google Scholar]
- 6.Pekar G, Gere M, Tarjan M, Hellberg D, Tot T. Molecular phenotype of the foci in multifocal invasive breast carcinomas: Intertumoral heterogeneity is related to shorter survival and may influence the choice of therapy. Cancer. 2014;120:26–34. doi: 10.1002/cncr.28375. [DOI] [PubMed] [Google Scholar]
- 7.Pecorelli S. Revised FIGO staging for carcinoma of the vulva, cervix, and endometrium. Int J Gynaecol Obstet. 2009;105:103–104. doi: 10.1016/j.ijgo.2009.02.012. [DOI] [PubMed] [Google Scholar]
- 8.Tavassoli FA, Devilee P. World Health Organization; Lyon: 2003. WHO Classification of Tumours. Pathology and Genetics — Tumor of the Breast and Female Genital Organs. [Google Scholar]
- 9.WE Consultation Appropriate body-mass index for Asian populations and its implications for policy and intervention strategies. Lancet. 2004;363:157–163. doi: 10.1016/S0140-6736(03)15268-3. [DOI] [PubMed] [Google Scholar]
- 10.Altman DG, McShane LM, Sauerbrei W, Taube SE. Reporting Recommendations for Tumor Marker Prognostic Studies (REMARK): explanation and elaboration. PLoS Med. 2012;9:e1001216. doi: 10.1371/journal.pmed.1001216. [DOI] [PMC free article] [PubMed] [Google Scholar]
- 11.Allred DC, Harvey JM, Berardo M, Clark GM. Prognostic and predictive factors in breast cancer by immunohistochemical analysis. Mod Pathol. 1998;11:155–168. [PubMed] [Google Scholar]
- 12.Supernat A, Markiewicz A, Welnicka-Jaskiewicz M, Seroczynska B, Skokowski J, Sejda A, Szade J, Czapiewski P, Biernat W, Zaczek A. CD73 expression as a potential marker of good prognosis in breast carcinoma. Appl Immunohistochem Mol Morphol. 2012;20:103–107. doi: 10.1097/pai.0b013e3182311d82. [DOI] [PubMed] [Google Scholar]
- 13.Markiewicz A, Ahrends T, Wełnicka-Jaśkiewicz M, Seroczyńska B, Skokowski J, Jaśkiewicz J, Szade J, Biernat W, Zaczek AJ. Expression of epithelial to mesenchymal transition-related markers in lymph node metastases as a surrogate for primary tumor metastatic potential in breast cancer. J Transl Med. 2012;10:226. doi: 10.1186/1479-5876-10-226. [DOI] [PMC free article] [PubMed] [Google Scholar]
- 14.Ljuslinder I, Malmer B, Isaksson-Mettävainio M, Oberg A, Henriksson R, Stenling R, Palmqvist R. ErbB 1-4 expression alterations in primary colorectal cancers and their corresponding metastases. Anticancer Res. 2009;29:1489–1494. [PubMed] [Google Scholar]
- 15.Wu Y, Mohamed H, Chillar R, Ali I, Clayton S, Slamon D, Vadgama JV. Clinical significance of Akt and HER2/neu overexpression in African-American and Latina women with breast cancer. Breast Cancer Res. 2008;10:R3. doi: 10.1186/bcr1844. [DOI] [PMC free article] [PubMed] [Google Scholar]
- 16.Blancato J, Singh B, Liu A, Liao DJ, Dickson RB. Correlation of amplification and overexpression of the c-myc oncogene in high-grade breast cancer: FISH, in situ hybridisation and immunohistochemical analyses. Br J Cancer. 2004;90:1612–1619. doi: 10.1038/sj.bjc.6601703. [DOI] [PMC free article] [PubMed] [Google Scholar]
- 17.Nikolényi A, Sükösd F, Kaizer L, Csörgo E, Vörös A, Uhercsák G, Ormándi K, Lázár G, Thurzó L, Brodowicz T. Tumor topoisomerase II alpha status and response to anthracycline-based neoadjuvant chemotherapy in breast cancer. Oncology. 2011;80:269–277. doi: 10.1159/000329038. [DOI] [PubMed] [Google Scholar]
- 18.Young RJ, Rischin D, Fisher R, McArthur GA, Fox SB, Peters LJ, Corry J, Lim A, Waldeck K, Solomon B. Relationship between epidermal growth factor receptor status, p16INK4A, and outcome in head and neck squamous cell carcinoma. Cancer Epidemiol Biomarkers Prev. 2011;20:1230–1237. doi: 10.1158/1055-9965.EPI-10-1262. [DOI] [PubMed] [Google Scholar]
- 19.Esuvaranathan K, Chiong E, Thamboo TP, Chan YH, Kamaraj R, Mahendran R, Teh M. Predictive value of p53 and pRb expression in superficial bladder cancer patients treated with BCG and interferon-alpha. Cancer. 2007;109:1097–1105. doi: 10.1002/cncr.22503. [DOI] [PubMed] [Google Scholar]
- 20.Planagumà J, Díaz-Fuertes M, Gil-Moreno A, Abal M, Monge M, García A, Baró T, Thomson TM, Xercavins J, Alameda F. A differential gene expression profile reveals overexpression of RUNX1/AML1 in invasive endometrioid carcinoma. Cancer Res. 2004;64:8846–8853. doi: 10.1158/0008-5472.CAN-04-2066. [DOI] [PubMed] [Google Scholar]
- 21.Budczies J, Klauschen F, Sinn BV, Győrffy B, Schmitt WD, Darb-Esfahani S, Denkert C. Cutoff Finder: a comprehensive and straightforward Web application enabling rapid biomarker cutoff optimization. PLoS One. 2012;7:e51862. doi: 10.1371/journal.pone.0051862. [DOI] [PMC free article] [PubMed] [Google Scholar]
- 22.Maley CC, Galipeau PC, Finley JC, Wongsurawat VJ, Li X, Sanchez CA, Paulson TG, Blount PL, Risques RA, Rabinovitch PS. Genetic clonal diversity predicts progression to esophageal adenocarcinoma. Nat Genet. 2006;38:468–473. doi: 10.1038/ng1768. [DOI] [PubMed] [Google Scholar]
- 23.Gerashchenko TS, Denisov EV, Litviakov NV, Zavyalova MV, Vtorushin SV, Tsyganov MM, Perelmuter VM, Cherdyntseva NV. Intratumor heterogeneity: nature and biological significance. Biochemistry (Mosc) 2013;78:1201–1215. doi: 10.1134/S0006297913110011. [DOI] [PubMed] [Google Scholar]
- 24.Kandoth C, Schultz N, Cherniack AD, Akbani R, Liu Y, Shen H, Robertson AG, Pashtan I, Shen R, Benz CC. Integrated genomic characterization of endometrial carcinoma. Nature. 2013;497:67–73. doi: 10.1038/nature12113. [DOI] [PMC free article] [PubMed] [Google Scholar]
- 25.Fujii H, Marsh C, Cairns P, Sidransky D, Gabrielson E. Genetic divergence in the clonal evolution of breast cancer. Cancer Res. 1996;56:1493–1497. [PubMed] [Google Scholar]
- 26.Heppner GH, Miller BE. Tumor heterogeneity: biological implications and therapeutic consequences. Cancer Metastasis Rev. 1983;2:5–23. doi: 10.1007/BF00046903. [DOI] [PubMed] [Google Scholar]
- 27.Nassar A, Radhakrishnan A, Cabrero IA, Cotsonis GA, Cohen C. Intratumoral heterogeneity of immunohistochemical marker expression in breast carcinoma: a tissue microarray-based study. Appl Immunohistochem Mol Morphol. 2010;18:433–441. doi: 10.1097/PAI.0b013e3181dddb20. [DOI] [PubMed] [Google Scholar]
- 28.Glöckner S, Buurman H, Kleeberger W, Lehmann U, Kreipe H. Marked intratumoral heterogeneity of c-myc and cyclin D1 but not of c-erbB2 amplification in breast cancer. Lab Invest. 2002;82:1419–1426. doi: 10.1097/01.lab.0000032371.16521.40. [DOI] [PubMed] [Google Scholar]
- 29.Patani N, Barbashina V, Lambros MB, Gauthier A, Mansour M, Mackay A, Reis-Filho JS. Direct evidence for concurrent morphological and genetic heterogeneity in an invasive ductal carcinoma of triple-negative phenotype. J Clin Pathol. 2011;64:822–828. doi: 10.1136/jclinpath-2011-200135. [DOI] [PubMed] [Google Scholar]
- 30.Chen ZY, Zhong WZ, Zhang XC, Su J, Yang XN, Chen ZH, Yang JJ, Zhou Q, Yan HH, An SJ. EGFR mutation heterogeneity and the mixed response to EGFR tyrosine kinase inhibitors of lung adenocarcinomas. Oncologist. 2012;17:978–985. doi: 10.1634/theoncologist.2011-0385. [DOI] [PMC free article] [PubMed] [Google Scholar]
- 31.Yang J, Luo H, Li Y, Li J, Cai Z, Su X, Dai D, Du W, Chen T, Chen M. Intratumoral heterogeneity determines discordant results of diagnostic tests for human epidermal growth factor receptor (HER) 2 in gastric cancer specimens. Cell Biochem Biophys. 2012;62:221–228. doi: 10.1007/s12013-011-9286-1. [DOI] [PubMed] [Google Scholar]
- 32.Buza N, English DP, Santin AD, Hui P. Toward standard HER2 testing of endometrial serous carcinoma: 4-year experience at a large academic center and recommendations for clinical practice. Mod Pathol. 2013;26:1605–1612. doi: 10.1038/modpathol.2013.113. [DOI] [PubMed] [Google Scholar]
- 33.Yoon HH, Shi Q, Sukov WR, Lewis MA, Sattler CA, Wiktor AE, Wu TT, Diasio RB, Jenkins RB, Sinicrope FA. Adverse prognostic impact of intratumor heterogeneous HER2 gene amplification in patients with esophageal adenocarcinoma. J Clin Oncol. 2012;30:3932–3938. doi: 10.1200/JCO.2012.43.1890. [DOI] [PMC free article] [PubMed] [Google Scholar]
- 34.Mullighan CG, Phillips LA, Su X, Ma J, Miller CB, Shurtleff SA, Downing JR. Genomic analysis of the clonal origins of relapsed acute lymphoblastic leukemia. Science. 2008;322:1377–1380. doi: 10.1126/science.1164266. [DOI] [PMC free article] [PubMed] [Google Scholar]
- 35.Idoate M, Echeveste J, Diez Valle R, Lozano M, Aristu J. Biological and clinical significance of the intratumor heterogeneity of PTEN protein expression and the corresponding molecular abnormalities of the PTEN gene in glioblastomas. Neuropathol Appl Neurobiol. 2014 doi: 10.1111/nan.12117. [Epub ahead of print]. [DOI] [PubMed] [Google Scholar]
- 36.Lesniewicz T, Kanczuga-Koda L, Baltaziak M, Jarzabek K, Rutkowski R, Koda M, Wincewicz A, Sulkowska M, Sulkowski S. Comparative evaluation of estrogen and progesterone receptor expression with connexins 26 and 43 in endometrial cancer. Int J Gynecol Cancer. 2009;19:1253–1257. doi: 10.1111/IGC.0b013e3181a40618. [DOI] [PubMed] [Google Scholar]
- 37.Nijkamp MM, Hoogsteen IJ, Span PN, Takes RP, Lok J, Rijken PF, van der Kogel AJ, Bussink J, Kaanders JH. Spatial relationship of phosphorylated epidermal growth factor receptor and activated AKT in head and neck squamous cell carcinoma. Radiother Oncol. 2011;101:165–170. doi: 10.1016/j.radonc.2011.06.022. [DOI] [PubMed] [Google Scholar]
- 38.Tabata K, Tanaka T, Hayashi T, Hori T, Nunomura S, Yonezawa S, Fukuoka J. Ki-67 is a strong prognostic marker of non-small cell lung cancer when tissue heterogeneity is considered. BMC Clin Pathol. 2014;14:23. doi: 10.1186/1472-6890-14-23. [DOI] [PMC free article] [PubMed] [Google Scholar]
- 39.Buza N, Hui P. Marked heterogeneity of HER2/NEU gene amplification in endometrial serous carcinoma. Genes Chromosomes Cancer. 2013;52:1178–1186. doi: 10.1002/gcc.22113. [DOI] [PubMed] [Google Scholar]
- 40.Zhang XC, Xu C, Mitchell RM, Zhang B, Zhao D, Li Y, Huang X, Fan W, Wang H, Lerma LA. Tumor evolution and intratumor heterogeneity of an oropharyngeal squamous cell carcinoma revealed by whole-genome sequencing. Neoplasia. 2013;15:1371–1378. doi: 10.1593/neo.131400. [DOI] [PMC free article] [PubMed] [Google Scholar]
- 41.Budinska E, Popovici V, Tejpar S, D'Ario G, Lapique N, Sikora KO, Di Narzo AF, Yan P, Hodgson JG, Weinrich S. Gene expression patterns unveil a new level of molecular heterogeneity in colorectal cancer. J Pathol. 2013;231:63–76. doi: 10.1002/path.4212. [DOI] [PMC free article] [PubMed] [Google Scholar]
- 42.http://www.proteinatlas.org/
Associated Data
This section collects any data citations, data availability statements, or supplementary materials included in this article.
Supplementary Materials
Consecutive cores of Patient No. 276 illustrating the tumor heterogeneity in the context of estrogen receptor staining.
Consecutive cores of Patient No. 125 illustrating the tumor heterogeneity in the context of topoisomerase II staining.
IHC Staining Details
Details of IHC Evaluation
Patients Classified as Protein Heterogeneous in the Context of Clinicopathologic Data (Additional Proteins)
Univariate Analysis of Protein Staining Intensity as Prognostic Factors in EC