Abstract
Lipoproteins such as high-density lipoprotein (HDL) and low-density lipoprotein (LDL) are known to interact with drugs and other solutes in blood. These interactions have been examined in the past by methods such as equilibrium dialysis and capillary electrophoresis. This chapter describes an alternative approach that has recently been developed for examining these interactions by using high-performance affinity chromatography. In this method, lipoproteins are covalently immobilized to a solid support and used within a column as a stationary phase for binding studies. This approach allows the same lipoprotein preparation to be used for a large number of binding studies, leading to precise estimates of binding parameters. This chapter will discuss how this technique can be applied to the identification of interaction models and be used to differentiate between systems that have interactions based on partitioning, adsorption or mixed-mode interactions. It is also shown how this approach can then be used for the measurement of binding parameters for HDL and LDL with drugs. Examples of these studies are provided, with particular attention being given to the use of frontal analysis to examine the interactions of R- and S-propranolol with HDL and LDL. The advantages and possible limitations of this method are described. The extension of this approach to other types of drug-lipoprotein interactions is also considered.
Introduction
The interaction of drugs with serum proteins and other binding agents in blood is important in determining the apparent activity of many pharmaceutical agents once they have entered the circulatory system. For instance, these interactions will affect the distribution and pharmacokinetics of numerous drugs in the body [1-3]. The presence of direct or indirect competition between a drug and another agent (e.g., another drug or endogenous compound) for the same binding sites on a serum agent can also be an important source of drug-drug or drug-solute interactions [4-8]. In addition, the binding of solutes in the blood can act to improve the solubility of hydrophobic compounds [9].
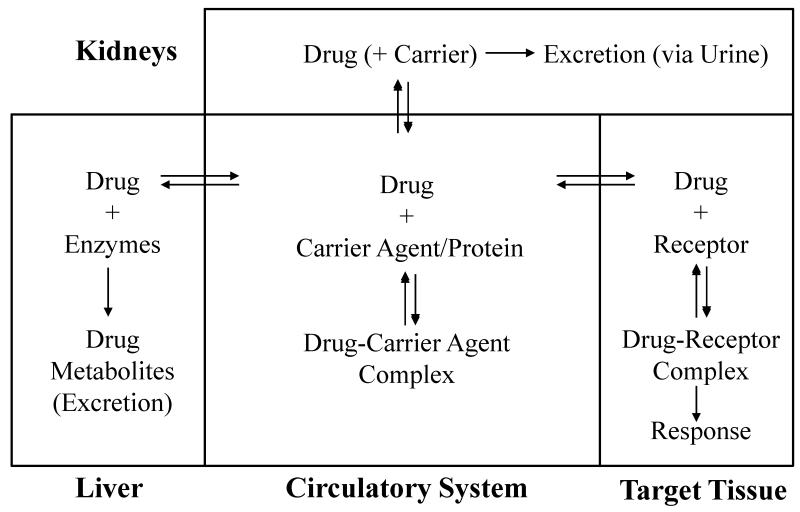
The effects of drug binding in the circulatory system can be illustrated by the general model that is given in Figure 1. As indicated by this model, the binding of drugs with agents in the blood is typically a reversible process. The unbound form of a drug in blood is able to reach its receptor and target tissue, to be metabolized by the liver, or to be excreted by the kidneys from the circulatory system. A drug that is bound in the blood to proteins or other agents is generally not available for these processes or to affect a response [10]. The interactions of serum agents with drugs are often significant, with 43% of the 1500 most frequently prescribed drugs having 90% or greater binding to serum proteins and other agents [11]. The routine occurrence of drug interactions with serum agents makes the assessment of this binding an important part of the adsorption/distribution/metabolism/excretion data that are required for the approval a new pharmaceutical compound [10].
Figure 1.
General model for drug interactions with proteins and other binding agents in blood and the relationship of this binding to the ability of a drug to reach its target or to be acted on by the liver and kidneys.
Lipoproteins such as high-density lipoprotein (HDL) and low-density lipoprotein (LDL) are one group of binding agents that are known to interact with several basic and neutral hydrophobic drugs and other solutes in blood [12-23]. Examples of drugs that bind to these lipoproteins include propranolol and verapamil [2,12-19]. Several methods have been used previously to examine the interactions of these and other drugs with LDL and HDL. These methods have included equilibrium dialysis and capillary electrophoresis (CE) carried out in a frontal analysis mode [20-23]. Equilibrium dialysis is often considered to be the reference method for the evaluation of drug interactions with proteins or other macromolecules and is inexpensive to perform; however, this method requires a large amount of binding agent, is time consuming, and is susceptible to errors due to leakage of the bound drug fraction through the membrane and/or adsorption of the drug onto the membrane [21]. CE/frontal analysis does not require the use of a membrane and overcomes many of the drawbacks associated with equilibrium dialysis, while also providing a relatively quick method that requires only relatively small amounts of samples and binding agents [21]. The primary drawback when using CE to evaluate drug interactions is that this method typically has much higher limits of detection than other methods that are based on bench top spectrometers or HPLC systems [24,25].
An alternative approach that can be used for such studies is high-performance affinity chromatography (HPAC) [3,7-9]. This method makes use of a column for high-performance liquid chromatography that contains an immobilized binding agent (e.g., LDL or HDL) to which a solution or sample of the drug of interest is applied [26-28]. The use of this technique makes it possible to obtain information on the equilibrium constants and stoichiometry of the interactions that are occurring in the column. HPAC has been shown in many past studies to be a valuable tool for studying drug interactions with serum proteins [3,7-9]. As will be discussed in this chapter, some advantages of this approach over equilibrium dialysis include its speed and ease of automation. Some useful features of HPAC over both equilibrium dialysis and CE are its ability to use the same preparation of binding agent for a large number of studies, thus providing good precision by minimizing batch-to-batch and run-to-run variations. Furthermore, it is possible to use HPAC with a variety of HPLC detectors, making it possible to obtain low detection limits and to work with a wide range of solutes [10].
HPAC has been employed in many previous studies that have looked at drug interactions with serum proteins such as human serum albumin (HSA) and α1-acid glycoprotein [10]. However, this method has only recently been extended to work with lipoproteins and binding agents like HDL and LDL [24,25]. This chapter will describe the basic principles of HPAC and will show how this method has been utilized with HDL and LDL to gain information regarding drug-lipoprotein interactions. Some typical results that have been obtained with this approach will also be examined and discussed.
General Principles of High-Performance Affinity Chromatography
HPAC is a form of affinity chromatography that has been developed for use in an HPLC system. Affinity chromatography can be defined as a liquid chromatographic technique that makes use of a biologically related agent as a stationary phase for the purification or analysis of a sample solution [26-28]. The retention of solutes in affinity chromatography is based on the specific, reversible reactions that are commonly found in biological systems. Examples of the types of interactions that are exploited in affinity chromatography include the binding of a substrate by an enzyme or the binding of an antigen by an antibody. In order to utilize these types of interactions in affinity chromatography, one of a pair of interacting molecules is immobilized on a solid support. This immobilized molecule is used as the stationary phase and is known as the affinity ligand [10].
HPAC is a type of affinity chromatography that utilizes HPLC systems and solid supports that consist of small, rigid particles such as silica or glass, azalactone beads, hydroxylated polystyrene media or monolith columns [10,26,27,29-32]. These supports are used because of their good mass transfer properties and their ability to withstand the moderate-to-high flow rates and pressures that can be present in an HPLC system. Although the need for HPLC instrumentation does make HPAC more expensive to perform than traditional affinity chromatography, the improved speed and precision of HPAC make it preferable for analytical applications [10]. These features also make HPAC a useful tool for characterizing the drug interactions that can occur with proteins or other binding agents in blood or serum.
As mentioned previously, HPAC has several potential advantages when compared to other methods for measuring drug interactions with serum binding agents. One advantage of utilizing HPAC is the ability to reuse the same ligand preparation for multiple experiments. This creates a situation in which only a small amount of protein is needed for a large number of studies. This helps to give good precision by minimizing run-to-run variations [33]. This has been noted in the studies that are described in this chapter with lipoproteins, in which columns containing 350 nmol LDL or 30 nmol HDL were each utilized for 160 to 300 experiments [24,25]. Other advantages of HPAC include the ease with which this method can be automated and the relatively short periods of time that are required with this approach for binding studies. For instance, the HPAC studies with lipoproteins that are described in this chapter typically required only 5-10 min per analysis, which is much shorter than the time needed for comparable studies using equilibrium dialysis or ultrafiltration [33]. In addition, the column and immobilized ligand in HPAC are continuously washed with the mobile phase, which minimizes the effects on drug interactions by any small contaminants that may have been present in the original preparation of the binding agent [33]. Finally, the use of HPLC detectors provides good limits of detection and allows for a variety of compounds to be evaluated over a broad range of concentrations [10,24].
The use of HPAC to study solute-ligand interactions is typically accomplished by using one of two methods: zonal elution or frontal analysis. In each of these techniques, the binding agent of interest is used as the immobilized ligand and application of the drug or analyte is made onto the column in the presence of only buffer or buffer containing a modifier/competing agent. Examination of the elution time or volume of the analyte after it has passed through the column allows one to gain information on the type of interaction that is occurring between the analyte and the affinity ligand, as well as the equilibrium constants and number of binding sites that are involved in this process. If additional agents (i.e., competing agents) are present in the mobile phase, data can be obtained on how these agents affect the analyte-ligand interactions. Furthermore, information on the rates of these binding processes can be acquired by examining the elution profile for the analyte. Each of these approaches has been used to examine the binding of drugs to various proteins and transport agents in blood [9,10]. This chapter will emphasize the use of HPAC to study the binding mechanism, strength of binding and stoichiometry for drug interactions with HDL and LDL.
The initial development of an HPAC column for the analysis of solute-ligand interactions requires evaluation of the degree to which binding by the immobilized agent will mimic binding by the same agent in its native form. This evaluation is typically done by determining the binding parameters for a model drug or solute with the immobilized agent when using HPAC and then comparing these results with those obtained for the same system in its native state by equilibrium dialysis, ultrafiltration, or other solution-based reference methods [9,10]. Prior work with columns containing immobilized proteins such as HSA and AGP has consistently shown that HPAC can give excellent agreement with methods using soluble HSA or AGP in drug binding studies [10]. Similar studies that have been carried out with HDL and LDL columns, as described later in this chapter, have led to the same conclusions [24,25].
Preparation of lipoprotein supports for HPAC
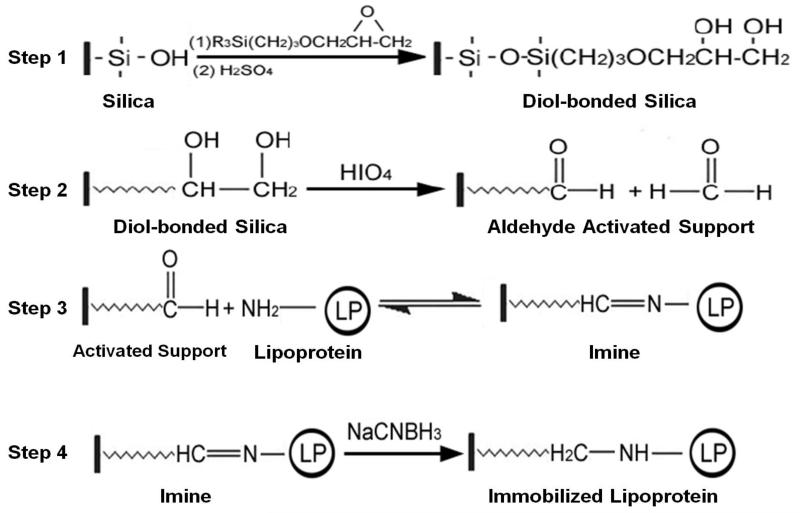
One common support that is used in HPAC is porous silica. This support was utilized in lipoprotein studies due to its mechanical stability, chemical inertness, and long term stability in the presence of a physiological buffer (e.g., the pH 7.4, 0.067 M potassium phosphate buffer that was used as a mobile phase in this work) [24,25]. Prior to the immobilization of a ligand like HDL or LDL to this material, the silica was modified to a diol-bonded form, as shown in Step 1 of Figure 2. This step was used to reduce the presence of charged silanol groups, which could lead to non-specific binding, and to provide sites that could later be modified for covalent bonding [24,25].
Figure 2.
Immobilization of a lipoprotein to silica by using the Schiff base method (i.e., reductive amination).
Covalent immobilization was used to attach the desired lipoprotein to the silica support to provide a stable linkage and robust affinity column [31]. A modified form of the Schiff base method, or reductive animation, was utilized to attach lipoproteins to the diol-bonded silica [24,25]. This process began with the oxidation of the diol-bonded silica with periodic acid to create an aldehyde activated support (see Step 2 in Figure 2) [31]. The aldehydes on the support were then reacted with primary amine groups on the apolipoproteins of HDL or LDL, leading to nucleophilic addition that formed an imine (Step 3). This reaction was carried out at pH 6.0 to make it relatively selective for amines with low pKa values, such as the N-terminal regions of proteins [24,25]. Although the formation of an imine is a reversible process, the imine was reduced with sodium cyanoborohydride to generate a stable secondary amine (Step 4) [34]. Any remaining aldehydes on the support were later reduced to alcohols through the addition of sodium borohydride, which avoided any non-specific binding that may have later occurred by sample components with these types of groups [34].
Once a lipoprotein had been immobilized, the amount that had been attached to the support was measured through various methods. First, the immobilized HDL or LDL was estimated by determining the apolipoprotein level with a bicinchoninic acid (BCA) protein assay and standards that were prepared using soluble HDL or LDL [24,25,35]. In a similar manner, a colorimetric assay was used to compare the cholesterol content of the immobilized HDL and LDL supports with those of HDL or LDL standards [24,25,36]. The BCA assay indicated that the HDL support contained 68 (± 5) mg HDL per gram of silica, while the LDL support contained 28 (± 2) mg LDL per gram of silica. The cholesterol assay indicated that the HDL support contained 3.4 (± 0.4) mg cholesterol per gram of silica and the LDL support contained 7.2 (± 1.1) mg cholesterol per gram of silica [24,25]. As will be shown later, the lipoprotein content that was determined from the protein and cholesterol assays was then used in conjunction with HPAC measurements to aid in the interpretation of the results of the binding studies.
Zonal elution studies of drug interactions with lipoproteins
The most popular method used to examine solute-ligand binding in affinity chromatography is zonal elution. Zonal elution is performed in the same manner as most analytical applications of chromatography, in which a narrow plug of solute is injected onto a column containing an immobilized ligand while the elution time or volume of the solute is monitored [9-10,33]. Several past studies have utilized zonal elution to examine the extent of binding by drugs and other solutes to binding agents that have included HSA and other serum albumins, as well as AGP [10].
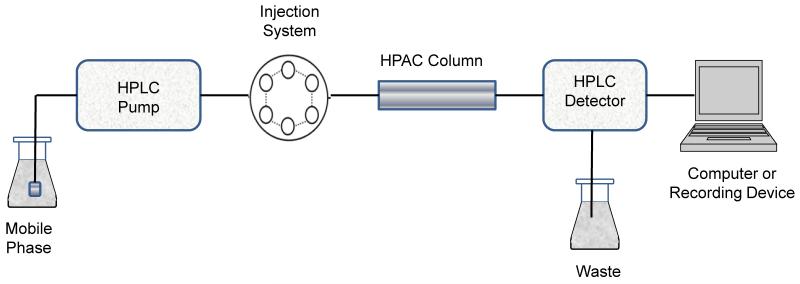
A typical system for performing zonal elution studies is shown in Figure 3. This system is made up of five primary components. The first component is a pump that is capable of delivering a constant flow of mobile phase to the system. A closed injection loop or autoinjector is utilized to inject a narrow plug of the analyte into the mobile phase for delivery to the HPAC column. The column contains the immobilized ligand and is the source of the observed interactions with the injected analyte. An on-line detector is used to monitor the elution profile for the analyte as this solute passes through the column. Finally, a recording device such as a computer is used to obtain the detector’s response as a function of the elution time or applied mobile phase volume, thus providing the final chromatogram that is utilized for analysis.
Figure 3.
Typical experimental system for performing zonal elution studies in HPAC.
Zonal elution has been utilized in prior work with other ligands to measure the degree and affinity of solute-ligand binding, to examine changes in binding with variations in the mobile phase composition (e.g., pH, ionic strength, or polarity) or column temperature, and to see how alterations in solute or ligand structure may affect these interactions [10]. Each of these experiments relies on the fact that the retention observed for an injected analyte is a direct measure of the number of binding sites within a column and the strength with which the analyte is binding to the immobilized ligand. This relationship is described by Eqs. (1)-(2),
| (1) |
| (2) |
which show how the overall retention factor (k) for an analyte on an affinity column is related to the number of binding sites in the column and the association equilibrium constants for the analyte at each of these sites [9,10,33]. In Eq. (1), the association equilibrium constants for the analyte at its individual binding regions on the ligand are given by the terms Ka1 through Kan, while the stoichiometry for the analyte in each type of interaction is described by the terms n1 through nn. The term VM in Eqs. (1)-(2) represents the column void volume, and mL is the total moles of binding sites for the analyte in the column [9-10,33]. The summation of the terms in Eq. (1) is also known as the global affinity or global association equilibrium constant, nKa, as given in Eq. (2) [10]. As can be seen from these equations, a change in either the strength of binding, the number of binding sites, or the relative distribution of these sites can result in a shift of analyte retention on an affinity column. This principle has been used to evaluate the stability of HPAC columns containing immobilized lipoproteins by monitoring the retention of some model drugs on these columns over time [24,25].
R-Propranolol and/or S-propranolol have been used for this type of evaluation process because these drugs are known to bind to both HDL and LDL. A large number of injections for these drugs were made onto new HPAC columns that contained immobilized HDL or LDL while the retention of these analytes was monitored over time [24,25]. These studies sought to determine when a change in retention of R- or S-propranolol might occur, thus indicating that a change had also occurred in the stability of the lipoprotein column. The goal was to determine if consistent retention of a given drug could be obtained over reasonable times of column use. Once such conditions had been identified, the same conditions were then used in more extensive experiments to provide stable HPAC columns for measuring the equilibrium constants and binding stoichiometry between an applied drug and the immobilized lipoprotein.
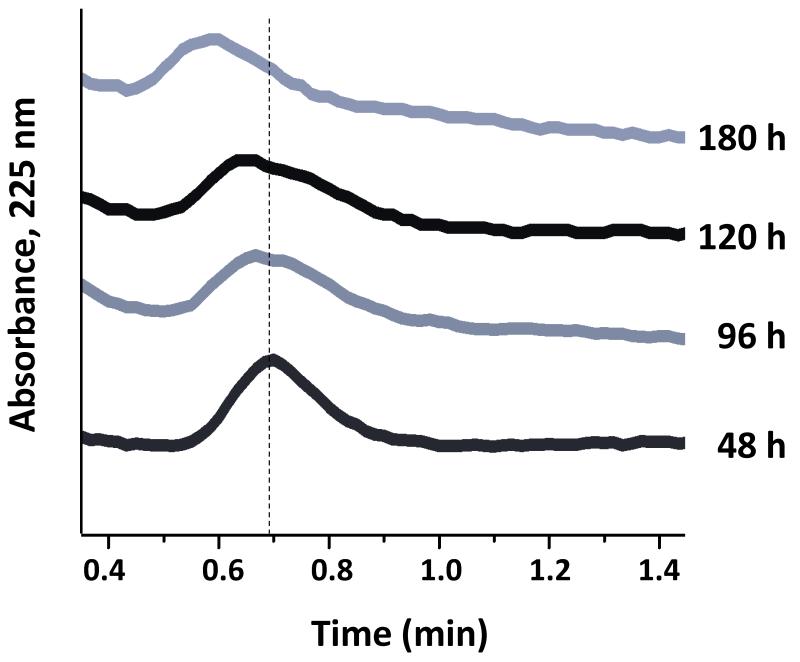
Some typical chromatograms that were obtained during the evaluation of the lipoprotein column stability can be seen in Figure 4. All of these studies were carried out at 37 °C and at 1.0 mL/min in the presence of pH 7.4, 0.067 M phosphate buffer as the mobile phase (i.e., the same conditions to be later used in the more detailed binding studies). The results of the zonal elution experiments have demonstrated that columns containing either immobilized HDL or LDL were sufficiently stable for drug binding studies by HPAC [24,25]. For instance, columns containing HDL immobilized to silica were found to give no significant changes in retention for the model drugs over at least 3.6 104 column volumes, or up to 120 hours of continuous operation at 1.0 mL/min. The LDL columns were stable over at least 1.6 104 column volumes and at least 60 hours of operation at 1.0 mL/min. The period of use was more than sufficient for the types of drug binding studies that were planned in the next phase of experiments for such HPAC columns [24,25].
Figure 4.
Chromatograms showing the change in R-propranolol retention as a function of the applied volume of mobile phase (pH 7.4, 0.067 M phosphate buffer) when using a 100 mm 2.1 mm i.d. HPAC column that contained immobilized HDL. This column was operated at 1 mL/min and 37 °C. The dashed vertical line is provided for reference and shows the peak maximum for R-propranolol near the beginning of this experiment. Other details can be found in Ref. [24].
Frontal analysis studies of drug interactions with lipoproteins
Frontal analysis is another method used in binding studies that are conducted with HPAC. In this technique, a solution containing a known concentration of an analyte is continuously applied at a fixed flow rate to a column containing an immobilized ligand. This situation is analogous to a titration of the ligand binding sites that are available within the column [9,10,33]. The use of frontal analysis to quantitatively determine the affinity of binding and amount of ligand in a column has been utilized in the past with a number of solutes and serum proteins such as HSA and α1-acid glycoprotein [10]. It will be shown in this section and the following sections how frontal analysis can also be used with HDL and LDL columns to study and determine the types of interactions these ligands have with an applied drug [24,25].
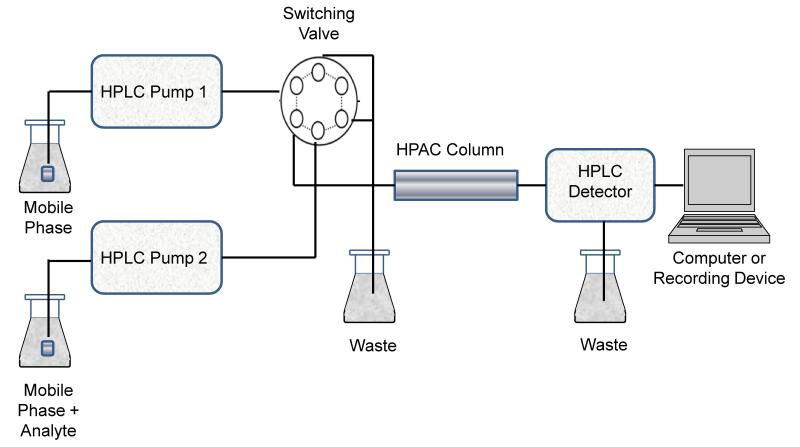
A typical chromatographic system for performing frontal analysis is shown in Figure 5. This system is similar to that used for zonal elution, with one major exception. A typical frontal analysis system utilizes at least two pumps that are capable of delivering various mobile phase solutions to the system. One of these pumps delivers the application buffer, while the second pump delivers the application buffer plus a known concentration of the desired analyte. The application buffer is generally a solution that mimics the pH and surroundings of the ligand in its natural environment; as an example, work with serum binding agents is often carried out by using pH 7.4, 0.067 M phosphate buffer as the application solution. A high pressure valve is utilized to control which mobile phase solution is applied to the HPAC column during the frontal analysis experiments. If needed, a third pump can be used to a pass an elution buffer through the column to release any analyte that has been retained. Alternatively, a single gradient pump and high-pressure mixing can be used in place of separate pumps to apply various solutions to the column. An on-line detector is again used to monitor the elution profile for the analyte, and a computer or recording device is used to collect this data for analysis.
Figure 5.
Typical experimental system for performing frontal analysis studies in HPAC.
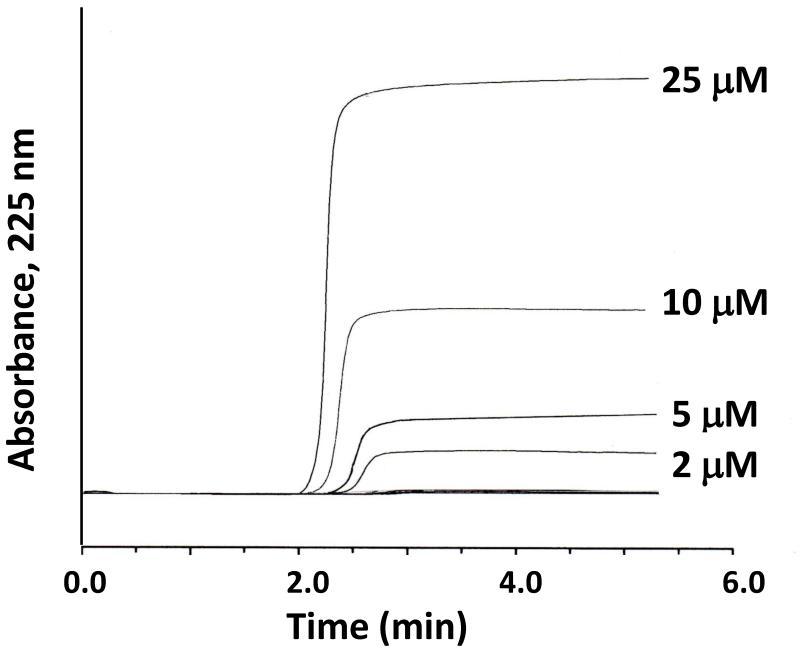
Frontal analysis is often utilized to measure the binding capacity and equilibrium constants of an affinity column for an applied analyte. As the analyte is applied to the column, fixed binding sites on the ligand will begin to become saturated and the amount of analyte that elutes from the column will increase. The result of this process is the formation of a breakthrough curve, as illustrated in Figure 6. The volume of the analyte solution or the moles of applied analyte that are required to reach the mean position of this breakthrough curve is then determined. This process is repeated at several concentrations for the applied analyte in the presence of a known mobile phase composition and temperature. If it is known or assumed that association and dissociation kinetics of the analyte-ligand interaction are fast on the time scale of the experiment, the mean position of the breakthrough curve can be related to the concentration of the applied solute, the amount of ligand in the column, and the equilibrium constants for the analyte-ligand interaction [8,9]. This information is obtained by fitting the results of the frontal analysis experiment to expressions that represent one or more binding models. Examples of such models are provided in Table 1 and Eqs. (3)-(6); these models will be discussed in more detail in the next section. Figure 7 shows some fits for these models to representative frontal analysis data for an immobilized lipoprotein column.
Figure 6.
Typical chromatograms obtained on an HDL column during frontal analysis experiments with R-propranolol being applied as the analyte. These results were obtained using a 50 mm 2.1 mm i.d. HDL column at 37°C in the presence of pH 7.4, 0.067 M phosphate buffer. This figure is based on data from Ref. [24].
Table 1.
Binding models used to fit frontal analysis data for drugs such as R-propranolol and S-propranolol on lipoprotein columns
| Binding model | Predicted response a | ||
|---|---|---|---|
| Non-saturable interaction |
|
||
| Single group of saturable sites |
|
||
| Saturable sites + non-saturableM interaction |
|
||
| Two groups of saturable sites |
|
Symbols: [D], drug or analyte concentration in the applied mobile phase; mLapp, moles of applied drug or analyte that are required to reach the central position of the breakthrough curve; mL1 and mL2, moles of binding sites for the drug or analyte with one or two types of interactions with the column; Ka1 and Ka2, association equilibrium constants for a drug or analyte with one or two types of interactions with the column. The values of mL1 and mL2 can be converted into the moles of analyte or drug per binding agent (n) by dividing these values by the total moles of binding agent in the column.
Figure 7.
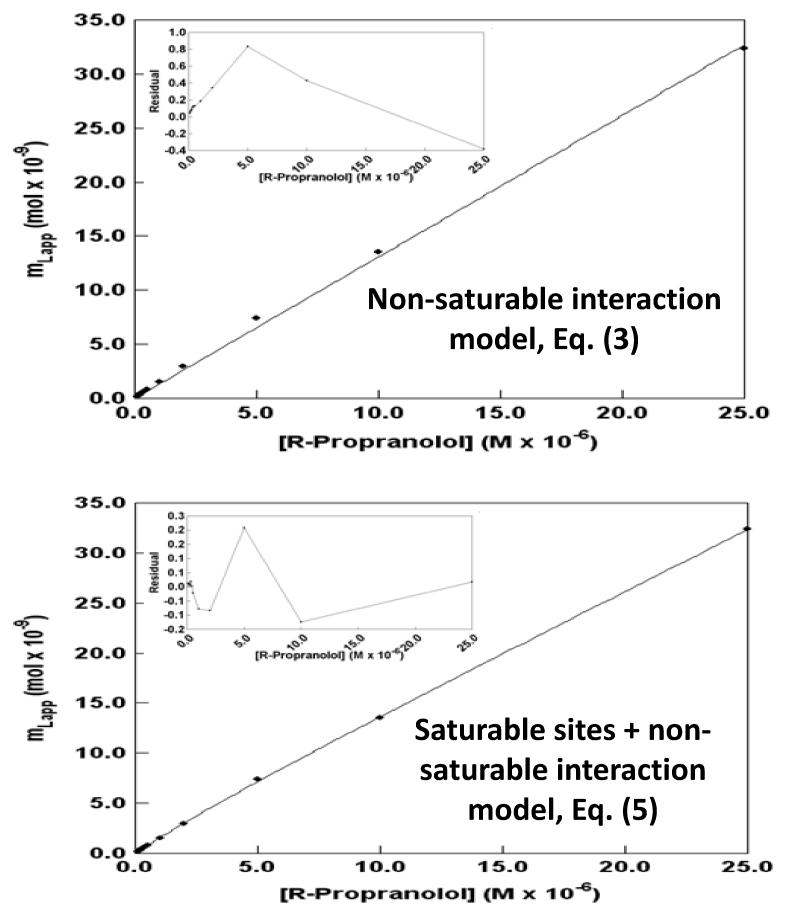
Examination of frontal analysis data obtained for R-propranolol on an HDL column at 37 °C according to a non-saturable interaction model (top) and a model based on non-saturable interactions plus a group of saturable sites (bottom). The insets show the residual plots for the fit of each model to the experimental data. These results were obtained in the presence of pH 7.4, 0.067 M phosphate buffer. The correlation coefficients (n = 9) were 0.9959 and 0.9998, respectively. This figure is based on data from Ref. [24].
Frontal analysis can provide various types of information regarding a solute-ligand interaction. This information includes the affinity and number of binding sites for a solute on an affinity ligand, as well as the nature of this binding (e.g., single site versus multiple site binding, and saturable versus non-saturable interactions) [9,10]. It is also possible to employ this method to study the effects of temperature, solvent composition, or pH on this binding, along with the changes that may occur for these interactions in the presence of a competing agent [9,10]. The use of frontal analysis and HPAC is advantageous when compared to solution-based methods for binding studies like equilibrium dialysis because of the speed and relatively large amount of information that can be obtained in a frontal analysis experiment [9,10,33]. A key advantage of frontal analysis over zonal elution is that it can simultaneously provide information on both the number of binding sites and equilibrium constants for a solute with an immobilized binding agent. These features have made frontal analysis attractive in prior reports for detailed studies of drug-protein binding and for the high-throughput screening of drug-protein interactions [9,10,33].
To properly conduct a frontal analysis experiment, one must consider and optimize a number of factors. These factors include the choice of affinity column, the selection of analyte concentrations, and the approach for determination of breakthrough times [9,10]. The affinity column should be prepared in a way that provides a relatively stable ligand that mimics the same ligand in its native environment. Possible non-specific binding by the analyte to the support or column components other than the ligand need to be considered as well; this type of binding can be minimized through the choice of appropriate immobilization conditions and can be corrected for by carrying out frontal analysis studies on a control column with no immobilized ligand present [9-10]. The analyte concentrations to be employed for frontal analysis should be selected by considering the expected equilibrium constants for the interaction, along with the detectability and solubility of the analyte [8-10]. The determination of breakthrough times can be carried out in one of several ways. For a symmetrical breakthrough curve, the point that is halfway between the baseline and the plateau can be used as the breakthrough time. The breakthrough time for an asymmetrical curve, which is the type typically seen for lipoprotein columns, can be determined by finding the centroid of the first derivative for the curve. Alternatively, this centroid can be found by determining the point at which the area below the front portion of the curve is equal to the area above the latter portion of the curve [10].
Potential models for drug-lipoprotein interactions
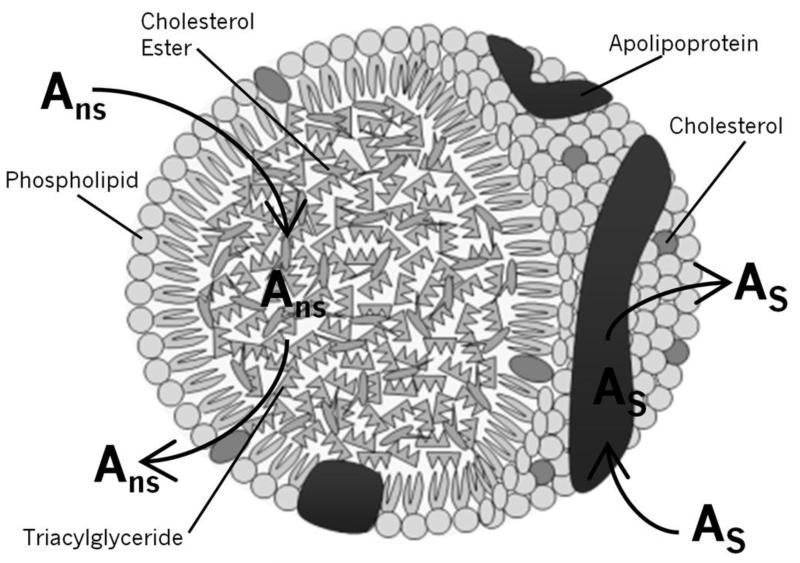
The structure of lipoproteins lends itself to a number of possible interactions with drugs. For instance, it is possible that the drug may interact with the hydrophobic core or with phospholipids on the surface of the lipoprotein, as has been suggested in prior studies [21-23]. However, it is also possible that the drug may undergo more specific binding with the apolipoproteins in the lipoprotein particle or that a combination of several types of interactions is present [24,25]. An illustration of the general structure of a lipoprotein and these possible binding mechanisms can be seen in Figure 8. Each of these possibilities was considered when an analysis was carried out with frontal analysis data that were obtained for various drugs with HPAC columns containing immobilized lipoproteins [24,25].
Figure 8.
General structure of a lipoprotein and examples of possible interaction mechanisms with this binding agent. In this figure, Ans represents a drug that is interacting with the lipoprotein core in a non-saturable, partition-like manner. As represents a drug that is interacting with the lipoprotein at a saturable site, such as might occur on an apolipoprotein.
The simplest interaction model that was considered during these drug-lipoprotein binding studies was one in which the analyte only interacted with the hydrophobic core of the lipoprotein or with a large group of non-saturable sites [20,21,24,25]. This type of interaction would be expected to follow the non-saturable or partition type model that is represented in Table 1 by Eq. (3). The next simplest model that was evaluated was one in which the analyte may interact with a single group of saturable sites, as might occur on the apolipoproteins at the surface of a lipoprotein [24,25]. This type of interaction is represented by Eq. (4) in Table 1. A mixed-mode model was also considered in which a combination of saturable sites and a group of non-saturable interactions were present. This model is described by Eq. (5) in Table 1. The final model that was examined was one in which multiple but distinct site-specific interactions were present. This model is described by Eq. (6) in Table 1 [24,25].
These binding models were each evaluated in the following manner. First, a graph was made of the frontal analysis results that were obtained at a given temperature, in which a plot was made of the apparent moles of analyte (mLapp) that were required to reach the mean position of the breakthrough curve versus the concentration of applied drug ([D]) that was used to generate this result. The plot was then fit to each of the equations that are shown in Table 1 to determine which model gave the best description of the results. Examples of these plots are shown in Figure 7. The quality of each fit was examined and compared by using the correlation coefficients for the fits, the overall residual values, and the distribution of the data about the best-fit line for each model (e.g., as given by the residual plots for each set of data). The results of this approach are provided in the next two sections for data that were obtained for R- and S-propranolol on HPAC columns that contained HDL or LDL.
Analysis of interactions between propranolol and HDL
The interactions between HDL and R- and S-propranolol have been examined in the past by equilibrium dialysis and CE/frontal analysis [20,21]. Each of these studies has described the binding of propranolol to HDL by using a partition-based model. The overall affinity (nKa) measured for this interaction between HDL and propranolol has been in the range of 1.60 104 M−1 to 2.43 104 M−1 at pH 7.4 and 25 or 37 °C [20,21]. This prior work has also failed to observe any stereoselective interactions between HDL and the R- or S-enantiomers of propranolol [21]. More recent studies have examined this system in more detail by utilizing HPAC and HDL that has been immobilized to silica [24].
Frontal analysis experiments were conducted to analyze the interactions between HDL and R- or S-propranolol. The use of this technique and the binding models listed in Table 1 led to the conclusion that two distinct types of interactions were present for each of the propranolol enantiomers. The first type of interaction had a moderately high affinity and was due to a group of saturable sites. This group of sites had a Ka value of 1.1-1.9 × 10⁵ M−1 for R- and S-propranolol at 37°C. The second type of interaction had a lower affinity and followed a non-saturable interaction model. The overall affinity of this interaction was 3.7-4.1 104 M−1 for both propranolol enantiomers at 37°C, which agreed with values which had been previously reported for the partition-like interactions of propranolol with HDL [20,21]. In addition, it was confirmed through the HPAC studies that these interactions were non-stereoselective in nature at the temperatures that were used in the experiments [24].
The nature of the saturable sites was further examined by comparing the number of measured sites for this interaction with the known HDL content of the column. It was found that the number of these sites was consistently less than the total moles of HDL in the column. It was concluded from this information, and relatively strong binding of propranolol at these sites, that apolipoproteins were responsible for this particular interaction [24]. The lower number obtained for these groups versus the total amount of immobilized HDL may have been due to immobilization effects or the fact that only certain types of apolipoproteins were involved in this interaction. The types of apolipoproteins and typical levels of these proteins that are found in HDL are roughly 70% for ApoA1, 20% for ApoA2, and 10% for minor apolipoproteins such as ApoE and ApoC [12].
Analysis of interactions between propranolol and LDL
The interactions between LDL and R- and S-propranolol have also been examined in the past by using equilibrium dialysis and CE/frontal analysis [20,21]. It has again been assumed in each of these prior studies that the binding of propranolol by LDL is the result of partition-like interactions. The overall affinity of this interaction has been estimated to be in the range of 1.7 105 M−1 to 4.0 105 M−1 at pH 7.4 and 25 or 37 °C [20,21]. These studies have further noted the absence of any stereoselective interactions between R- or S-propranolol with LDL [21]. HPAC was also used in more recent studies to investigate these interactions further by using columns that contained LDL immobilized to silica [25].
Frontal analysis was employed to analyze the interactions between LDL and R/S-propranolol. It was found through the use of this technique and the binding models in Table 1 that mixed-mode, stereoselective interactions were present between the enantiomers of propranolol and LDL. R-Propranolol was found to have both saturable and non-saturable interactions with LDL. The saturable interaction had an association equilibrium constant of 5.2 105 M−1 at 37 °C. This binding was determined to occur between R-propranolol and the apolipoprotein apoB100 of LDL, as supported by a comparison of the measured binding capacity of the LDL column, the moles of LDL that were present, and the moles of apoB100 that are typically present in an LDL particle [25].
The second interaction seen for R-propranolol with LDL had an overall affinity of 1.9 105 M−1 at 37 °C and represented non-saturable binding. This type of binding was determined to be most likely the result of interactions between R-propranolol and phospholipids or the non-polar core of LDL. This same type of interaction was also noted between LDL and S- propranolol. The overall affinity of these non-saturable interactions was 2.7 105 M−1 at 37 °C for both enantiomers. This affinity was in agreement with the values that have been reported for the same drug with LDL when using a partition-based model and CE/frontal analysis or equilibrium dialysis [25].
The overall affinities measured for R- and S-propranolol for their non-saturable binding with LDL were approximately 5- to 9-fold higher than the values of 3.7-4.1 104 M−1 at 37 °C that had been measured by the same approach for the non-saturable interactions of these enantiomers with HDL [24]. This result was expected based on the results of previous studies that have compared drug binding by LDL versus HDL [20-23], and the fact that LDL has a much larger portion of hydrophobic components (i.e., cholesterol and triacylglycerides) than HDL [12-14,21]. Although LDL and HDL also contain different types of apolipoproteins, the affinity constants measured for the saturable binding of R-propranolol with LDL were similar to values of 1.4-1.9 105 M−1 that have been estimated for saturable binding by the same solute with HDL [24,25].
The fact that R- and S-propranolol followed different binding models with LDL indicated that their overall interactions were stereoselective in nature. This stereoselectivity was demonstrated by the fact that only the R-enantiomer of propranolol had significant saturable binding to LDL under the conditions of this study (e.g., at apoB100). In earlier studies with HDL, no chiral selectivity was observed for R/S-propranolol binding. Prior work examining the binding of propranolol with LDL either used a racemic preparation of this drug or found no significant differences in the binding of R- and S-propranolol to LDL when using only a non-saturable binding model [20-23]. This latter result was not surprising given the similarity in the binding constants that were seen with HPAC for the saturable and/or non-saturable interactions of R- and S-propranolol with LDL [25].
The fact that stereoselective interactions were seen for R- and S-propranolol with LDL but not with HDL, which also followed a mixed-mode binding model, can be explained by the fact that different types of apolipoproteins are present in HDL and LDL. For instance, HDL contains up to 5-6 apolipoproteins per particle, with these apolipoproteins consisting of ApoA1, ApoA2, ApoE and ApoC. LDL has only one apolipoprotein molecule per particle (i.e., ApoB100) [12]. The ability of ApoB100 to specifically bind to hormones and drug-like compounds has been previously noted for a number of steroids, including 17-β-estradiol, testosterone, and progesterone [37-39]. However, stereoselective interactions with apoB100, apolipoproteins, or lipoprotein particles have not been observed when using techniques other than HPAC [25].
Conclusion
As has been shown in this chapter, HPAC can be used as a tool for characterizing mixed-mode interactions between drugs and lipoproteins. This method of analysis has been found to have several advantages over other techniques, including its speed, reproducibility and ability to use the same lipoprotein preparation for a large number of studies. The immobilized lipoprotein columns described in this chapter have been found to be sufficiently stable for use in hundreds of experiments. This feature provides HPAC with a significant reduction in the amount of lipoprotein per experiment that is needed for binding studies when compared with CE/frontal analysis and equilibrium dialysis [20,21,24,25]. The use of the same lipoprotein column for multiple studies further makes it possible to minimize run-to-run variations, while providing analysis times of only a few minutes per run. The ability to use these columns with standard HPLC detectors also makes it possible to provide good limits of detection during binding studies. The combined result of these advantages is the ability to quickly obtain precise data over a variety of drug concentrations, making it possible to study the mixed-mode interactions that occur between HDL or LDL and R- or S-propranolol. These same features should make similar HPAC columns and methods valuable in future studies examining the binding of other drugs and solutes with HDL, LDL and additional lipoproteins.
Acknowledgements
This work was supported by the National Institutes of Health under grant R01 GM 044931 and was performed in facilities renovated with support under grant RR015468-01.
References
- 1.Otagiri M. A molecular functional study on the interactions of drugs with plasma proteins. Drug Metab. Pharmacokinet. 2005;20:309–323. doi: 10.2133/dmpk.20.309. [DOI] [PubMed] [Google Scholar]
- 2.Bertucci C, Domenici E. Reversible and covalent binding of drugs to human serum albumin: methodological approaches and physiological relevance. Curr. Med. Chem. 2002;9:1463. doi: 10.2174/0929867023369673. [DOI] [PubMed] [Google Scholar]
- 3.Hage DS. High-performance affinity chromatography: a powerful tool for studying serum protein binding. J. Chromatogr. B. 2002;768:3–30. doi: 10.1016/s0378-4347(01)00482-0. [DOI] [PubMed] [Google Scholar]
- 4.Lindup WE. In: Progress in Drug Metabolism. Bridges JW, Chasseaud LF, Gibson GG, editors. Vol. 10. Tylor & Francis; New York: 1987. Ch. 4. [Google Scholar]
- 5.Kwong TC. Free drug measurements: methodology and clinical significance. Clin. Chim. Acta. 1985;151:193–216. doi: 10.1016/0009-8981(85)90082-8. [DOI] [PubMed] [Google Scholar]
- 6.Svensson CK, Woodruff MN, Baxter JG, Lalka D. Free drug concentration monitoring in clinical practice. Rationale and current status. Clin. Pharmacokinet. 1986;11:450–469. doi: 10.2165/00003088-198611060-00003. [DOI] [PubMed] [Google Scholar]
- 7.Wainer IW. The impact of new liquid chromatography chiral stationary phase technology on the study of stereoselective pharmacokinetics. Trends Anal. Chem. 1993;12:153–158. [Google Scholar]
- 8.Hage DS, Tweed SA. Recent advances in chromatographic and electrophoretic methods for the study of drug-protein interactions. J. Chromatogr. B. 1997;699:499–525. doi: 10.1016/s0378-4347(97)00178-3. [DOI] [PubMed] [Google Scholar]
- 9.Hage DS, Chen J. In: Handbook of Affinity Chromatography. 2nd edn. Hage DS, editor. Taylor & Francis; New York: 2006. com. [Google Scholar]
- 10.Hage DS, Jackson A, Sobansky M, Schiel JE, Yoo MJ, Joseph KS. Characterization of drug-protein interactions in blood using high-performance affinity chromatography. J. Sep. Sci. 2009;32:835–853. doi: 10.1002/jssc.200800640. [DOI] [PMC free article] [PubMed] [Google Scholar]
- 11.Kratochwil NA, Huber W, Muller F, Kansy M, Gerber PR. Predicting plasma protein binding of drugs: a new approach. Biochem. Pharmacol. 2002;64:1355–1374. doi: 10.1016/s0006-2952(02)01074-2. [DOI] [PubMed] [Google Scholar]
- 12.Jonas A. In: Biochemistry of Lipids, Lipoproteins, and Membranes. 4th edn. Vance DE, Vance JE, editors. Elsevier; Amsterdam: 2002. Ch. 17. [Google Scholar]
- 13.Barklay M. In: Blood Lipids and Lipoproteins: Quantitation, Composition, and Metabolism. Nelson GJ, editor. John Wiley; New York: 1972. Ch. 12. [Google Scholar]
- 14.Wasan KM, Cassidy SM. Role of plasma lipoproteins in modifying the biological activity of hydrophobic drugs. J. Pharm. Sci. 1998;87:411–424. doi: 10.1021/js970407a. [DOI] [PubMed] [Google Scholar]
- 15.Harmony JAK, Aleson AL, McCarthy BM. In: Biochemistry and Biology of Plasma Lipoproteins. Scanu AM, Spector AA, editors. Marcel Dekker; New York: 1986. Ch. 15. [Google Scholar]
- 16.Mbewu AD, Durrington PN. Lipoprotein(a): structure, properties and possible involvement in the thrombogenesis and atherogenesis. Atherosclerosis. 1990;85:1–14. doi: 10.1016/0021-9150(90)90177-k. [DOI] [PubMed] [Google Scholar]
- 17.Durrington PN, editor. Lipoproteins and Lipids. Wright; London: 1989. [Google Scholar]
- 18.Havel RJ, Kane JP. In: The Metabolic and Molecular Basis of Inherited Disease. Scriver CR, Beaudet AL, Sly WS, Valle D, Childs B, Kinzler KW, Vogelstein B, editors. McGraw-Hill; New York: 1995. Ch. 114. [Google Scholar]
- 19.Skipski VR. In: Blood Lipids and Lipoproteins: Quantitation, Composition, and Metabolism. Nelson GJ, editor. John Wiley; New York: 1972. Ch. 11. [Google Scholar]
- 20.Glasson S. The distribution of bound propranolol between the different human serum proteins. Mol. Pharmacol. 1980;17:187–191. [PubMed] [Google Scholar]
- 21.Ohnishi T, Mohamed NAL, Shibukawa A, Kuroda Y, Nakagawa T, El Gizawy S, Askal HF, El Kommos ME. Frontal analysis of drug-plasma lipoprotein binding using capillary electrophoresis. J. Pharm. Biomed. Anal. 2002;27:607–614. doi: 10.1016/s0731-7085(01)00569-6. [DOI] [PubMed] [Google Scholar]
- 22.Mohamed NAL, Kuroda Y, Shibukawa A, Nakagawa T, S El Gizawy, Askal HF, El Kommos ME. Enantioselective binding analysis of verapamil to plasma lipoproteins by capillary electrophoresis-frontal analysis. J. Chromatogr. A. 2000;875:447–453. doi: 10.1016/s0021-9673(99)01288-1. [DOI] [PubMed] [Google Scholar]
- 23.Mohamed NAL, Kuroda Y, Shibukawa A, Nakagawa T, El Gizawy S, Askal HF, El Kommos ME. Binding analysis of nilvadipine to plasma lipoproteins by capillary electrophoresis-frontal analysis. J. Pharm. Biomed. Anal. 1999;21:1037–1043. doi: 10.1016/s0731-7085(99)00197-1. [DOI] [PubMed] [Google Scholar]
- 24.Chen S, Sobansky MR, Hage DS. Analysis of drug interactions with high-density lipoprotein by high-performance affinity chromatography. Anal. Biochem. 2010;397:107–114. doi: 10.1016/j.ab.2009.10.017. [DOI] [PMC free article] [PubMed] [Google Scholar]
- 25.Sobansky MR, Hage DS. Identification and analysis of stereoselective drug interactions with low-density lipoprotein by high-performance affinity chromatography. Anal. Bioanal. Chem. doi: 10.1007/s00216-012-5816-y. submitted. [DOI] [PMC free article] [PubMed] [Google Scholar]
- 26.Walters RR. Affinity chromatography. Anal. Chem. 1985;57:1099A–1101A. doi: 10.1021/ac00288a001. [DOI] [PubMed] [Google Scholar]
- 27.Hage DS. Handbook of Affinity Chromatography. 2nd edn. Taylor & Francis; New York: 2006. [Google Scholar]
- 28.Ettre LS. Nomenclature for Chromatography. Pure Appl. Chem. 1993;65:819–872. [Google Scholar]
- 29.Gustavsson PE, Larsson PO. In: Handbook of Affinity Chromatography. 2nd edn. Hage DS, editor. Taylor & Francis; New York: 2006. Ch. 2. [Google Scholar]
- 30.Mallik R, Hage DS. Affinity monolith chromatography. J. Sep. Sci. 2006;29:1686–1704. doi: 10.1002/jssc.200600152. [DOI] [PubMed] [Google Scholar]
- 31.Mallik R, Jiang T, Hage DS. High-performance affinity monolith chromatography: development and evaluation of human serum albumin columns. Anal. Chem. 2004;76:7013–7022. doi: 10.1021/ac049001q. [DOI] [PubMed] [Google Scholar]
- 32.Mallik R, Hage DS. Development of an affinity silica monolith containing human serum albumin for chiral separations. J. Pharm. Biomed. Anal. 2008;46:820–830. doi: 10.1016/j.jpba.2007.03.017. [DOI] [PMC free article] [PubMed] [Google Scholar]
- 33.Hage DS, Anguizola J, Barnaby O, Jackson A, Yoo MJ, Papastavros E, Pfaunmiller E, Sobansky M, Tong Z. Characterization of drug interactions with serum proteins by using high-performance affinity chromatography. Curr. Drug Metab. 2011;12:313–328. doi: 10.2174/138920011795202938. [DOI] [PMC free article] [PubMed] [Google Scholar]
- 34.Kim HS, Hage DS. In: Handbook of Affinity Chromatography. 2nd edn. Hage DS, editor. Taylor & Francis; New York: 2006. Ch. 3. [Google Scholar]
- 35.Smith PK, Krohn RI, Hermanson GT, Mallia AK, Gartner FH, Provenzano MD, Fujimoto EK, Goeke NM, Olson BJ, Klenk DC. Measurement of protein using bicinchoninic acid. Anal. Biochem. 1985;150:76–85. doi: 10.1016/0003-2697(85)90442-7. [DOI] [PubMed] [Google Scholar]
- 36.Allain CC, Poon LS, Chan CSG, Richmond W, Fu PC. Enzymatic determination of total serum cholesterol. Clin. Chem. 1974;20:470–475. [PubMed] [Google Scholar]
- 37.Brunelli R, Greco G, Barteri M, Krasnowska EK, Mei G, Natella F, Pala A, Rotella S, Ursini F, Zichella L, Parasassi T. One site on the apoB-100 specifically binds 17-β-estradiol and regulates the overall structure of LDL. FASEB J. 2003;17:2127–2129. doi: 10.1096/fj.02-1181fje. [DOI] [PubMed] [Google Scholar]
- 38.Wang AJ, Vainikka K, Witos J, D’Ulivo L, Cilpa G, Kovanen PT, Oorni K, Jauhiainen M, Riekkola ML. Partial filling affinity capillary electrophoresis with cationic poly(vinylpyrrolidone)-based copolymer coatings for studies on human lipoprotein-steroid interactions. Anal. Biochem. 2010;399:93–101. doi: 10.1016/j.ab.2009.11.028. [DOI] [PubMed] [Google Scholar]
- 39.D’Ulivo L, Chen J, Meinander K, Oorni K, Kovanen PT, Riekkola ML ML. In situ delipidation of low-density lipoproteins in capillary electrochromatography yields apolipoprotein B-100 coated surfaces for interaction studies. Anal. Biochem. 2008;383:38–43. doi: 10.1016/j.ab.2008.08.013. [DOI] [PubMed] [Google Scholar]


