

Significance
The behavior of the flagellar rotary motor was monitored by following the rotation of small gold particles attached to flagellar hooks, nanometer-sized components found at the ends of motor drive shafts, providing an accurate readout of motor function. Some measurements were made in the past with large markers on flagellar filaments that suggested the presence of hidden steps preceding switching events. These steps were probably filament polymorphic transformations. Our data argue for a simple two-state system with transitions between clockwise and counterclockwise states that occur at random times.
Keywords: motility, molecular motor, switch, nanogold
Abstract
Switching dynamics of flagellar motors of Escherichia coli is commonly observed through markers attached to the flagellar filaments. To eliminate possible complications resulting from the conformational transitions of these filaments and to look at the output of motors more directly, we monitored motor rotation by attaching nanogold spheres to the hooks of cells lacking filaments. We observed exponentially distributed counterclockwise (CCW) and clockwise (CW) intervals and Lorentzian power spectra of the switching time series consistent with models that treat motor switching as a two-state Poisson process.
Peritrichously flagellated bacteria such as Escherichia coli perform chemotaxis by a biased random walk comprising runs and tumbles, determined by the direction of rotation of the flagellar motors. When all of the motors on a cell rotate counterclockwise (CCW), the flagellar filaments form a helical bundle and the cell swims smoothly (runs); when one or more motors switch to clockwise (CW) rotation, the bundle is disrupted and the cell changes direction (tumbles) (1). The response regulator of the chemotaxis-signaling pathway, CheY-P, interacts with the motor switch protein FliM, increasing the probability that the motor spins CW (2–4). Switching dynamics of the motor has been observed by tethering single filaments to a glass slide and observing rotation of the cell body (5) or by attaching micrometer-sized beads to short (6, 7) or long (8, 9) filament stubs and watching the beads wobble. A recent model noted that conformational transitions of filaments can contribute to the observed dynamics (10). To remove this complication and observe the motor dynamics directly, we used the nanogold method developed to study motor behavior near zero load, in which 60- to 200-nm-diameter gold spheres are attached to the hooks of cells lacking flagellar filaments (11–13).
Results
We constructed strain JY33 (cheB cheZ fliC, with the wild-type promoter of cheY on the chromosome replaced with a Ptrc promoter), which is a derivative of E. coli K12 strain RP437 (14), for this experiment. The plasmid pACYC184-Iq (15), which constitutively expresses LacIq, was transformed into JY33 to offer tighter control of the expression of CheY. JY33 carrying pACYC184l-Iq was used in this study. In this strain, all cytoplasmic CheY is thought to be phosphorylated (16), and CheY expression is adjusted by using various amounts of the inducer isopropyl-β-D-thiogalactoside (IPTG).
Gold spheres 150 nm in diameter (15712, Ted Pella Inc.) were attached to the hooks of JY33 cells with antihook antibody (11). Rotations of the gold spheres were monitored with the laser darkfield setup described previously (12). The rotations of 67 motors on different cells with various CCW biases were recorded, with each motor observed for about 5 min. Data analysis was done using custom scripts in MATLAB (Mathworks). The velocity time series were converted to binary time series (with CCW rotation denoted as 1 and CW rotation as −1), using the threshold-crossing algorithm described previously (12). We analyzed the switching time series for motors at different induction levels of CheY-P (thus with different CCW biases). The switching time series were sorted by CCW bias into five groups: 0.1 ± 0.1, 0.3 ± 0.1, 0.5 ± 0.1, 0.7 ± 0.1, and 0.9 ± 0.1.
We analyzed the switching time series to obtain the distributions of CCW and CW intervals. The intervals for motors falling in the same ranges of CCW bias, computed by averaging over the entire 5-min time series, were grouped together and plotted. The CCW interval distributions are shown in Fig. 1 (Top), as are the corresponding CW interval distributions Fig. 1 (Bottom). All distributions exhibited a near-exponential form, with no peak at short time intervals. This is in contrast to the gamma distribution with a peak below 1 s observed previously by Korobkova and coworkers (9). We hypothesized that the curvature in the semilog plots of Fig. 1 might be a result of cell-to-cell variation of the mean intervals for the 5-min time span, as noted previously (17). So we tried to normalize each 5-min time series so that its mean interval was equal to the ensemble mean of its CCW bias group. However, the resultant plot did not change much, probably because the main effect of cell-to-cell variation of the mean intervals had been taken care of by the bias grouping procedure. The curvature appears to be, instead, a result of the temporal variation of mean intervals during the 5-min time span. To examine this, we took a 30-min-long measurement of a single motor (CCW bias 0.27) and performed a simulation with a Poisson two-state process with the same bias and mean CCW and CW intervals. The mean CCW biases calculated in a 30-s running window as a function of time for both experiment and simulation are shown in Fig. 2. The experimental result shows much larger bias fluctuation (and hence fluctuation of mean intervals) than the Poisson simulation. Fluctuation of CheY-P concentration would induce such bias fluctuation (8, 18), but almost all CheY is thought to be phosphorylated in our strain (16).
Fig. 1.

CCW (Top) and CW (Bottom) interval distributions for 67 motors of cells expressing CheY-P. The number of motors for each CCW bias group was 29 for a CCW bias of 0.1 ± 0.1, 13 for a CCW bias of 0.3 ± 0.1, 8 for a CCW bias of 0.5 ± 0.1, 10 for a CCW bias of 0.7 ± 0.1, and 7 for a CCW bias of 0.9 ± 0.1. Each motor was observed for about 5 min.
Fig. 2.

Mean CCW bias averaged in a 30-s running window as a function of time. (A) Thirty-minute-long measurement of a single motor. (B) Thirty-minute-long Poisson simulation with the same bias and mean CCW and CW intervals, as in the experiment.
We computed the power spectra for the switching time series and averaged them for motors in the same groups of CCW bias, as shown in Fig. 3. Their Lorentzian profiles found here are in contrast with previous observations showing frequency peaks near 1 s−1 (9). The slope of the power spectra for frequencies less than 1 s−1 is consistent with temporal variations of the mean CW and CCW intervals, as observed earlier. As demonstrated in a model proposed by Tu and Grinstein (19), bias fluctuation can lead to long tails (i.e., curvature in a semilog plot) in interval distributions and to a slope in the power spectrum at low frequencies. The deviation from Lorentzian profile at low frequencies was used to extract signaling noise in recent work by Park and colleagues (20).
Fig. 3.
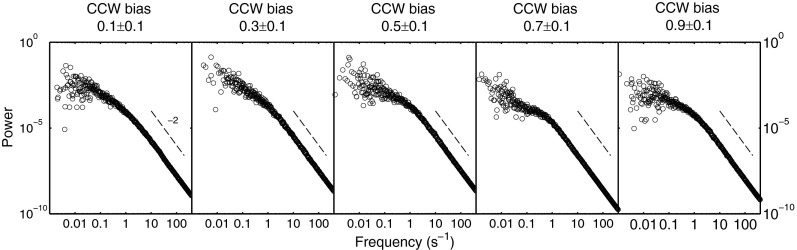
Power spectra for the same 67 motors as in Fig. 1. The power spectra were averaged for motors in each CCW bias group. Dashed lines with slope of −2 expected for the tail of a Lorentzian profile were provided as references.
To test whether the temporal variation of the mean CW and CCW intervals were a result of fluctuation of CheY-P concentration in the first strain we constructed, we used another strain, HCB901 transformed with the plasmid pACYC184-Iq. The latter strain expresses CheY13DK106YW (a CheY double mutant that is active without phosphorylation) under control of the IPTG-inducible promoter Ptrc (15). Another strain active without phosphorylation used by Korobkova and colleagues (9) failed to show bias fluctuations. The CCW and CW interval distributions were measured for this strain, as shown in Fig. 4. The curvatures in these semilog plots are similar to those in Fig. 1 and the bias fluctuations for this strain were similar to those in Fig. 2A, as shown in Fig. S1. Therefore, the fluctuations are not caused by variations in the concentration of CheY-P but, rather, must involve dynamics of elements of the motor stator or switch complex. Recent experiments show that the motor is a dynamic structure, with Mot proteins (21) and FliM molecules coming on and off (22, 23). Changes in number of stator elements and FliM molecules can induce changes in motor bias (and hence changes in mean intervals) (23, 24). Fluctuations in the numbers of stator elements might be more significant, as at low loads, their mean number is quite small: one or sometimes two (24, 25). We did not observe large bias fluctuations at high load, where the number of stator elements is relatively large, in the range of 8–11. Bias data for a CheY13DK106Y strain with 1-μm-diameter beads attached to short filament stubs are shown in Fig. S2. These results also confirm that fluctuations observed near zero load are not a result of variations in the level of CheY, as these variations also would occur at high loads. As an additional test of whether fluctuations in numbers of stator elements contribute to the bias fluctuations, we overexpressed MotA and MotB by using an additional plasmid in JY33, in which these proteins were expressed under control of an arabinose-inducible promoter, with the thought that with excess MotA and MotB, it would be less likely for the numbers of stator elements to reach small values. The bias fluctuation with this construct was suppressed to some extent, as shown in Fig. S3, although it was not suppressed as fully as for the motor under high load (Fig. S2). The interval distributions and power spectra for the two motors shown in Fig. S3 overexpressing MotA and MotB are shown in Figs. S4 and S5. The interval distributions are closer to an exponential profile, and the power spectra are closer to a Lorentzian profile compared with Figs. 1, 3, and 4.
Fig. 4.

CCW (Top) and CW (Bottom) interval distributions for 156 motors of cells expressing the CheY variant that is active without phosphorylation. The number of motors for each CCW bias group was 52 for a CCW bias of 0.1 ± 0.1, 18 for a CCW bias of 0.3 ± 0.1, 14 for a CCW bias of 0.5 ± 0.1, 19 for a CCW bias of 0.7 ± 0.1, and 53 for a CCW bias of 0.9 ± 0.1. Each motor was observed for about 200 s.
Discussion
Motor switching has been modeled as an equilibrium two-state Poisson process, with a thermal isomerization model (15), a concerted allosteric Monod–Wyman–Changeux model (16), or more generally, a conformational spread model (26), all of which predict exponentially distributed CCW and CW interval distributions and Lorentzian power spectra. Our observations support these models.
The interval distributions for motor switching have been measured before at high and intermediate loads, either with 1-μm-diameter beads attached to relatively long filaments (9) or with 0.5-μm-diameter beads attached to short filament stubs (7). Here, we used the nanogold technique, which was developed to study motor behavior near zero load (11–13). This technique has been used to study motor switching rates as a function of loads (12) but has not been used to examine the motor switching interval distributions.
The gamma-distributed intervals found by Korobkova and colleagues (9), which suggested the existence of nonequilibrium effects in motor switching (27), appear to be, instead, a result of changes in conformation of the long filaments to which the beads were attached. In the model proposed by van Albada and colleagues (10), the effects of filament polymorphic transformations and changes in motor switching rates as a function of load were combined to successfully reproduce the gamma distribution, assuming a Poisson process for the motor switching itself. Our results are consistent with recent measurements using 0.5-μm-diameter beads attached to short filament stubs (7) that also gave exponential interval distributions. Thus, all that is required for such results is that connections between beads and motors be short. With the nanogold technique, the external viscous drag is so low that the angular position of the bead provides an accurate report of the angular position of the motor’s drive shaft.
In summary, motor switching near zero load appears to be an equilibrium two-state Poisson process, aside from bias fluctuations resulting from changes in the small numbers of force-generating elements that occur on a relatively long time scale.
Materials and Methods
Strains and Plasmids.
JY33 (ΔcheB cheZ fliC, with the wild-type promoter of cheY on the chromosome replaced with a Ptrc promoter) and HCB901 (ΔcheZ fliC, Ptrc420 cheY13DK106YW) (15) are both derivatives of E. coli K12 strain RP437. The plasmid pACYC184-Iq constitutively expresses LacIq (15). The plasmid pBES38 constitutively expresses both LacIq and the sticky filament FliCst (15). The plasmid pJY7 expresses wild-type MotA and MotB under the control of an arabinose-inducible promoter in the vector pBAD33 (28). To measure the interval distributions, JY33 transformed with pACYC184-Iq and HCB901 transformed with the plasmid pACYC184-Iq were used. To measure bias fluctuations for motors at high load, HCB901 transformed with pBES38 was used. To measure bias fluctuations for motors near zero load with overexpressed MotA and MotB, JY33 transformed with pACYC184-Iq and pJY7 was used.
Experimental Procedure.
Cells were grown at 33 °C in T-broth with the appropriate antibiotics (12.5 μg/mL tetracycline, 170 μg/mL chloramphenicol, 100 μg/mL ampicillin) and various amounts of the inducer IPTG (0–50 μM) and/or 100 μg/mL arabinose to an OD600 between 0.45 and 0.50 and were harvested by washing twice with motility medium (10 mM potassium phosphate, 0.1 mM EDTA, 10 mM lactate, and 70 mM NaCl at pH 7.0).
To measure motor switching near zero load, gold spheres 150 nm in diameter (15712, Ted Pella Inc.) were attached to the hooks of the washed cells with antihook antibody, following the procedure described previously (11). Next, 55 μL of the cell sample was placed on a glass coverslip coated with poly-L-lysine (0.01%, P4707; Sigma) and allowed to stand for 5 min. The coverslip was installed as the top window of a flow chamber (29), and a constant flow of motility medium (80 μL/min) was maintained by a syringe pump (Pump-22; Harvard Apparatus). The gold spheres were observed by laser dark-field microscopy, as described previously (12). All experiments were performed at 23 °C.
To measure motor switching at high load, cells were sheared to truncate flagella by passing 1 mL of the washed-cell suspension 50 times between two syringes equipped with 23-gauge needles and connected by a 7-cm length of polyethylene tubing (0.58 mm i.d., no. 427411; Becton Dickinson). Then, 1.0-mm-diameter polystyrene latex beads (no. 07310; Polysciences) were attached to the flagellar stubs, as described previously (23). The polystyrene beads were observed by phase-contrast microscopy.
Supplementary Material
Acknowledgments
This work was supported by National Natural Science Foundation of China Grant 11374282 (to J.Y.), Fundamental Research Funds for the Central Universities (WK2030020023, to J.Y.), and National Institutes of Health Grant AI016478 (to H.C.B.). J.Y. is supported by Chinese Government “1000 Youth Talent Program.”
Footnotes
The authors declare no conflict of interest.
This article contains supporting information online at www.pnas.org/lookup/suppl/doi:10.1073/pnas.1418548111/-/DCSupplemental.
References
- 1.Turner L, Ryu WS, Berg HC. Real-time imaging of fluorescent flagellar filaments. J Bacteriol. 2000;182(10):2793–2801. doi: 10.1128/jb.182.10.2793-2801.2000. [DOI] [PMC free article] [PubMed] [Google Scholar]
- 2.Welch M, Oosawa K, Aizawa S, Eisenbach M. Phosphorylation-dependent binding of a signal molecule to the flagellar switch of bacteria. Proc Natl Acad Sci USA. 1993;90(19):8787–8791. doi: 10.1073/pnas.90.19.8787. [DOI] [PMC free article] [PubMed] [Google Scholar]
- 3.Cluzel P, Surette M, Leibler S. An ultrasensitive bacterial motor revealed by monitoring signaling proteins in single cells. Science. 2000;287(5458):1652–1655. doi: 10.1126/science.287.5458.1652. [DOI] [PubMed] [Google Scholar]
- 4.Sourjik V, Berg HC. Binding of the Escherichia coli response regulator CheY to its target measured in vivo by fluorescence resonance energy transfer. Proc Natl Acad Sci USA. 2002;99(20):12669–12674. doi: 10.1073/pnas.192463199. [DOI] [PMC free article] [PubMed] [Google Scholar]
- 5.Silverman M, Simon M. Flagellar rotation and the mechanism of bacterial motility. Nature. 1974;249(452):73–74. doi: 10.1038/249073a0. [DOI] [PubMed] [Google Scholar]
- 6.Ryu WS, Berry RM, Berg HC. Torque-generating units of the flagellar motor of Escherichia coli have a high duty ratio. Nature. 2000;403(6768):444–447. doi: 10.1038/35000233. [DOI] [PubMed] [Google Scholar]
- 7.Bai F, et al. Conformational spread as a mechanism for cooperativity in the bacterial flagellar switch. Science. 2010;327(5966):685–689. doi: 10.1126/science.1182105. [DOI] [PubMed] [Google Scholar]
- 8.Korobkova E, Emonet T, Vilar JM, Shimizu TS, Cluzel P. From molecular noise to behavioural variability in a single bacterium. Nature. 2004;428(6982):574–578. doi: 10.1038/nature02404. [DOI] [PubMed] [Google Scholar]
- 9.Korobkova EA, Emonet T, Park H, Cluzel P. Hidden stochastic nature of a single bacterial motor. Phys Rev Lett. 2006;96(5):058105. doi: 10.1103/PhysRevLett.96.058105. [DOI] [PubMed] [Google Scholar]
- 10.van Albada SB, Tănase-Nicola S, ten Wolde PR. The switching dynamics of the bacterial flagellar motor. Mol Syst Biol. 2009;5:316. doi: 10.1038/msb.2009.74. [DOI] [PMC free article] [PubMed] [Google Scholar]
- 11.Yuan J, Berg HC. Resurrection of the flagellar rotary motor near zero load. Proc Natl Acad Sci USA. 2008;105(4):1182–1185. doi: 10.1073/pnas.0711539105. [DOI] [PMC free article] [PubMed] [Google Scholar]
- 12.Yuan J, Fahrner KA, Berg HC. Switching of the bacterial flagellar motor near zero load. J Mol Biol. 2009;390(3):394–400. doi: 10.1016/j.jmb.2009.05.039. [DOI] [PMC free article] [PubMed] [Google Scholar]
- 13.Yuan J, Berg HC. Thermal and solvent-isotope effects on the flagellar rotary motor near zero load. Biophys J. 2010;98(10):2121–2126. doi: 10.1016/j.bpj.2010.01.061. [DOI] [PMC free article] [PubMed] [Google Scholar]
- 14.Parkinson JS. Complementation analysis and deletion mapping of Escherichia coli mutants defective in chemotaxis. J Bacteriol. 1978;135(1):45–53. doi: 10.1128/jb.135.1.45-53.1978. [DOI] [PMC free article] [PubMed] [Google Scholar]
- 15.Scharf BE, Fahrner KA, Turner L, Berg HC. Control of direction of flagellar rotation in bacterial chemotaxis. Proc Natl Acad Sci USA. 1998;95(1):201–206. doi: 10.1073/pnas.95.1.201. [DOI] [PMC free article] [PubMed] [Google Scholar]
- 16.Alon U, et al. Response regulator output in bacterial chemotaxis. EMBO J. 1998;17(15):4238–4248. doi: 10.1093/emboj/17.15.4238. [DOI] [PMC free article] [PubMed] [Google Scholar]
- 17.Berg HC, Brown DA. Chemotaxis in Escherichia coli analysed by three-dimensional tracking. Nature. 1972;239(5374):500–504. doi: 10.1038/239500a0. [DOI] [PubMed] [Google Scholar]
- 18.Park H, Oikonomou P, Guet CC, Cluzel P. Noise underlies switching behavior of the bacterial flagellum. Biophys J. 2011;101(10):2336–2340. doi: 10.1016/j.bpj.2011.09.040. [DOI] [PMC free article] [PubMed] [Google Scholar]
- 19.Tu Y, Grinstein G. How white noise generates power-law switching in bacterial flagellar motors. Phys Rev Lett. 2005;94(20):208101. doi: 10.1103/PhysRevLett.94.208101. [DOI] [PubMed] [Google Scholar]
- 20.Park H, et al. Interdependence of behavioural variability and response to small stimuli in bacteria. Nature. 2010;468(7325):819–823. doi: 10.1038/nature09551. [DOI] [PMC free article] [PubMed] [Google Scholar]
- 21.Leake MC, et al. Stoichiometry and turnover in single, functioning membrane protein complexes. Nature. 2006;443(7109):355–358. doi: 10.1038/nature05135. [DOI] [PubMed] [Google Scholar]
- 22.Delalez NJ, et al. Signal-dependent turnover of the bacterial flagellar switch protein FliM. Proc Natl Acad Sci USA. 2010;107(25):11347–11351. doi: 10.1073/pnas.1000284107. [DOI] [PMC free article] [PubMed] [Google Scholar]
- 23.Yuan J, Branch RW, Hosu BG, Berg HC. Adaptation at the output of the chemotaxis signalling pathway. Nature. 2012;484(7393):233–236. doi: 10.1038/nature10964. [DOI] [PMC free article] [PubMed] [Google Scholar]
- 24.Lele PP, Hosu BG, Berg HC. Dynamics of mechanosensing in the bacterial flagellar motor. Proc Natl Acad Sci USA. 2013;110(29):11839–11844. doi: 10.1073/pnas.1305885110. [DOI] [PMC free article] [PubMed] [Google Scholar]
- 25.Tipping MJ, Delalez NJ, Lim R, Berry RM, Armitage JP. Load-dependent assembly of the bacterial flagellar motor. MBio. 2013;4(4):e00551-13. doi: 10.1128/mBio.00551-13. [DOI] [PMC free article] [PubMed] [Google Scholar]
- 26.Duke TAJ, Le Novère N, Bray D. Conformational spread in a ring of proteins: A stochastic approach to allostery. J Mol Biol. 2001;308(3):541–553. doi: 10.1006/jmbi.2001.4610. [DOI] [PubMed] [Google Scholar]
- 27.Tu Y. The nonequilibrium mechanism for ultrasensitivity in a biological switch: Sensing by Maxwell’s demons. Proc Natl Acad Sci USA. 2008;105(33):11737–11741. doi: 10.1073/pnas.0804641105. [DOI] [PMC free article] [PubMed] [Google Scholar]
- 28.Guzman L-M, Belin D, Carson MJ, Beckwith J. Tight regulation, modulation, and high-level expression by vectors containing the arabinose PBAD promoter. J Bacteriol. 1995;177(14):4121–4130. doi: 10.1128/jb.177.14.4121-4130.1995. [DOI] [PMC free article] [PubMed] [Google Scholar]
- 29.Berg HC, Block SM. A miniature flow cell designed for rapid exchange of media under high-power microscope objectives. J Gen Microbiol. 1984;130(11):2915–2920. doi: 10.1099/00221287-130-11-2915. [DOI] [PubMed] [Google Scholar]
Associated Data
This section collects any data citations, data availability statements, or supplementary materials included in this article.