

Abstract
Simplified classical water models are currently an indispensable component in practical atomistic simulations. Yet, despite several decades of intense research, these models are still far from perfect. Presented here is an alternative approach to constructing widely used point charge water models. In contrast to the conventional approach, we do not impose any geometry constraints on the model other than the symmetry. Instead, we optimize the distribution of point charges to best describe the “electrostatics” of the water molecule. The resulting “optimal” 3-charge, 4-point rigid water model (OPC) reproduces a comprehensive set of bulk properties significantly more accurately than commonly used rigid models: average error relative to experiment is 0.76%. Close agreement with experiment holds over a wide range of temperatures. The improvements in the proposed model extend beyond bulk properties: compared to common rigid models, predicted hydration free energies of small molecules using OPC are uniformly closer to experiment, with root-mean-square error <1 kcal/mol.
Water is the most extensively studied molecule1−3 of unique importance to life. Yet our understanding of how this deceptively simple compound of just three atoms gives rise to the many extraordinary properties of its liquid phase4−6 is far from complete.7 The complexity of the water properties combined with multiple possible levels of approximation (e.g., quantum vs classical, flexible vs rigid) has led to the proposal of literally hundreds of theoretical and computational models for water.8 Among classical water models,9−21 the most simple and computationally efficient, rigid nonpolarizable models that represent water as a set of point charges at fixed positions relative to the oxygen nucleus stand out as the class used in the vast majority of biomolecular studies today. Most commonly used models of this class, (e.g., TIP3P9 and SPCE10 3-point models, TIP4PEw12 4-point model, and the TIP5P11 5-point model) have achieved a reasonable compromise between accuracy and speed, but are by no means perfect.8,22 In particular, none of these models faithfully reproduce all of the key properties of bulk water simultaneously. Given the extraordinary complexity of real water–water interactions and hydrogen bonding networks in liquid phase, and their sensitivity to various model properties,23 even modest inaccuracies of water models can adversely affect outcomes of atomistic biomolecular modeling in an unpredictable manner. Particularly worrisome is the fact that improvements in overall model accuracy do not necessarily translate into improvements in the accuracy of quantities most relevant to biomolecular simulations, such as molecular hydration free energies. For example, counterintuitively, TIP3P model predicts hydration free energies of small neutral molecules more accurately24 than the TIP4PEw model that fixed several of TIP3P flaws; TIP5P,11 which is known to yield excellent water structure, is even less accurate in that respect.24 But even for TIP3P, the average errors are still outside the desired “chemical accuracy” of less than 1 kcal/mol, a goal for rational drug design250 efforts. The need for better accuracy motivates an ongoing search for more accurate yet computationally facile water models.17−20
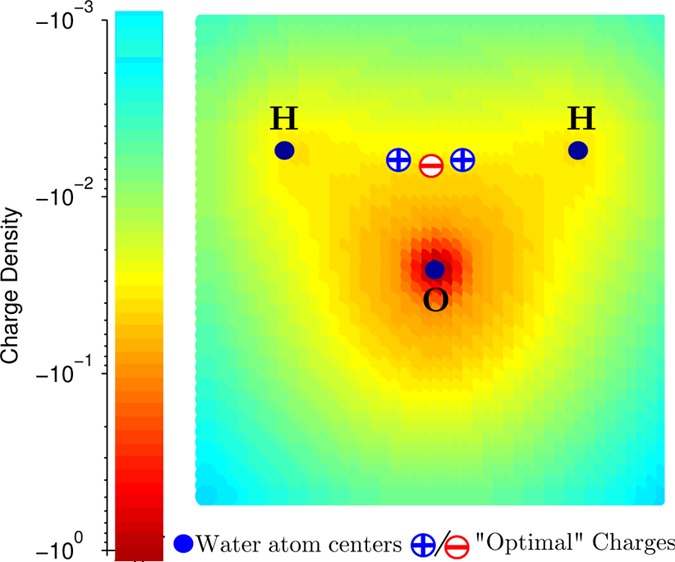
Most unique properties of liquid water are due to the ability of the water molecules to establish a hydrogen-bonded structure, through the attraction between the electropositive hydrogen atoms and the electronegative oxygen atoms.26 Therefore, a key challenge in developing classical water models is to find an accurate yet simplified description of the charge distribution of the water molecule that can adequately account for the hydrogen bonding in the liquid phase. For the past 30 years, the basic approach used to construct point charge water models, inspired by the classical works27,28 that revealed V-shape of water molecule and suggested near-tetrahedral arrangement of its charges, has been the same: the atomic partial charges and the Lennard-Jones potential parameters are optimized to reproduce selected bulk properties of water.8 While sophistication of the optimization techniques employed to find the optimum has grown tremendously,21 from essentially “guess-and-test” to the complex, state-of-the-art optimization techniques,17,21,29−31 one crucial aspect of the overall procedure has not changed: it imposes constraints on the allowed variations of the model geometry. That is, |OH| bond length and ∠HOH angle are either fixed, or are only allowed to vary slightly around their “canonical” values. The assumption is that optimal locations of the positive point charges of the model should be somewhere near the experimental hydrogen nuclei positions. This approach may not necessarily accurately reproduce the electrostatic characteristics of the water molecule due to severe constraints on allowed variations in the charge distribution being optimized. In fact, the configuration of three point charges to best describe the charge distribution of the water molecule can be very different from what one may intuitively expect based on its well-known atomic structure. Consider, for example, the gas-phase quantum-mechanical (QM) charge distribution of water molecule (Figure 1). The shown tight cluster of the point charges away from the nuclei reproduces the electrostatic potential around the QM charge distribution considerably more accurately than the more traditional distribution with point charges placed on or near the nuclei. For the optimal charge placement (Figure 1), the maximum error in electrostatic potential at the experimental oxygen–Na+ distance (2.23 Å) from the origin, is almost 5.4 times smaller than that of the nucleus-centered alternative (1.4 kcal/mol vs 7.56 kcal/mol). Intrigued by the idea that optimal placement of the point charges in a water model can be very different from the “intuitive” placement on the nuclei, and encouraged by the significant improvement of the accuracy of electrostatics brought about by this strategy in gas-phase, we have formulated and tested a different approach to building classical water models for the liquid phase.
Figure 1.

Charge distribution of the water molecule in the gas phase obtained from a quantum mechanical calculation.25 Counterintuitively, three point charges that optimally reproduce the electrostatic potential of this charge distribution are clustered in the middle, as opposed to the on-nuclei placement used by common water models that results in a much poorer electrostatic description of the underlying charge distribution.25
Within classical potential functions used by point charge water models, the complexity of the hydrogen bonding interactions are primarily described by the electrostatic interactions.32 While the electrostatic interactions are complemented by a Lennard-Jones (LJ) potential, the latter is generally represented by a single site centered on the oxygen: the corresponding interaction is isotropic and featureless, in contrast to hydrogen bonding, which is directional. Therefore, an accurate representation of electrostatic interactions is paramount for accurately accounting for hydrogen bonding and the properties of liquid water. In a search for the best “electrostatics”, commonly used distance and angle constraints on the configuration of a model’s point charges are of little relevance to classical rigid water models, yet these constraints impede the search for the “best” model geometry. This observation leads to one of the key features of our approach: any “intuitive” constraints on point charges or their geometry (other than the fundamental C2v symmetry of water molecule) are completely abandoned here in favor of finding an optimal electrostatic charge distribution that best approximates liquid properties of water.
While ultimately it is the values of the point charges and their relative positions that we seek (Figure 2), we argue that the conventional “charge–distances–angles” space9−12 is not optimal to perform the search for the best electrostatics model. These coordinates affect the resulting electrostatic potential in a convoluted manner, and it is unclear which ones, if any, may be relatively more important than others. At the same time, many key properties of liquid water are extraordinarily sensitive to tiny changes in parameters of these models (hence the number of significant digits kept to describe their parameters). The optimization landscape in the “charges–distances–angles” space is apparently complex, with multiple local optima, so that even the best minimization methods are virtually guaranteed to fail to locate the global optimum that may be far away from an initial “intuitive” guess. On the other hand, the electric field outside any complex charge distribution can be systematically approximated via its multipole moments,33 with lower order moments expected to have stronger effect on the electrostatic potential,33 and, not surprisingly, on liquid water properties as well.15,34,35 Hence, our second key proposal is to search for optimal parameters of fixed-point charge models in the electrostatically most relevant, low-dimensional subspace of lowest multipole moments, rather than in the convoluted high-dimensional charges–distances–angles space “native” to point-charge models. An exhaustive search for the optimum is enabled by a set of closed form, analytical expressions (see Computational Methods) that for any input set of water multipole moments finds a unique configuration of n point charges that optimally represent the electrostatic potential of the input multipoles, even for small n. The fundamental symmetry (C2v) of water molecule makes such nontrivial mapping possible.
Figure 2.
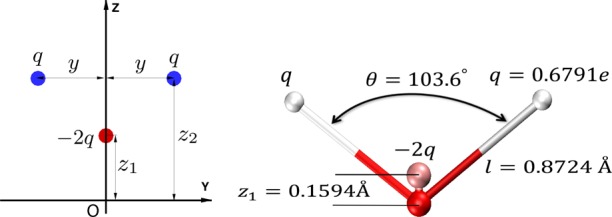
Left: The most general configuration for a three point charge water model consistent with C2v symmetry of the water molecule. The single Lennard-Jones interaction is centered on the origin (oxygen). Right: The final, optimized geometry of the proposed 3-charge, 4-point OPC water model.
Clearly, any reasonable water model needs to account for the large dipole moment of water molecule in order to reproduce dielectric properties of the liquid state.20,36,37 At short distances where hydrogen bonds between water molecules form (≈2.8 Å), the relevance of higher electrostatic moments is also significant. For instance, the larger component of the water quadrupole has a strong effect on the liquid water structure seen in simulations36 and on the phase diagram;38 quadrupole moment’s importance for water models was pointed out a long time ago.39,40 The next-order terms—octupole moments—while presumably less influential, also affect water structure, e.g., around ions.16 An intricate interplay between the dipole, quadrupole, and octupole moments gives rise to the experimentally observed charge hydration asymmetry of aqueous solvation: strong dependence of hydration free energy on the sign of the solute charge.41,42 Therefore, we seek a fixed-charge rigid model that optimally represents the three lowest order multipole moments of the water molecule.
Specifics of the proposed approach are exemplified below through the construction and testing of a 4-point, rigid “optimal” point charge (OPC) water model. To optimally reproduce the three lowest order multipole moments for the water molecule charge distribution, a minimum of three point charges are needed.25 The most general configuration for a three point charge model consistent with C2v symmetry of the water molecule is shown in Figure 2: the point charges are placed in a V-shaped pattern in the Y–Z plane. We follow convention9−12 and place the single LJ site on the oxygen atom. The four parameters (q, z2, z1 and y) that completely define the charge distribution (Figure 2) are uniquely determined via analytical equations introduced in the Computational Methods section, to best reproduce a targeted set of three lowest order multipole moments (dipole, quadrupole and octupole).25 Specifically, the optimal parameters of each test model are such that the two lowest order moments are reproduced exactly, while the octupole is optimally approximated (minimum rms error).25
The ability to independently vary the moments of the charge distribution, provided by these analytical expressions, makes computationally feasible a full exploration in the relevant subspace of the moments. Generally, the importance of the multipole moments are inversely related to their order. The highest order multipole moment here is the octupole that has two independent components (Ω0 and ΩT), which we fix to high quality quantum mechanical (QM) predictions, QM/230TIP5P,43 Table 1. The linear component of the quadrupole Q0 is known to be relatively small for the water molecule and not expected to be very important,44 therefore, we also simply set it to the known QM value (QM/230TIP5P,43 Table 1). This leaves the two most important components, the dipole (μ) and the “square” quadrupole (QT = 1/2(Qyy – Qxx); see Computational Methods), as the two key search parameters we vary. We attempt to find the best fit to six key bulk properties by exhaustively searching in the 2D space of μ and QT (Figure 3) within the ranges that reflect known experimental uncertainties45 and those of QM calculations46,47 (Table 1). The six target bulk properties are static dielectric constant ϵ0, self-diffusion coefficient D, heat of vaporization ΔHvap, density ρ and the position roo1 and height g(roo1) of the first peak in oxygen–oxygen pair distribution functions. These properties are calculated from molecular dynamics (MD) simulations (see Computational Methods and the Supporting Information (SI)). For every trial value of μ and QT (and the fixed values of Q0, Ω0, and ΩT), the charge distribution parameters (q, z2, z1, and y) are analytically determined (see Computational Methods).
Table 1. Water Molecule Multipole Moments Centered on Oxygen: From Experiment, Common Rigid Models, Liquid Phase Quantum Calculations, and OPC Model (This Work).
| model | μ [D] | Q0 [DÅ] | QT [DÅ] | Ω0 [DÅ2] | ΩT [DÅ2] |
|---|---|---|---|---|---|
| EXP (liquid)45 | 2.5–3 | NA | NA | NA | NA |
| SPC/E | 2.35 | 0.00 | 2.04 | –1.57 | 1.96 |
| TIP3P | 2.35 | 0.23 | 1.72 | –1.21 | 1.68 |
| TIP4P/Ew | 2.32 | 0.21 | 2.16 | –1.53 | 2.11 |
| TIP5P | 2.29 | 0.13 | 1.56 | –1.01 | 0.59 |
| AIMD147 | 2.95 | 0.18 | 3.27 | NA | NA |
| AIMD246 | 2.43 | 0.10 | 2.72 | NA | NA |
| QM/4MM36 | 2.49 | 0.13 | 2.93 | –1.73 | 2.09 |
| QM/4TIP5P36 | 2.69 | 0.26 | 2.95 | –1.70 | 2.08 |
| QM/230TIP5P43 | 2.55 | 0.20 | 2.81 | –1.52 | 2.05 |
| OPC | 2.48 | 0.20 | 2.3 | -1.484 | 2.068 |
Figure 3.

Quality score distribution of test water models in the space of dipole (μ) and quadrupole (QT). Scores (from 0 to 10) are calculated based on the accuracy of predicted values for six key properties of liquid water (see text). The resulting proposed optimal model is termed OPC. For reference, the μ and QT values of several commonly used water models (triangles, quality score given by the color at the symbol position) and quantum calculations (squares) are placed on the same map (see also Table 1). The actual positions of AIMD1 and TIP5P are slightly modified to fit in the range shown.
For every charge distribution calculated as above, the value ALJ of the 12–6 Lennard-Jones (LJ) potential (see SI), which is mainly responsible for the liquid structure,44 is selected so that the location of the first peak goo(r) of the oxygen–oxygen radial distribution function (RDF) is in agreement with recent experiment.48 The value of BLJ is optimized so that the experimental value for density is achieved. The parameters ALJ and BLJ can be optimized nearly independently due to the weak coupling between them.44
The result of the above search procedure is a “quality map” of all possible water models in the μ–QT space: the proposed OPC model is the one with the highest quality score.
The entire region of the μ–QT space was mapped out using initially a relatively coarse grid spacing (0.1 D and 0.1 DÅ) in each direction shown in Figure 3. At this point, the quality of each test water model—corresponding to a μ,QT point on the map is characterized by a quality score function (see Computational Methods) from a recent comprehensive review49 based on the same six key bulk properties used for the fitting. Accordingly, each model is assigned a quality score, using the score function explained in the Computational Methods section, and is shown in Figure 3. As demonstrated in Figure 3, the highest quality region (the green area) occurs for (2.4 D ≤ μ ≤ 2.6 D) and (2.2 DÅ ≤ QT ≤ 2.4 DÅ). The region is relatively small, and this is why an exhaustive, fine-grain search was required to identify the best model, which we refer to as the OPC model (Figure 3).
From Figure 3, one can see three distinct regions in the μ–QT space: the “common water models” region with relatively small dipole and square quadrupole moments, the “QM” region characterized by larger dipole and square quadrupole, and narrow, high quality (OPC) region with intermediate values of these two key moments. Compared to the other rigid models shown, OPC reproduces the multipole moments of water molecule in the liquid phase substantially better. In fact, the OPC dipole moment (2.48 D) is in best agreement with the range of values from experiment45 and QM calculations;36,43,46,47 OPC’s best fit value of μ coincides with a recent DFT-based estimate in liquid phase.37 OPC’s QT (2.3 DÅ) is larger than the corresponding values of the common models, and is closest to the QM predictions (Figure 3, Table 1). By construction, OPC’s small Q0 component of the quadrupole moment matches the reference QM value, and its octupole moments are the best approximations. The improved accuracy of the OPC moments is an immediate consequence of the focus on electrostatics and the unrestricted fine-grain search in the μ–QT subspace of the lowest, most relevant component of water multipole moments. The important improvements in the quality of model’s liquid phase characteristics, seen in OPC, became possible through the abandoning of the conventional geometrical constraints used in model construction, which has allowed for the multipole moments to be varied independently. The availability of analytical equations that connect the optimal point charge distributions with the input multipole moments played an important role too.
While the OPC moments are closest to the QM values, they (in particular QT) still deviate from the QM predictions (Table 1, Figure 3). The low quality of the test models (Figure 3) in which the moments were close to the QM values (squares, Figure 3) suggests that, within the 3-charge models explored here, an optimal fit of moments to QM predictions does not guarantee agreement with experimental liquid phase properties. This discrepancy can be due to a number of limitations and approximations inherent to classical, rigid, nonpolarizable water models (see, e.g., refs (8, 19, and 49)). It may also be that only three point charges, even if placed optimally, are not enough to represent the complex charge distribution of real water molecule to the needed degree of accuracy. Namely, a three point charge model is fundamentally unable to exactly reproduce the reference dipole, quadrupole, and octupole moments simultaneously,25 and essentially has no control over the accuracy of its moments beyond the octupole. The contribution of the higher order multipole moments to electrostatic potential can be significant at close distances, which are relevant to water–water and water–ion interactions in liquid phase. We conjecture that the relatively small μ and QT value found at the highest quality region (green zone, Figure 3) compared to QM predictions (squares, Figure 3) may be a compromise to keep the higher moments not too far from the optimal, ensuring a reasonable net electrostatic potential.
The OPC point charge positions and values and the LJ parameters are listed in Table 2. The |O–q+| distances for OPC are shorter (0.8724 Å), and the ∠q+Oq+ angle (Figure 2) is slightly narrower (103.6°) than the corresponding experimental values of |O–H| bond and ∠HOH angle for the water molecule in the gas phase (0.9572 Å and 104.52°). The charge magnitudes of the OPC model are significantly larger than those of other common models (Table 2). Although the OPC charge distribution is not as tightly clustered as the configuration of the optimal charge model in the gas phase (Figure 1), the deviation of OPC geometry from that of other models and the water molecule in the gas phase is influential. In particular, the quality of water models is extremely sensitive to the values of electrostatic multipole moments (Figure 3), which by themselves are very sensitive to the geometrical parameters (eqs 1–3 and the SI).
Table 2. Force Field Parameters of OPC and Some Common Rigid Models, Where σLJ = (ALJ/BLJ)1/6 and ϵLJ = BLJ2/(4ALJ)a.
| q [e] | l [Å] | z1 [Å] | Θ [deg] | σLJ [Å] | ϵLJ [kJ/mol] | |
|---|---|---|---|---|---|---|
| EXP(gas) | NA | 0.9572 | NA | 104.52 | NA | NA |
| TIP3P | 0.417 | 0.9572 | NA | 104.52 | 3.15061 | 0.6364 |
| TIP4PEw | 0.5242 | 0.9572 | 0.125 | 104.52 | 3.16435 | 0.680946 |
| TIP5P | 0.241 | 0.9572 | NA | 104.52 | 3.12 | 0.6694 |
| SPC/E | 0.4238 | 1.0 | NA | 109.47 | 3.166 | 0.65 |
| OPC | 0.6791 | 0.8724 | 0.1594 | 103.6 | 3.16655 | 0.89036 |
For comparison, water molecule geometry in the gas phase is also included.
The quality of the model in reproducing experimental bulk water properties at ambient conditions, and a comparison with other most commonly used rigid models is presented in Table 3. For each of 11 key liquid properties (Table 3) against which water models are most often benchmarked,12,49,50 our proposed model deviates by no more than 1.8% from the corresponding experimental value, except for one property (thermal expansion coefficient) that deviates from experiment by about 5%. While a targeted optimization may further improve the agreement of thermal expansion coefficient with experiment, an overall improvement of the model accuracy may require including (n > 3) point charges, and eventually incorporating polarization and nuclear motion effects. The full O–O and O–H radial distribution functions (RDF), g(rOO) and g(rOH), are presented in the SI. By design, the experimental position of first peak in O–O RDF is accurately reproduced by OPC. The position and height of other peaks in O–O and O–H RDFs are also closely reproduced.
Table 3. Model versus Experimental Bulk Properties of Water at Ambient Conditions (298.16 K, 1 bar): Dipole μ, Density ρ, Static Dielectric Constant ϵ0, Self Diffusion Coefficient D, Heat of Vaporization ΔHvap, First Peak Position in the RDF roo1, Propensity for Charge Hydration Asymmetry (CHA),41,51,52 Isobaric Heat Capacity Cp, Thermal Expansion Coefficient αp, and Isothermal Compressibility κTa.
| property | TIP4PEw12 | SPCE17,49 | TIP3P11,49 | TIP5P11,49 | OPC | EXP48,50 |
|---|---|---|---|---|---|---|
| μ(D) | 2.32 | 2.352 | 2.348 | 2.29 | 2.48 | 2.5–3 |
| ρ[g/cm3] | 0.995 | 0.994 | 0.980 | 0.979 | 0.997 ± 0.001 | 0.997 |
| ϵ0 | 63.90 | 68 | 94 | 92 | 78.4 ± 0.6 | 78.4 |
| D [109 m2/s] | 2.44 | 2.54 | 5.5 | 2.78 | 2.3 ± 0.02 | 2.3 |
| ΔHvap [kcal/mol] | 10.58 | 10.43 | 10.26 | 10.46 | 10.57 ± 0.004 | 10.52 |
| roo1 [Å] | 2.755 | 2.75 | 2.77 | 2.75 | 2.80 | 2.80 |
| CHA propensityb | 0.52 | 0.42 | 0.43 | 0.13 | 0.51 | 0.51 |
| Cp [cal/(K·mol)] | 19.2 | 20.7 | 18.74 | 29 | 18.0 ± 0.05 | 18 |
| αp [10–4K–1] | 3.2 | 5.0 | 9.2 | 6.3 | 2.7 ± 0.1 | 2.56 |
| κT [10–6 bar–1] | 48.1 | 46.1 | 57.4 | 41 | 45.5 ± 1 | 45.3 |
| TMD [K] | 276 | 241 | 182 | 277 | 272 ± 1 | 277 |
The temperature of maximum density (TMD) is also shown. Bold fonts denote the values that are closest to the corresponding experimental data (EXP). Statistical uncertainties (±) are given where appropriate.
While commonly used models may be in good agreement with experiment for certain properties (Figure 4), they often produce large errors (sometimes amounting to over 250%) in some other key properties. In contrast, OPC shows a uniformly good agreement across all the bulk properties considered here.
Figure 4.
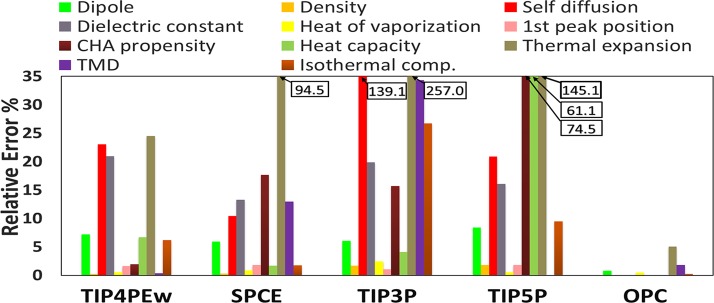
Relative error in various properties by the common rigid models and OPC (this work). Values of the errors that are cut off at the top are given in the boxes.
The ability of OPC to reproduce the temperature dependence of six key water properties is shown in Figure 5 (and SI). OPC is uniformly closest to experiment compared to the other models shown. It is noteworthy that OPC, which resulted from a search in the space of only two parameters (μ and QT) at only one thermodynamic condition (298.16 K and 1 bar) to fit a small subset of bulk properties, automatically reproduces a much larger number of bulk properties with a high accuracy across a wide range of temperatures where no fitting was performed. The procedure and the result are in contrast not only to commonly used, but also to some recent rigid17,18,54 and even polarizable models19 that generally employ massive and more specialized fits against multiple properties over a wide range of thermodynamic conditions. While noticeable advance in the accuracy of bulk properties is made by these latest models, the overall end result is not more accurate than OPC (see SI).
Figure 5.

Calculated temperature dependence of water properties compared to experiment and several common rigid water models. TIP4PEw results are from ref (12), TIP5P from refs (11, 12, and 50), TIP3P from refs (9, 17, 50, and 55), and SPCE from refs (17 and 56).
So far we have described comprehensive validation of OPC model in the liquid phase for which it is optimized. An equally comprehensive testing49 of the model outside the liquid phase would be of interest, but is out of scope in this Letter, which focuses on a new method. By construction, even a perfect fixed-charge rigid model that reproduced all bulk liquid properties exactly, would be inherently incapable to respond properly to the change of polarity of its microenvironment. Therefore, gas phase properties of OPC may not be as accurate as its liquid phase predictions. Nevertheless, reasonable higher multipole moments38 of OPC, well reproduced temperature dependence of bulk properties, and especially a close agreement with experiment of isothermal compressibility, may be indicative of OPC’s reasonable performance outside of liquid phase as well.49
One of the main goals of developing better water models is improving the accuracy of simulated hydration effects in molecular systems. Here we show that the optimized charge distribution of OPC model does lead to a more accurate representation of solute–water interactions, whose accuracy is critical to the outcomes of atomistic simulations. One of the most sensitive measure of the balance of intermolecular and solute–water interaction is hydration free energy, which has been used to evaluate the accuracy of molecular mechanics force fields and water models alike.57 To evaluate OPC’s accuracy, we use a set of 20 molecules randomly selected to cover a wide range of experimental hydration energies from a large common test set of small molecules24 (see Computational Methods). Compared to experiment, OPC predicts hydration free energy more accurately, on average (RMS error = 0.97 kcal/mol), as compared to 1.10 and 1.15 kcal/mol for TIP3P and TIP4PEw, respectively (see SI). The improvement is uniform across the range of solvation energies studied, from very polar to nonpolar molecules (see SI). The calculated average errors for OPC, TIP3P, and TIP4PEw are 0.62, 0.78, and 0.87 kcal/mol, respectively, which shows that OPC is systematically more accurate than the other models tested. OPC is more accurate despite the fact that force fields have been historically parametrized against TIP3P. Somewhat paradoxically, TIP3P, which is certainly not the most accurate commonly used rigid model (see Figure 4), has nevertheless been generally known thus far to give the highest accuracy in hydration free energy calculations.24 The accuracy improvement by OPC is then noteworthy as it shows that an improvement in the “right direction” can indeed lead to improvement in free energy estimates. To the best of our knowledge, OPC is the only classical point charge rigid model that predicts solvation free energies of small molecules within the “chemical accuracy” (RMS error ≤1 kcal/mol).
In summary, we have proposed a different approach to constructing classical water models. This approach recognizes that commonly used distance and angle constraints on the configuration of a model’s point charges are of little relevance to classical rigid water models; these artificial constraints complicate and impede the search for optimal charge distributions, key to reproducing unique features of liquid water. In our approach, such constraints are completely abandoned in favor of finding an optimal charge distribution (obeying only the fundamental C2v symmetry of water molecules) that best approximates properties of liquid water. Next, we focus on the lowest multipole moments which directly control the electrostatics of the model. The hierarchical importance of these moments for water properties allowed us to reduce the search space to essentially just two key parameters: the dipole and the square quadrupole (μ and QT) moments; the less important moments were fixed to the QM-derived values. The low dimensionality of the parameter space, combined with a set of derived equations that connect the optimal geometry and charge values of each test model to the input multipole moments, permitted a fine-grain exhaustive search virtually guaranteed to find an optimal solution within the accuracy class of water models considered here.
We believe that the general approach presented here can be used to develop water models with different numbers of point charges, including presumably even more accurate n-point (n > 4) models, and also flexible and polarizable models. We expect that finding an n-point charge optimum in the 2D parameter space (μ, QT) is not going to be significantly more difficult than for the 4-point model presented here. The current 4-point OPC model is included in the solvent library of the Amber v14 molecular dynamics (MD) software package, and has been tested in GROMACS 4.6.5. The computational cost of running molecular dynamics simulations with it is the same as that for the popular TIP4P model.
Computational Methods
Here we introduce the analytical equations that yield the positions and values of the three point charges that best reproduce the three lowest order multipole moments of the water molecule. The lowest three nonzero multipole moments of the water molecule are the dipole that is represented by one independent component (μ), the quadrupole defined by two independent components (Q0, QT), and the octupole defined by two independent components (Ω0, ΩT).34 In the coordinate system shown in Figure 2, these moments are related to the Cartesian components of the traceless multipole moments of water molecule as μ = μz, Q0 = Qzz, QT = 1/2(Qyy – Qxx), Ω0 = Ozzz, and ΩT = 1/2(Oyyz – Oxxz) (see SI).34,36,44
The optimal point charges are calculated so that these moments are sequentially reproduced, starting with the lowest order moments.25 The dipole and the quadrupole moments are reproduced exactly by requiring
| 1 |
| 2 |
| 3 |
where z2, z1, y and q are the independent unknown parameters that characterize the three point charge model (see Figure 2). The above set of equations is solved to find three geometrical parameters of the water model (z2, z1, and y).
| 4 |
| 5 |
This leaves only one unknown parameter, the charge value q, which we calculate by using two additional equations that relate the charge distribution parameters to the octupole moment components so that the octupole moment is optimally reproduced25 (see SI).
The calculations of thermodynamic and dynamical bulk properties were done based on standard equations in the literature (see SI for details). Unless specified otherwise, we use the following MD simulations protocol. Simulations in the NPT ensemble (1 bar, 298.16 K) were carried out using the PMEMD module of Amber suite of programs.58 All the computations were performed on GPU (GTX 680). A cubic box with edge length of 30 Å was filled with 804 water molecules. Periodic boundary conditions were used. Long-range electrostatic interactions, calculated via the particle mesh Ewald (PME) summation, and the van der Waals interactions were cut off at distance 8 Å. MD simulations were conducted with a 2 fs time step; all intramolecular geometries were constrained with SHAKE. The NPT simulations were performed using Langevin thermostat with coupling constant γ = 2.0 ps–1, and a Berendsen barostat with coupling constant of 1.0 ps–1 for equilibration and 3.0 ps–1 for production. We use the Amber default for the remaining parameters, unless otherwise specified. The duration of production runs vary between 1 to 65 ns, depending on the properties (see SI).
To mitigate uncertainties due to conformational variability, the 20 test molecule were randomly selected from a subset of 248 highly rigid molecules.42 Explicit solvent free energies calculations (via Thermodynamic Integration) were performed in GROMACS 4.6.559 using the GAFF60 small molecule parameters (see SI for further details).
The predictive power of models against experimental data was validated using a scoring system developed by Vega et al.49 For a calculated property x and a corresponding experimental value of xexp, the assigned score is obtained as49
| 6 |
where the tolerance (tol) is assigned to 0.5% for density, position of the first peak of the RDF and for heat of vaporization, 5% for height of the first peak of the RDF, and 2.5% for the remaining properties. The quality score assigned to each test model is equal to the average of the scores in bulk properties considered.
Acknowledgments
This work was supported by NIH GM076121, and in part by NSF grant CNS-0960081 and the HokieSpeed supercomputer at Virginia Tech. We thank Lawrie B. Skinner and Chris J. Benmore for providing experimental oxygen–oxygen pair-distribution function of water.
Supporting Information Available
Detailed analytical solution for optimal point charges, detailed procedure for calculating bulk properties and solvation free energies, additional bulk properties and comparison with most recent water models. This material is available free of charge via the Internet at http://pubs.acs.org.
The authors declare no competing financial interest.
Funding Statement
National Institutes of Health, United States
Supplementary Material
References
- Kale S.; Herzfeld J. Natural Polarizability and Flexibility via Explicit Valency: The Case of Water. J. Chem. Phys. 2012, 136, 084109+. [DOI] [PMC free article] [PubMed] [Google Scholar]
- Tu Y.; Laaksonen A. The Electronic Properties of Water Molecules in Water Clusters and Liquid Water. Chem. Phys. Lett. 2000, 329, 283–288. [Google Scholar]
- Dill K. A.; Truskett T. M.; Vlachy V.; Hribar-Lee B. Modeling Water, the Hydrophobic Effect, and Ion Solvation. Annu. Rev. Biophys. Biomol. Struct. 2005, 34, 173–199. [DOI] [PubMed] [Google Scholar]
- Finney J. L. The Water Molecule and Its Interactions: The Interaction between Theory, Modelling, and Experiment. J. Mol. Liq. 2001, 90, 303–312. [Google Scholar]
- Finney J. L. Water? What’s so Special about It?. Philos. Trans. R. Soc. London, Ser. B: Biol. Sci. 2004, 359, 1145–1165. [DOI] [PMC free article] [PubMed] [Google Scholar]
- Ball P.Life’s Matrix: A Biography of Water; Farrar, Straus and Giroux: New York, 1999. [Google Scholar]
- Stillinger F. H. Water Revisited. Science 1980, 209, 451–457. [DOI] [PubMed] [Google Scholar]
- Guillot B. A Reappraisal of What We Have Learnt during Three Decades of Computer Simulations on Water. J. Mol. Liq. 2002, 101, 219–260. [Google Scholar]
- Jorgensen W. L.; Chandrasekhar J.; Madura J. D.; Impey R. W.; Klein M. L. Comparison of Simple Potential Functions for Simulating Liquid Water. J. Chem. Phys. 1983, 79, 926–935. [Google Scholar]
- Berendsen H. J. C.; Grigera J. R.; Straatsma T. P. The Missing Term in Effective Pair Potentials. J. Phys. Chem. 1987, 91, 6269–6271. [Google Scholar]
- Mahoney M. W.; Jorgensen W. L. A Five-Site Model for Liquid Water and the Reproduction of the Density Anomaly by Rigid, Nonpolarizable Potential Functions. J. Chem. Phys. 2000, 112, 8910–8922. [Google Scholar]
- Horn H. W.; Swope W. C.; Pitera J. W.; Madura J. D.; Dick T. J.; Hura G. L.; Head-Gordon T. Development of an Improved Four-Site Water Model for Biomolecular Simulations: TIP4P-Ew. J. Chem. Phys. 2004, 120, 9665–9678. [DOI] [PubMed] [Google Scholar]
- Bratko D.; Blum L.; Luzar A. A Simple Model for the Intermolecular Potential of Water. J. Chem. Phys. 1985, 83, 6367–6370. [Google Scholar]
- Liu Y.; Ichiye T. Soft Sticky Dipole Potential for Liquid Water:? A New Model. J. Phys. Chem. 1996, 100, 2723–2730. [Google Scholar]
- Ichiye T.; Tan M. L. Soft Sticky Dipole–Quadrupole–Octupole Potential Energy Function for Liquid Water: An Approximate Moment Expansion. J. Chem. Phys. 2006, 124, 134504+. [DOI] [PubMed] [Google Scholar]
- Te J. A.; Ichiye T. Understanding Structural Effects of Multipole Moments on Aqueous Solvation of Ions Using the Soft-Sticky Dipole–Quadrupole–Octupole Water Model. Chem. Phys. Lett. 2010, 499, 219–225. [DOI] [PMC free article] [PubMed] [Google Scholar]
- Wang L. P.; Martinez T. J.; Pande V. S. Building Force Fields: An Automatic, Systematic, and Reproducible Approach. J. Phys. Chem. Lett. 2014, 5, 1885–1891. [DOI] [PMC free article] [PubMed] [Google Scholar]
- Fuentes-Azcatl R.; Alejandre J. Non-Polarizable Force Field of Water Based on the Dielectric Constant: TIP4P/ϵ. J. Phys. Chem. B 2014, 118, 1263–1272. [DOI] [PubMed] [Google Scholar]
- Wang L.-P.; Head-Gordon T.; Ponder J. W.; Ren P.; Chodera J. D.; Eastman P. K.; Martinez T. J.; Pande V. S. Systematic Improvement of a Classical Molecular Model of Water. J. Phys. Chem. B 2013, 117, 9956–9972. [DOI] [PMC free article] [PubMed] [Google Scholar]
- Fennell C. J.; Li L.; Dill K. A. Simple Liquid Models with Corrected Dielectric Constants. J. Phys. Chem. B 2012, 116, 6936–6944. [DOI] [PMC free article] [PubMed] [Google Scholar]
- Akin-Ojo O.; Wang F. The Quest for the Best Nonpolarizable Water Model from the Adaptive Force Matching Method. J. Comput. Chem. 2011, 32, 453–462. [DOI] [PubMed] [Google Scholar]
- Mark P.; Nilsson L. Structure and Dynamics of the TIP3P, SPC, and SPC/E Water Models at 298 K. J. Phys. Chem. A 2001, 105, 9954–9960. [Google Scholar]
- Wu Y.; Tepper H. L.; Voth G. A. Flexible Simple Point-Charge Water Model with Improved Liquid-State Properties. J. Chem. Phys. 2006, 124, 024503+. [DOI] [PubMed] [Google Scholar]
- Mobley D. L.; Bayly C. I.; Cooper M. D.; Shirts M. R.; Dill K. A. Small Molecule Hydration Free Energies in Explicit Solvent: An Extensive Test of Fixed-Charge Atomistic Simulations. J. Chem. Theor. Comput. 2009, 5, 350–358. [DOI] [PMC free article] [PubMed] [Google Scholar]
- Gilson M. K.; Zhou H. X. Calculation of protein-ligand binding affinities. Annu. Rev. Biophys. Biomol. Struct. 2007, 36, 21–42. [DOI] [PubMed] [Google Scholar]
- Anandakrishnan R.; Baker C.; Izadi S.; Onufriev A. V. Point Charges Optimally Placed to Represent the Multipole Expansion of Charge Distributions. PLoS One 2013, 8, e67715. [DOI] [PMC free article] [PubMed] [Google Scholar]
- Marechal Y.The Hydrogen Bond and the Water Molecule: The Physics and Chemistry of Water, Aqueous and Bio Media; Elsevier: Oxford, U.K., 2007. [Google Scholar]
- Mecke R.; Baumann W. Das Rotationschwingungsspektrum des Wasserdampfes. Z. Phys. 1932, 33, 883. [Google Scholar]
- Bernal J. D.; Fowler R. H. A Theory of Water and Ionic Solution, with Particular Reference to Hydrogen and Hydroxyl Ions. J. Chem. Phys. 1933, 1, 515–548. [Google Scholar]
- Stöbener K.; Klein P.; Reiser S.; Horsch M.; Küfer K.-H.; Hasse H. Multicriteria Optimization of Molecular Force Fields by Pareto Approach. Fluid Phase Equilib. 2014, 373, 100–108. [Google Scholar]
- Hülsmann M.; Vrabec J.; Maaß A.; Reith D. Assessment of Numerical Optimization Algorithms for the Development of Molecular Models. Comput. Phys. Commun. 2010, 181, 887–905. [Google Scholar]
- Avendaño C.; Lafitte T.; Adjiman C. S.; Galindo A.; Müller E. A.; Jackson G. SAFT-γ Force Field for the Simulation of Molecular Fluids: 2. Coarse-Grained Models of Greenhouse Gases, Refrigerants, and Long Alkanes. J. Phys. Chem. B 2013, 117, 2717–2733PMID: 23311931.. [DOI] [PubMed] [Google Scholar]
- Morokuma K. Why Do Molecules Interact? The Origin of Electron Donor–Acceptor Complexes, Hydrogen Bonding and Proton Affinity. Acc. Chem. Res. 1977, 10, 294–300. [Google Scholar]
- Jackson J.Classical Electrodynamics, 3rd ed.; J. Wiley & Sons: New York, 1999. [Google Scholar]
- Stone A.The Theory of Intermolecular Forces; International Series of Monographs on Chemistry; Clarendon Press: Oxford, U.K., 1997. [Google Scholar]
- Kramer C.; Spinn A.; Liedl K. R. Charge Anisotropy: Where Atomic Multipoles Matter Most. J. Chem. Theory Comput. 2014, 10, 4488–4496. [DOI] [PubMed] [Google Scholar]
- Niu S.; Tan M. L.; Ichiye T. The Large Quadrupole of Water Molecules. J. Chem. Phys. 2011, 134, 134501+. [DOI] [PMC free article] [PubMed] [Google Scholar]
- Rusnak A. J.; Pinnick E. R.; Calderon C. E.; Wang F. Static Dielectric Constants and Molecular Dipole Distributions of Liquid Water and Ice-Ih Investigated by the PAW-PBE Exchange-Correlation Functional. J. Chem. Phys. 2012, 137, –. [DOI] [PubMed] [Google Scholar]
- Abascal J. L. F.; Vega C. The Water Forcefield: Importance of Dipolar and Quadrupolar Interactions. J. Phys. Chem. C 2007, 111, 15811–15822. [Google Scholar]
- Barnes P.; Finney J. L.; Nicholas J. D.; Quinn J. E. Cooperative Effects in Simulated Water. Nature 1979, 282, 459–464. [Google Scholar]
- Watanabe K.; Klein M. L. Effective Pair Potentials and the Properties of Water. Chem. Phys. 1989, 131, 157–167. [Google Scholar]
- Mukhopadhyay A.; Fenley A. T.; Tolokh I. S.; Onufriev A. V. Charge Hydration Asymmetry: The Basic Principle and How to Use It to Test and Improve Water Models. J. Phys. Chem. B 2012, 116, 9776–9783. [DOI] [PMC free article] [PubMed] [Google Scholar]
- Mukhopadhyay A.; Aguilar B. H.; Tolokh I. S.; Onufriev A. V. Introducing Charge Hydration Asymmetry into the Generalized Born Model. J. Chem. Theor. Comput. 2014, 10, 1788–1794. [DOI] [PMC free article] [PubMed] [Google Scholar]
- Coutinho K.; Guedes R.; Cabral B. C.; Canuto S. Electronic Polarization of Liquid Water: Converged Monte Carlo–Quantum Mechanics Results for the Multipole Moments. Chem. Phys. Lett. 2003, 369, 345–353. [Google Scholar]
- Rick S. W. A Reoptimization of the Five-Site Water Potential (TIP5P) for Use with Ewald Sums. J. Chem. Phys. 2004, 120, 6085–6093. [DOI] [PubMed] [Google Scholar]
- Gregory J. K.; Clary D. C.; Liu K.; Brown M. G.; Saykally R. J. The Water Dipole Moment in Water Clusters. Science 1997, 275, 814–817. [DOI] [PubMed] [Google Scholar]
- Site L. D.; Alavi A.; Lynden-Bell R. M. The Electrostatic Properties of Water Molecules in Condensed Phases: An Ab Initio Study. Mol. Phys. 1999, 96, 1683–1693. [Google Scholar]
- Silvestrelli P. L.; Parrinello M. Structural, Electronic, and Bonding Properties of Liquid Water from First Principles. J. Chem. Phys. 1999, 111, 3572–3580. [Google Scholar]
- Skinner L. B.; Huang C.; Schlesinger D.; Pettersson L. G. M.; Nilsson A.; Benmore C. J. Benchmark Oxygen–Oxygen Pair-Distribution Function of Ambient Water from X-Ray Diffraction Measurements with a Wide Q-Range. J. Chem. Phys. 2013, 138, 074506. [DOI] [PubMed] [Google Scholar]
- Vega C.; Abascal J. L. F. Simulating Water with Rigid Non-Polarizable Models: A General Perspective. Phys. Chem. Chem. Phys. 2011, 13, 19663–19688. [DOI] [PubMed] [Google Scholar]
- Vega C.; Abascal J. L. F.; Conde M. M.; Aragones J. L. What Ice Can Teach Us about Water Interactions: A Critical Comparison of the Performance of Different Water Models. Faraday Discuss. 2009, 141, 251–276. [DOI] [PubMed] [Google Scholar]
- Mobley D. L.; Barber A. E.; Fennell C. J.; Dill K. A. Charge Asymmetries in Hydration of Polar Solutes. J. Phys. Chem. B 2008, 112, 2405–2414. [DOI] [PMC free article] [PubMed] [Google Scholar]
- Rajamani S.; Ghosh T.; Garde S. Size Dependent Ion Hydration, Its Asymmetry, and Convergence to Macroscopic Behavior. J. Chem. Phys. 2004, 120, 4457–4466. [DOI] [PubMed] [Google Scholar]
- Schmid R.; Miah A. M.; Sapunov V. N. A New Table of the Thermodynamic Quantities of Ionic Hydration: Values and Some Applications (Enthalpy–Entropy Compensation and Born Radii). Phys. Chem. Chem. Phys. 2000, 2, 97–102. [Google Scholar]
- Abascal J. L. F.; Vega C. A General Purpose Model for the Condensed Phases of Water: TIP4P/2005. J. Chem. Phys. 2005, 123, 234505+. [DOI] [PubMed] [Google Scholar]
- Jorgensen W. L.; Jenson C. Temperature Dependence of TIP3P, SPC, and TIP4P Water from NPT Monte Carlo Simulations: Seeking Temperatures of Maximum Density. J. Comput. Chem. 1998, 19, 1179–1186. [Google Scholar]
- English * N. J. Molecular Dynamics Simulations of Liquid Water Using Various Long-Range Electrostatics Techniques. Mol. Phys. 2005, 103, 1945–1960. [Google Scholar]
- Jorgensen W. L.; Tirado-Rives J. Potential Energy Functions for Atomic-Level Simulations of Water and Organic and Biomolecular Systems. Proc. Natl. Acad. Sci. U. S. A. 2005, 102, 6665–6670. [DOI] [PMC free article] [PubMed] [Google Scholar]
- Case D. A.; Cheatham T. E.; Darden T.; Gohlke H.; Luo R.; Merz K. M.; Onufriev A.; Simmerling C.; Wang B.; Woods R. J. The Amber Biomolecular Simulation Programs. J. Comput. Chem. 2005, 26, 1668–1688. [DOI] [PMC free article] [PubMed] [Google Scholar]
- Pronk S.; Pll S.; Schulz R.; Larsson P.; Bjelkmar P.; Apostolov R.; Shirts M. R.; Smith J. C.; Kasson P. M.; van der Spoel D.; et al. GROMACS 4.5: A High-Throughput and Highly Parallel Open Source Molecular Simulation Toolkit. Bioinformatics 2013, 29, 845–854. [DOI] [PMC free article] [PubMed] [Google Scholar]
- Wang J.; Wolf R. M.; Caldwell J. W.; Kollman P. A.; Case D. A. Development and Testing of a General Amber Force Field. J. Comput. Chem. 2004, 25, 1157–1174. [DOI] [PubMed] [Google Scholar]
Associated Data
This section collects any data citations, data availability statements, or supplementary materials included in this article.