

Abstract
Breast cancer is the second leading cause of death by cancer in women. To identify biomarkers with potential diagnostic and therapeutic utilities in breast cancer, gene expression profiling from real patient tissues was used to discover significantly deregulated genes out of 50,739 genes of human transcriptome. Total RNAs were extracted, and the gene expression profiles of 32 cancerous and normal tissues were established using Agilent gene expression microarray technology. The results were analyzed with Agilent GeneSpring 12.6 software. Here we provide detailed experimental methods and analysis for the microarray data, which have been deposited into Gene Expression Omnibus (GEO) under GSE57297.
Keywords: Breast cancer, Microarray, Agilent SurePrint G3, Gene expression profiling
| Specifications | |
|---|---|
| Organism/cell line/tissue | Homo sapiens |
| Sex | Female |
| Sequencer or array type | Agilent SurePrint G3 Human Gene Expression v2 8 × 60K Microarray |
| Data format | Raw data: TAR. Normalized data: SOFT, MINiML, TXT. |
| Experimental factors | Gene expression profiling in breast cancer tissues vs. normal controls |
| Experimental features | Thirty-two human breast tissues of three different breast cancer subtypes (including Luminal A, Luminal B, Triple negative) and normal controls were examined with Agilent microarray technology for gene expression profiling. The breast cancer subtypes were determined by pathology report of positive or negative status of ER, PR and HER2. |
| Consent | All patients consented before starting the study. |
| Sample source location | Clinical and Translational Science Institute (CTSI), University of Florida, Gainesville, Florida, United States. |
Direct link to deposited data
Experimental design, materials and methods
Tissue samples
Tissue samples were acquired from the Clinical and Translational Science Institute (CTSI) at University of Florida, covering three subtypes of breast cancer (Luminal A, Luminal B, Triple negative) [1], [2] as well as matched or unmatched normal tissue samples. All the human tissue samples were stored at − 80 °C before use.
RNA preparation
Total RNA was isolated and purified from frozen tissue samples using RNeasy Lipid Tissue Mini Kit and RNase-Free DNase Set (Qiagen, Chatsworth, CA) according to manufacturer's protocols. The quality of total RNA was strictly controlled by several parameters. The RNA extracts were first analyzed by Nanodrop 2000 (Thermo Fisher Scientific, Waltham, MA) and gel electrophoresis. RNA quality was determined by the A260/A280 ratio (close to 2), A260/A230 (close to 2), and the presence of two distinct ribosomal bands on gel electrophoresis. Qualified RNAs were further tested using Agilent 2100 Bioanalyzer (Agilent Technologies, Santa Clara, CA), and samples with 28S/18S RNA ratio > 1 were selected for gene expression profiling [3]. Thirty-two samples were finally tested, among which two samples C501 (Luminal A) and N513 (normal) were from the same patient, others are unmatched samples.
RNA labeling and hybridization
Cyanine-3 (Cy3) labeled cRNA was prepared from 100 ng RNA using the One-Color Low Input Quick Amp labeling kit (Agilent, Valencia, CA) according to manufacturer's instructions, followed by RNeasy Mini Kit (Qiagen, Valencia, CA) purification. Dye incorporation and cRNA yield were checked with the NanoDrop Spectrophotometer (NanoDrop Technologies, Inc.).
RNA hybridization
For hybridization, 0.6 μg of Cy3-labeled cRNA [4] (specific activity > 8 pmol Cy3/μg cRNA) was fragmented at 60 °C for 30 min in a reaction volume of 25 μL containing 1× Agilent fragmentation buffer and 2 × Agilent blocking agent following manufacturers ' instructions. On completion of the fragmentation reaction, 25 μL of 2× Agilent hybridization buffer was added to the fragmentation mixture and hybridized to Agilent Whole Human Genome Oligo Microarrays (GPL17077) for 17 h at 65 °C in a rotating Agilent hybridization oven.
Microarray scanning
After hybridization, microarrays were washed for 1 min at room temperature with GE Wash Buffer 1 (Agilent) and 1 min with 37 °C GE Wash buffer 2 (Agilent), then dried using Agilent stabilization and drying solution. Slides were scanned immediately after washing on the Agilent DNA Microarray Scanner (G2505C) using one color scan setting for 1 × 60k array slides (Scan Area 61 × 21 mm, Scan resolution 3 μM, Dye channel is set to Green and Green PMT is set to 100%) [5].
Data normalization and quality control
The raw signals were log transformed and normalized using the Percentile shift normalization method, the value was set at 75th percentile (Agilent GeneSpring 12.6 manual, 22.2.1, P584) [6]. For each probe, the median of the log summarized values from all the samples was calculated and subtracted from each of the samples to get transformed baseline. The parameter values for experimental grouping were set as Luminal A, Luminal B, Triple negative, and Normal.
Probes with normalized intensity values below 20th percentile were filtered out using the “Filter probe sets by Expression” option. This resulted in 42,875 genes, which were further filtered to exclude probes with standard deviation < 1 in all groups, resulting in 16,822 genes.
Differential expression
Volcano plots, representing the distribution of the fold changes and p-values (obtained from moderated t-test [7]) of the above 16,822 genes, were shown in Fig. 1 corresponding to each subgroup (Luminal A, Luminal B, and Triple negative). The moderated t-test is one of the statistical tests provided by the GeneSpring 12.6 software as a modification of the unpaired t-test (Agilent GeneSpring 12.6 manual, 22.3.7, P589).
Fig. 1.
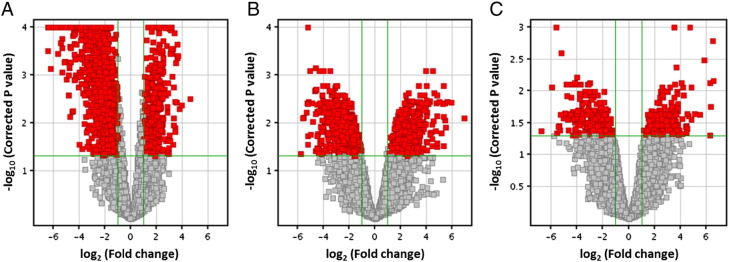
Volcano plots showing the distribution of the gene expression fold changes in each subgroup (A) Luminal A, (B) Luminal B, and (C) Triple negative compared with normal controls. Genes with absolute fold change ≥ 2 and p-value ≤ 0.05 are indicated in red. Plots are generated using GeneSpring 12.6 with moderated t-test and Benjamini –Hochberg testing correction.
Furthermore, 779 genes were identified with p-value ≤ 0.05 (One-Way ANOVA with asymptotic computation and Benjamin–Hochberg multiple testing corrections) and fold change ≥ 2 [8], [9] in all three breast cancer subtypes. The heat map for these 779 genes is shown in Fig. 2.
Fig. 2.

Heat map showing different expression pattern of 779 genes out of 50,739 biological probes after one-way ANOVA test with a corrected p-value < 0.05 and fold change ≥ 2 in all three breast cancer subtypes using GeneSpring 12.6 software. The heat map indicates up-regulation (red), down-regulation (green), and mean gene expression (black). The columns represent individual tissue samples covering three breast cancer subtypes: Luminal A (red), Luminal B (yellow), and Triple negative (purple) as well as normal samples (blue). The rows represent individual genes.
Conclusion
Herein we described the gene regulation information for breast cancer gene profiling using Agilent SurePrint G3 Human Gene Expression Microarray technology. Our gene expression microarray data provided an important resource for exploring and identifying gene biomarkers involved in breast cancer.
Disclosures
The authors declare no conflicts of interest.
Acknowledgments
This work was supported by grants from the UF Interdisciplinary Center for Biotechnology Research (ICBR) Agilent Microarray Program Award to XQ, American Cancer Society Chris DiMarco Institutional Research Grant to XQ and in part by the NIH/NCATS Clinical and Translational Science Award to the University of Florida UL1 TR00064 to XQ.
References
- 1.Liedtke C., Kiesel L. Breast cancer molecular subtypes — modern therapeutic concepts for targeted therapy of a heterogeneous entity. Maturitas. 2012;73(4):288–294. doi: 10.1016/j.maturitas.2012.08.006. [DOI] [PubMed] [Google Scholar]
- 2.Carey L.A., Perou C.M., Livasy C.A., Dressler L.G., Cowan D., Conway K., Karaca G., Troester M.A., Tse C.K., Edmiston S., Deming S.L., Geradts J., Cheang M.C., Nielsen T.O., Moorman P.G., Earp H.S., Millikan R.C. Race, breast cancer subtypes, and survival in the Carolina breast cancer study. JAMA. 2006;295(21):2492–2502. doi: 10.1001/jama.295.21.2492. [DOI] [PubMed] [Google Scholar]
- 3.Stan A.D., Ghose S., Gao X.M., Roberts R.C., Lewis-Amezcua K., Hatanpaa K.J., Tamminga C.A. Human postmortem tissue: what quality markers matter? Brain Res. 2006;1123:1–11. doi: 10.1016/j.brainres.2006.09.025. [DOI] [PMC free article] [PubMed] [Google Scholar]
- 4.Ares M., Jr. Preparation of fluorescent-dye-labeled cDNA from RNA for microarray hybridization. Cold Spring Harb. Protoc. 2014;2014(1):119–123. doi: 10.1101/pdb.prot080127. [DOI] [PubMed] [Google Scholar]
- 5.Ares M., Jr. Scanning microarray slides. Cold Spring Harb. Protoc. 2014;2014(2):214–218. doi: 10.1101/pdb.prot080481. [DOI] [PubMed] [Google Scholar]
- 6.Yang Y.H., Dudoit S., Luu P., Lin D.M., Peng V., Ngai J., Speed T.P. Normalization for cDNA microarray data: a robust composite method addressing single and multiple slide systematic variation. Nucleic Acids Res. 2002;30(4):e15. doi: 10.1093/nar/30.4.e15. [DOI] [PMC free article] [PubMed] [Google Scholar]
- 7.Smyth G.K. Linear models and empirical Bayes methods for assessing differential expression in microarray experiments. Stat. Appl. Genet. Mol. Biol. 2004;3 doi: 10.2202/1544-6115.1027. (Article3) [DOI] [PubMed] [Google Scholar]
- 8.Brazma A., Vilo J. Gene expression data analysis. FEBS Lett. 2000;480(1):17–24. doi: 10.1016/s0014-5793(00)01772-5. [DOI] [PubMed] [Google Scholar]
- 9.Steinhoff C., Vingron M. Normalization and quantification of differential expression in gene expression microarrays. Brief. Bioinform. 2006;7(2):166–177. doi: 10.1093/bib/bbl002. [DOI] [PubMed] [Google Scholar]