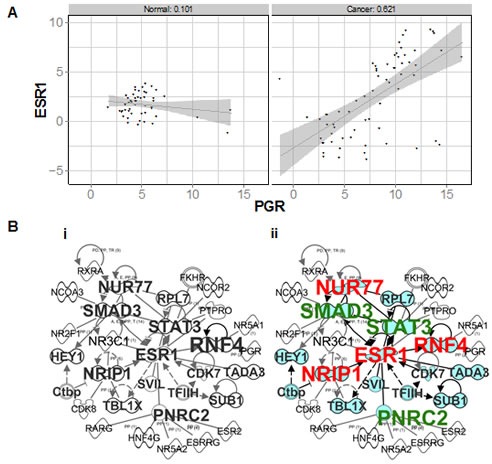
Figure 5. ER and PR transcripts and correlated networks in an independent cohort of normal and breast cancer samples.

A Scatter plot of ΔCt values obtained for ER (ESR1) and PR (PGR) in normal breast vs cancer samples profiled on TLDAs. B Merged ER and PR correlated networks in (i) normal, and (ii) breast cancers. Genes which also correlate with ER are shaded in blue. Also indicated are genes which are activated (red) or inhibited (green) by E.
