

SAT III RNA binds to the kinetochore component CENP-C and is required for correct assembly and function of the kinetochore at centromeres.
Abstract
Chromosome segregation requires centromeres on every sister chromatid to correctly form and attach the microtubule spindle during cell division. Even though centromeres are essential for genome stability, the underlying centromeric DNA is highly variable in sequence and evolves quickly. Epigenetic mechanisms are therefore thought to regulate centromeres. Here, we show that the 359-bp repeat satellite III (SAT III), which spans megabases on the X chromosome of Drosophila melanogaster, produces a long noncoding RNA that localizes to centromeric regions of all major chromosomes. Depletion of SAT III RNA causes mitotic defects, not only of the sex chromosome but also in trans of all autosomes. We furthermore find that SAT III RNA binds to the kinetochore component CENP-C, and is required for correct localization of the centromere-defining proteins CENP-A and CENP-C, as well as outer kinetochore proteins. In conclusion, our data reveal that SAT III RNA is an integral part of centromere identity, adding RNA to the complex epigenetic mark at centromeres in flies.
Introduction
Centromeres are the regions of chromosomes that serve as the foundation for kinetochore formation and chromosome attachment to the mitotic spindle during cell division. Even though their function is evolutionary highly conserved, centromeres are not defined by the underlying DNA sequence; rather, their identity is established epigenetically. CENP-A (also known as CID in Drosophila melanogaster) is a key epigenetic determinant of centromere identity (Allshire and Karpen, 2008). Depletion of this protein from cells results in the inability of chromosomes to segregate properly (Carroll and Straight, 2006). Overexpression of CENP-A leads to the formation of ectopic centromeres and mislocalization of kinetochore proteins (Ahmad and Henikoff, 2002; Heun et al., 2006; Moreno-Moreno et al., 2006; Mendiburo et al., 2011; Olszak et al., 2011). In contrast to canonical histones that are deposited into chromatin in a replication-dependent manner (Mello and Almouzni, 2001), newly synthesized CENP-A is deposited during the subsequent mitosis, in telophase and G1 in human cells (Jansen et al., 2007), during metaphase in D. melanogaster S2 cells (Mellone et al., 2011), and anaphase in the syncytial D. melanogaster embryos (Schuh et al., 2007).
Many mechanisms and factors of CENP-A regulation and deposition in flies have been identified (Allshire and Karpen, 2008; Erhardt et al., 2008; Orr et al., 2010; Bade et al., 2014; Chen et al., 2014; Mathew et al., 2014), but emerging observations from other organisms suggest that noncoding RNAs may also be involved in centromere regulation (Chen et al., 2003; Topp et al., 2004; Bouzinba-Segard et al., 2006; Wong et al., 2007; Ohkuni and Kitagawa, 2011). A hallmark of centromeric DNA in most organisms is its heterochromatic surrounding, often referred to as centromeric and pericentromeric heterochromatin, built from repetitive sequences called satellite repeats (Carroll and Straight, 2006). Importantly, transcription of repetitive sequences results in RNA products in many species. Maize centromeric repeats called CentC are transcribed from both strands, yielding transcripts that are up to 900 bp long. These transcripts immunoprecipitate with the maize CENP-A orthologue CENH3 (Topp et al., 2004). Minor repeats located on mouse centromeres produce transcripts up to 4 kb long, and may function in centromeric regulation during stress response (Bouzinba-Segard et al., 2006). Finally, CENP-C and INCENP localization to centromeric regions is RNase sensitive, and can partially be restored by adding recombinant α satellite RNA (Wong et al., 2007). The precise function of these transcripts, however, remains to be elucidated.
Every D. melanogaster centromere contains a unique set of satellites, mostly simple 5–12-bp-long repeats (Abad et al., 1992; Lohe et al., 1993; Lamb and Birchler, 2003). Only the centromere of chromosome X contains a complex satellite repeat, called satellite III (SAT III), also known as 359-bp satellite (Lohe et al., 1993; Sun et al., 2003; Blattes et al., 2006). SAT III belongs to the 1.688 satellite DNA family; members of this family are also found on other loci throughout the genome but with significant sequence variation (Kuhn et al., 2012).
SAT III covers several megabase pairs of the acrocentric X chromosome with a 359-bp-long repeating unit (Lohe et al., 1993). Usakin et al. (2007) reported transcription from both SAT III strands in flies; however, unlike other members of the 1.688 satellite class (260-bp, 353-bp, and 356-bp repeats) that are located on pericentromeric chromatin, SAT III does not play a role in heterochromatin formation, and its function has not been identified up to now.
Here, we investigated a role of D. melanogaster SAT III RNA in centromere regulation. We show that the SAT III region from the X chromosome produces a long noncoding RNA that localizes to centromeric chromatin not only of the X chromosome but also of autosomes during mitosis. Depletion of SAT III RNA leads to mitotic defects in S2 cells and embryos, and missegregation of all major chromosomes, which is most likely caused by the observed reduction of centromeric and kinetochore proteins during mitosis. We furthermore identified an interaction of SAT III RNA with the inner kinetochore protein CENP-C, and their mutual dependence for centromeric localization. Therefore, we propose that the repetitive centromeric SAT III RNA is an integral part of centromere identity in D. melanogaster that influences centromere regulation epigenetically.
Results
SAT III is transcribed and associates with chromatin throughout the cell cycle
Centromeres are embedded in large blocks of repetitive sequences in many different organisms, and many of them are transcribed (Allshire and Karpen, 2008). Our goal was to examine whether the transcription of highly repetitive elements is important for normal centromere function in Drosophila. We tested the transcription levels of different repetitive elements that are located near centromeres by RT-PCR and found that the X chromosome–specific SAT III RNA is expressed in cultured S2 cells. We used primers that specifically amplify one repeating unit (359 bp) of SAT III (Fig. 1 A). To determine the size of the complete SAT III RNA, we performed 3′ rapid amplification of cDNA ends (RACE) by adding an adapter primer at the poly(A) tail of RNA molecule. 3′ RACE analysis produced a ladder of bands corresponding to different numbers or fragments of the 359-bp repeating units. The biggest band produced in this assay was ∼1.3-kb long (Fig. 1 B). We conclude that SAT III is transcribed in S2 cells, similar to what has been reported in the D. melanogaster germline and embryos (Usakin et al., 2007; Salvany et al., 2009), and that this region forms long polyadenylated products consisting of up to ∼4 repeating units.
Figure 1.

SAT III is transcribed and localizes to mitotic centromeres. (A) RT-PCR using primers that amplify one repeating unit of SAT III produces a 359-bp product. Ctrl, control RT-PCR reaction with no reverse transcription. (B) SAT III 3′ RACE amplified transcripts consisting of multiple repeats of the 359-bp basic unit, resulting in a series of bands. Ctrl, control reaction with no reverse transcription. (C) S2 cells in interphase display one major cluster of SAT III RNA (green) within the nucleus in close proximity to centromeric clusters (labeled with CENP-C in red). Cells were counterstained with DAPI to visualize DNA (blue). Bars, 10 µm. (D) SAT III RNA localization on metaphase chromosome spreads. SAT III RNA localizes to centromeric region of chromosomes X, 2, and 3 but is not detected on the small chromosome 4. Bars, 5 µm. (E) SAT III RNA localization patterns. The bottom panels show intensity profiles of the indicated cross sections in the images (white lines). Based on the intensity profiles of SAT III RNA and CENP-C signal, the localization is characterized as overlapping (21.2%), partially overlapping (48.5%), or not overlapping (30.3%) of analyzed chromosomes (n = 33). The colocalization was measured on a single z stack.
To address the subcellular localization of SAT III RNA in S2 cells, we performed RNA FISH with a fluorescently labeled SAT III probe. The specificity of the SAT III probe was validated by DNA FISH on metaphase chromosome spreads from S2 cells, showing the signal exclusively at the proximal heterochromatic DNA of the X chromosome, where SAT III repeats are located (Lohe et al., 1993; Blattes et al., 2006; Fig. S1 A). RNA FISH revealed that SAT III RNA accumulates in one or two discrete spots in the nucleus of interphase cells. To determine the subnuclear localization of SAT III RNA, we combined RNA FISH with immunofluorescence (IF) of the constitutive inner kinetochore protein CENP-C. In interphase, CENP-C is found in 3–5 clusters of centromeric regions, and we usually detected SAT III RNA in one cluster close to CENP-C (Fig. 1 C). In metaphase cells, SAT III RNA staining was dispersed into smaller dots with some signal again in close proximity to CENP-C (Fig. S1 B). To identify the precise localization of SAT III RNA during mitosis, we performed RNA FISH on metaphase chromosome spreads from S2 cells. A strong SAT III RNA signal was detected in proximity to centromeric chromatin (Fig. 1 D). The SAT III RNA staining varied from an overlapping signal with the inner kinetochore proteins CENP-C to a more distant but still centromeric staining to a pericentromeric signal that was usually found enriched on only one side of the kinetochore (Fig. 1, D and E). The distance of the nonoverlapping SAT III RNA and CENP-C signals varied from 0.13 to 0.64 µm, with a mean of 0.26 µm. Importantly, we did not only detect SAT III RNA on the acrocentric heterochromatin of chromosome X, where SAT III transcripts originate from, but also on centromeric regions of the two major autosomes (chromosomes 2 and 3; Fig. 1 D). The consistent observation that only a portion of all chromosomes stain for SAT III RNA confirms that we do not detect cross reactivity with other satellite sequences on autosomes. Instead, specific binding of SAT III RNA seems sequence independent but prefers binding to centric and pericentric heterochromatin. The very small heterochromatic chromosome 4 did not show any detectable levels of SAT III RNA. Collectively, SAT III RNA localizes to the nucleus throughout the cell cycle and is mostly associated with pericentromeric and centromeric chromatin of different chromosomes during mitosis.
SAT III RNA is required for correct mitotic chromosome segregation
To analyze the potential role of SAT III transcripts in centromere function, we initially overexpressed one 359-bp repeating unit of SAT III in S2 cells (Fig. S2, A and B). SAT III–overexpressing cells looked healthy, without any obvious defects in morphology and cell cycle progression. Cell division was comparable with the mock-transfected control, which suggested that an increased amount of SAT III RNA does not interfere with the viability or chromosome segregation of D. melanogaster cultured cells. Next we wanted to reduce the levels of SAT III RNA present in cells and analyze the effects on cell division. RNA interference using double-stranded RNA (dsRNA) was not successful, probably because of the nuclear localization of SAT III RNA. Therefore, we turned to a knockdown approach using locked nucleic acid (LNA) gapmers, which degrade RNA in an RNase H–dependent manner (Kauppinen et al., 2005). Two LNA gapmers were used in combination, one that targets the anti-sense (SAT III–LNA1) transcript, and one that targets the sense (SAT III–LNA2) transcript. qPCR showed that SAT III RNA levels were reduced by ∼60% in comparison to scrambled LNA and mock control (Fig. S2 C). To track knockdown cells, fluorescein-labeled dextran was cotransfected (Valencia et al., 2008; Shen et al., 2013). Depletion of SAT III transcripts caused severe mitotic defects with lagging chromosomes in anaphase cells, which were unable to segregate their chromosomes properly (Fig. 2, A and B). To confirm that the observed phenotype is specific to SAT III knockdown, and not to potential off-target genes, we used an alternative set of LNA gapmers that resulted in similar mitotic errors, including lagging chromosomes in anaphase cells (Fig. S3, A and B), which is consistent with our results obtained with SAT III–LNA1 plus SAT III–LNA2 probes (Fig. 2 B).
Figure 2.

SAT III knockdown causes severe mitotic defects. (A) Cells transfected with SAT III–LNA probes targeting sense and antisense transcripts show severe mitotic defects with lagging chromosomes, whereas untreated cells or control cells transfected with scrambled LNA segregate properly. Cells were cotransfected with fluorescein-labeled dextran for selection of transfected cells. (B) Quantification of the properly dividing cells after SAT III depletion. Properly dividing cells in mock-transfected control (n = 104) were normalized to 1, and compared with scrambled LNA transfected (n = 49) and SAT III–LNA1 and LNA2 transfected cells (n = 115). (C) Live cell analysis of SAT III–depleted cells. S2 cells expressing GFP-labeled histone H2B and tubulin labeled with mCherry were transfected with SAT III–LNA probes, or with scrambled RNA (control). SAT III knockdown cells showed prolonged anaphase with lagging chromosomes that eventually formed micronuclei at the end of mitosis. (D) Quantification of properly dividing cells in C after SAT III depletion. Normal cell division in scrambled LNA transfected control (n = 18) was normalized to 1, and compared with SAT III–LNA1 and –LNA2 transfected cells (n = 24). (E) SAT III depletion causes severe mitotic defects in developing D. melanogaster embryos. Embryos from w1118 flies were injected with scrambled control LNA probes or SAT III–specific probes. SAT III–depleted embryos formed anaphase bridges, and were unable to segregate chromosomes properly. (F) Zhr1 embryos display mitotic defects. All Zhr1 pre-gastrulation embryos in mitosis (n = 20) displayed major chromosome segregation defects, whereas control embryos (Oregon-R) divided normally (n = 16). The arrows indicate anaphase figures with chromosome bridges in preblastoderm embryos and syncytial embryos as well as missegregated DNA mass at the syncytial stage. Panels on the right are enlarged from the boxed regions. Bars: (A, C, and F) 5 µm; (E, left) 10 µm; (E, right) 5 µm.
To characterize the chromosome segregation phenotype in more details, we performed live cell analysis of S2 cells expressing H2B-GFP to visualize the chromosomes, and mCherry-Tubulin to visualize the mitotic spindle (Erhardt et al., 2008). Consistent with our findings in fixed cells, cells without SAT III RNA exhibited lagging chromosomes in anaphase; 43% of the cells with lagging chromosomes subsequently formed micronuclei. Formation of micronuclei was never observed in control cells that were treated with scrambled LNA (Fig. 2, C and D; and Videos 1 and 2). The observed lagging chromosome phenotype in live cells was less penetrant than in fixed S2 cells; however, here we could not cotransfect the cells with fluorescently labeled dextran, and therefore could not distinguish between LNA-transfected and untransfected cells. Additionally, the time required for anaphase completion varied drastically between 6 and 20 min in SAT III–depleted cells (with a mean of 12.1 min), whereas properly segregating control cells transfected with scrambled LNA gamers consistently required 6–7 min from metaphase plate–aligned chromosomes to anaphase completion (with a mean of 6.3 min).
Previous work showed that both strands of SAT III are transcribed (Usakin et al., 2007). To investigate which of the two SAT III transcripts is responsible for the observed phenotypes, we performed SAT III RNA knockdown in S2 cells using LNA gapmers against either the sense or the antisense transcript only. We observed mitotic defects with either gapmer, but these defects were more pronounced when both strands were depleted simultaneously (Fig. S3, C and E). This suggests that both sense and antisense transcripts of SAT III are important for correct chromosome segregation.
Repetitive sequences build the vast majority of constitutive heterochromatin (He et al., 2012). The SAT III DNA region of the X chromosome has been directly linked to embryonic female hybrid lethality between Drosophila simulans females and D. melanogaster males caused by a failure to segregate their chromosomes correctly (Ferree and Barbash, 2009). The authors suggested that the heterochromatin formation is affected in these hybrid crosses. To investigate whether the mitotic defects in SAT III RNA-depleted cells are caused by a disruption of heterochromatin, we tested levels of Heterochromatin Protein 1 (HP1) and histone H3 dimethylation on lysine 9 (H3K9me2) in mitotic cells. Most HP1 protein typically dissociates from chromosomes during mitosis in an H3 serine 10 phosphorylated manner (Fischle et al., 2005; Hirota et al., 2005). However, it is important to point out that S2 cells maintain a significant amount of HP1α during mitosis (Fig. S4, A–E; Olszak et al., 2011). We tested two independent HP1α antibodies and detected pericentromeric HP1α signal during mitosis. The antibody specificity was tested by HP1α RNAi depletion. The HP1α signals were highly reduced in HP1 RNAi-treated cells in mitosis as tested by IF (Fig. S4 D) and in unsynchronized S2 cells as tested by Western blot (WB) analysis (Fig. S4 E). Furthermore, GFP-HP1α also localizes to pericentromeric regions in mitosis (Fig. S4 C). Importantly, the distribution of HP1 and H3K9me2 in SAT III–depleted cells was comparable with scrambled LNA–transfected cells (Fig. S4, A–G). We therefore conclude that SAT III RNA does not affect heterochromatin by and large, and that the segregation defects observed after SAT III depletion are not likely to be caused by a disruption of heterochromatin. We cannot, however, exclude possible subtle differences in HP1 or H3K9 methylation with our analysis.
To investigate SAT III depletion in the developing organism, we injected early stage D. melanogaster embryos (0–2 h) with SAT III LNA gapmers. Staining of the injected embryos revealed massive mitotic defects, with lagging chromosomes in anaphase, consistent with the phenotype we observed in S2 cells. In comparison, embryos injected with scrambled LNA showed regular cellular division with slight nuclear spacing abnormalities but no lagging chromosomes (Fig. 2 E). The survival rate of injected embryos was generally quite low, which is likely caused by embryo dechorionation before injection (Misquitta et al., 2008). In control, 14% (n = 266) of the embryos hatched into larvae, whereas only 8% (n = 387, P = 0.01 by t test) of embryos injected with SAT III LNA gapmers survived.
Zhr1 flies have been described to carry a translocation of the X and Y chromosome and have lost most if not all of their SAT III–containing DNA (Sawamura et al., 1993; Ferree and Barbash, 2009). We first performed qPCR to determine the amount of SAT III RNA in these Zhr1 flies and found that Oregon-R wild-type flies have >100-fold more SAT III RNA than Zhr1 adult flies (Oregon-R/Zhr1, 1:0.00837), or embryos (Oregon-R/Zhr1, 1:0.00716). Based on these results, we concluded that Zhr1 is largely devoid of SAT III. Staining of young Zhr1 embryos, ranging from preblastoderm to cellular blastoderm stage, showed strong mitotic defects with lagging chromosomes (Fig. 2 F), which is in agreement with our results in S2 cells and LNA-injected embryos. Interestingly, Zhr1 flies are viable and fertile. We did, however, notice that these flies were generally weaker than Oregon-R flies, and we detected developmental defects, such as pattern formation defects in 15% of flies, as well as a minute phenotype in 22% of Zhr1 flies (n = 200) compared with none in control Oregon-R flies (n = 100; Fig. S5 A). Collectively, we conclude that SAT III RNA is required for normal mitotic progression in S2 cells as well as in the developing embryo, and its depletion leads to massive chromosome segregation defects.
Depletion of SAT III affects segregation of all D. melanogaster chromosomes
As mentioned in the Introduction, SAT III DNA is located on the D. melanogaster X chromosome only; however, its products localize to other major chromosomes as well. We therefore wondered whether segregation of chromosome X alone is affected after SAT III RNA knockdown. To investigate the effects of SAT III depletion on individual chromosomes, we used chromosome-specific marks, which allowed us to distinguish chromosomes during anaphase. Chromosome X was identified using antibodies against acetylated lysine 16 of histone H4 (H4K16ac), which is involved in dosage compensation in flies (Conrad and Akhtar, 2012) and specifically marks the male X chromosome. Because S2 cells are derived from males (Zhang et al., 2010), all X chromosomes were stained with H4K16ac (Fig. 3 A). To distinguish chromosome 3, we used a probe specific for dodeca satellite, a CG-rich repeat in the centromeric region of chromosome 3 (Abad et al., 1992; Carmena et al., 1993; Fig. 3 B). To mark chromosome 2, we used a probe (Ferree and Barbash, 2009) that primarily binds to a large block of satellite DNA sequence on this chromosome (Fig. 3 C). When SAT III RNA was depleted, we observed lagging of all major D. melanogaster chromosomes (Fig. 3). Individual quantification of defective anaphases showed that chromosome 2 is lagging in 35%, that 33% of the affected chromosomes are labeled by chromosome 3–specific probe, and that 38% are labeled by the specific chromosome X marker. We conclude that all D. melanogaster major chromosomes are nearly equally affected by SAT III RNA knockdown, with a slight preference for the X chromosome. SAT III RNA is essential for inheritance of all D. melanogaster chromosomes and likely acts in trans, which is in line with the presence of SAT III RNA on chromosomes X, 2, and 3 during mitosis (Fig. 1 D).
Figure 3.

SAT III depletion affects segregation of all chromosomes. (A) H4K16ac is highly enriched at the X chromosome. H4K16ac localization analysis on metaphase chromosome spreads from S2 cells is shown. After SAT III depletion, lagging chromosomes were stained for H4K16ac (38%, n = 50), indicating that depletion of SAT III also affects chromosome X. (B) Dodeca satellite localizes to centromeric region of chromosome 3. Dodeca DNA FISH analysis of metaphase chromosome spreads from S2 cells is shown. After SAT III depletion, lagging chromosomes were labeled with dodeca probe (33%, n = 43), indicating that depletion of SAT III affects chromosome 3. (C) Chromosome 2 is labeled with a (AAGAG)6 satellite probe that binds to a large block of this satellite on chromosome 2. After SAT III depletion, a portion of lagging chromosomes (35%, n = 49) were labeled, indicating that depletion of SAT III affects chromosome 2. Bars, 5 µm.
SAT III RNA interacts with the inner kinetochore protein CENP-C
Chromosome segregation requires attachment of the mitotic microtubule spindle to a large protein structure called the kinetochore, which forms at centromeric regions of every chromosome (Przewloka and Glover, 2009). The inner kinetochore protein CENP-C has been shown to bind RNA in plants (Du et al., 2010) and human cells (Wong et al., 2007). Because depletion of CENP-C in D. melanogaster leads to the loss of the centromere-identifying factors CENP-A and CAL1, and as a consequence, the entire outer kinetochore complex, CENP-C is an essential factor for centromere identity in flies (Schuh et al., 2007; Erhardt et al., 2008; Milks et al., 2009; Orr et al., 2010; Przewloka et al., 2011). We tested whether SAT III RNA interacts with CENP-C by RNA-immunoprecipitation (R-IP). S2 cells were transfected with a GFP-tagged version of CENP-C, and GFP-CENP-C was immunoprecipitated using the GFP-TRAP (Rothbauer et al., 2008; Mathew et al., 2014). RNA associated with the purified protein was extracted, converted into cDNA, and analyzed by RT-PCR using SAT III–specific primers, or GFP-specific primers as negative control. Indeed, we detected SAT III RNA in the GFP-CENP-C IP, but not in the IP of GFP alone (Fig. 4 A), nor in the IP of heterochromatic protein HP1 (Fig. S4, H and I). Moreover, the control RT-PCR reaction using GFP-specific primers detected GFP mRNA in the input samples only (Fig. 4 B). We conclude from this experiment that SAT III RNA specifically associates with the centromeric protein CENP-C.
Figure 4.
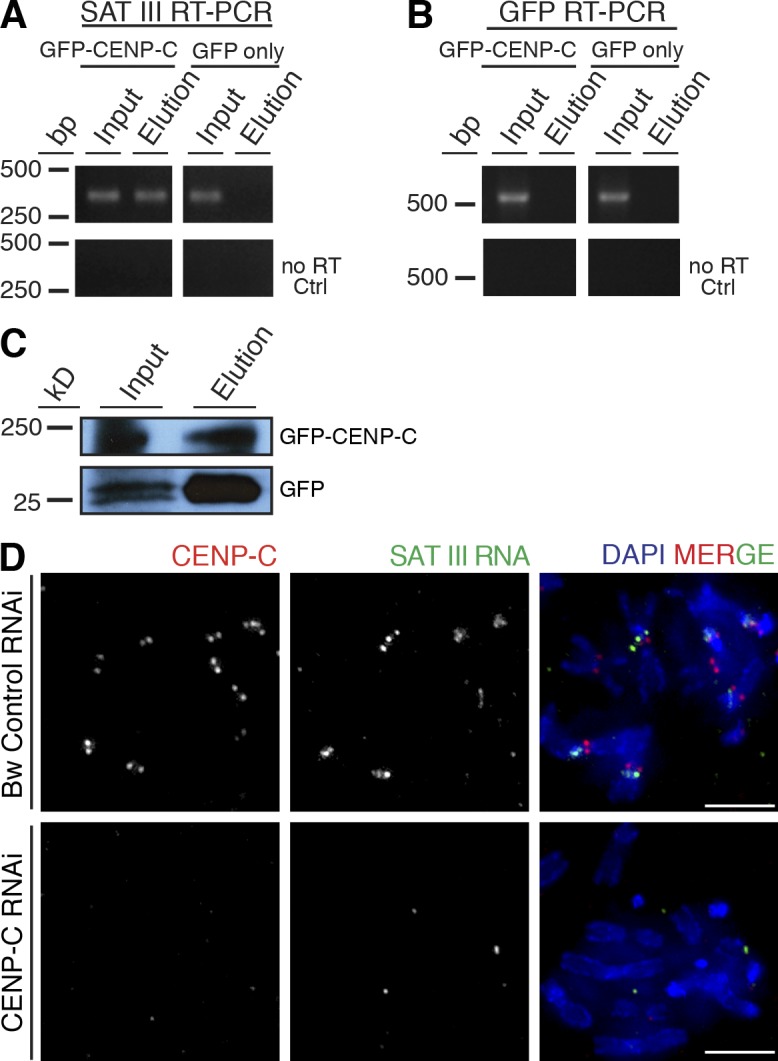
SAT III RNA coimmunoprecipitates with CENP-C. Two cell lines were used: GFP–CENP-C transfected S2 cells, or S2 cells carrying GFP-only plasmid. Total cell proteins were isolated and used for purification with GFP-TRAP. After the purification, RNA was isolated and converted to cDNA with random hexamer and oligo (dT) primers. (A) PCR with SAT III–specific primers. SAT III coimmunoprecipitates with CENP-C protein, while it is not present in GFP elution. No RT ctrl, control reaction with no reverse transcription. (B) PCR with GFP-specific primers to test whether RNA binding to CENP-C is nonspecific. GFP RNA was not present in CENP-C elution. No RT ctrl, control reaction with no reverse transcription. (C) WB analysis of GFP–CENP-C and GFP-only purification with GFP-TRAP. (D) CENP-C depletion causes SAT III mislocalization from mitotic chromosomes. Control cells were treated with brown RNAi, and show no reduction in CENP-C levels. SAT III RNA was present on all analyzed mitotic spreads (n = 23). The bottom panels show CENP-C–depleted cells with no detectable SAT III signal (57%, n = 21).
We next asked whether the interaction of SAT III RNA with CENP-C is required for SAT III RNA to localize to centromeric regions. To test this, we depleted CENP-C by RNAi and performed immuno-RNA FISH on metaphase spreads from CENP-C–depleted and control depleted (brown RNAi) cells. In CENP-C–depleted mitotic spreads, SAT III RNA was undetectable in 57% of mitotic spreads, and the remaining 43% of mitotic chromosome spreads had some residual SAT III RNA staining. However, weak CENP-C staining was also still detectable in those spreads, which indicates that CENP-C depletion was not complete in these cells. We therefore think that the loss of SAT III in 57% of these cells is probably an understatement. Control cells displayed SAT III signal on centromeric regions of all spreads analyzed (Fig. 4 D). We concluded from this experiment that CENP-C is required for SAT III RNA to localize to centromeric regions during mitosis.
SAT III knockdown reduces the levels of centromeric and kinetochore proteins
Previous reports have linked transcriptional regulation of repetitive elements (including SAT III; see the Discussion section) to changes in centromere composition in flies and human cells (Salvany et al., 2009; Chan et al., 2012). Therefore, we analyzed the levels of centromeric proteins after SAT III RNA depletion. Most of the lagging chromosomes showed CENP-A and CENP-C signals; only rarely were these factors undetectable on lagging chromosomes (Fig. 5, A and C). However, intensity analysis of CENP-A and CENP-C centromeric signals showed that levels of these proteins were significantly reduced after knockdown of SAT III RNA, which is likely a cause for the chromosomes’ segregation defects. Levels of CENP-A on lagging chromosomes were reduced to 33% (n = 38) when compared with segregating chromosomes (Fig. 5 B), and levels of CENP-C on lagging chromosomes were reduced to 55% (n = 49; Fig. 5 D).
Figure 5.

Levels of centromeric and kinetochore proteins are reduced on lagging chromosomes after SAT III depletion. (A) Lagging chromosomes after SAT III knockdown display CENP-A signals. Cells were cotransfected with fluorescein-labeled dextran to distinguish LNA-transfected from untransfected cells. (B) Quantification of centromeric CENP-A signal mean intensity of cells in A. CENP-A levels were compared from lagging and successfully segregated chromosomes. Depicted are the normalized values from three independent experiments (n = 38). Only dextran-positive cells were analyzed. The CENP-A signal intensities are significantly (P < 0.0001) decreased on the lagging chromosomes. The p-value was determined using the Student’s t test. (C) Lagging chromosomes after SAT III knockdown display CENP-C signals. Cells were cotransfected with fluorescein-labeled dextran to distinguish LNA-transfected from untransfected cells. (D) Quantification of centromeric CENP-C signal mean intensity of cells as shown in C. Depicted are the normalized values from three independent experiments (n = 49). The CENP-C signal intensities are significantly (P < 0.0001) decreased on the lagging chromosomes. (E) Lagging chromosomes after SAT III knockdown display virtually no Spc105 signals. Cells were cotransfected with fluorescein-labeled dextran to distinguish LNA-transfected from untransfected cells. (F) Quantification analysis of centromeric Spc105 signal mean intensity of cells as shown in E. Depicted are the normalized values from four independent experiments (n = 96). The Spc105 signal intensities are significantly (P < 0.0001) decreased on the lagging chromosomes. Data are mean ± SEM (error bars). The asterisks represent the p-value summary. Bars, 5 µm.
CENP-A and CENP-C serve as a base for the binding of the KMN network of proteins, which mediates the interaction between microtubules and chromosomes (Orr et al., 2010). If CENP-A and CENP-C are not stably bound or if their levels are reduced, it is likely that upstream KMN proteins are also affected in their binding capacity to the centromere during mitosis. The KMN network is composed of Spc105 protein and the MIS12 and NDC80 subcomplexes (Orr et al., 2010). Spc105 is required for loading of other kinetochore proteins (Przewloka et al., 2007; Venkei et al., 2012). We therefore tested the level of this protein after SAT III RNA knockdown. Strikingly, Spc105 was absent on most of the lagging chromosomes (74%, n = 96) after SAT III RNA depletion (Fig. 5 E). In the remaining lagging chromosomes, the intensity of Spc105 was reduced by 70% in comparison to Spc105 signals on properly segregated chromosomes (Fig. 5 F).
SAT III RNA knockdown reduces loading of newly synthesized centromeric proteins
Compared with the outer kinetochore proteins, CENP-A and CENP-C are constitutively bound to centromeres throughout the cell cycle (Erhardt et al., 2008; Mellone et al., 2011). This may be why we detected residual CENP-A and CENP-C at centromeric chromatin after SAT III RNA depletion on lagging chromosomes. To test if SAT III RNA is required for loading of newly synthesized CENP-A and CENP-C, we used stable S2 cell lines expressing either CENP-A or CENP-C fused to SNAP-tag. This tag enables the distinction between preexisting and newly synthesized proteins (Jansen et al., 2007). S2 cells expressing SNAP–CENP-A or SNAP–CENP-C were transfected with SAT III–specific LNA. After knockdown of SAT III RNA, the preexisting pool of the proteins was blocked by adding a nonfluorescent SNAP substrate. Because S2 cells divide approximately every 24 h, most cells have completed one cell cycle and incorporated newly synthesized kinetochore proteins within 1 d (Mellone et al., 2011). Cells were allowed to recover and load newly synthesized proteins for 48 h after knockdown, before SNAP-tagged proteins were labeled with a fluorescent substrate (TMR) to determine their level of incorporation into centromeres. Loading of newly synthesized CENP-A was reduced to 58% in SAT III RNA-depleted cells (Fig. 6, A and B), and CENP-C loading was reduced to 42% (Fig. 6, C and D). This result strongly suggests that SAT III transcripts are required for either correct loading of CENP-A and CENP-C to centromeric regions or for the stabilization of new proteins at centromeres. In conclusion, knockdown of SAT III RNA affects the loading and maintenance of constitutive centromeric and facultative kinetochore proteins, which causes chromosome segregation defects and genome instability.
Figure 6.

SAT III knockdown reduces levels of newly incorporated CENP-A and CENP-C at centromeres. (A) Cells stably expressing SNAP-tagged CENP-A were transfected with either SAT III–LNA or scrambled (Scrl) LNA probes as a control. After transfection, SNAP signals of preexisting proteins were irreversibly blocked and rendered undetectable for further analysis. 48 h after transfection, newly synthesized SNAP-tagged proteins were stained with TMR and imaged. Images show cells 48 h after transfection. Cells were cotransfected with fluorescein-labeled dextran to visualize transfected cells. Bars, 5 µm. (B) Quantification of the intensity of centromeric SNAP-CENP-A signal as shown in A. Centromeric intensity of SNAP–CENP-A was significantly lower (P < 0.0001) upon SAT III knockdown. Depicted are the mean values from a representative experiment (n = 200 for scrambled LNA, n = 184 for SAT III–LNA). Only dextran-positive cells were analyzed. The p-value was determined using the Student’s t test. (C) Analysis of cells carrying SNAP–CENP-C construct as in A. Cells were transfected with scrambled (Scrl) LNA as a control or with SAT III–LNA. Images show cells 48 h after transfection. Cells were cotransfected with fluorescein-labeled dextran to visualize transfected cells. Bars, 5 µm. (D) Quantification of the intensity of centromeric SNAP–CENP-C signal as shown in C. Centromeric intensity of SNAP–CENP-C was significantly lower (P < 0.0001) upon SAT III knockdown. Depicted are the mean values from a representative experiment (n = 183 for scrambled LNA, n = 195 for SAT III–LNA). Data are mean ± SEM (error bars). The asterisks represent the p-value summary.
Discussion
It is well-established that centromeric regions and their function are influenced by epigenetic mechanisms to maintain their identity throughout cell and organismal generations (Allshire and Karpen, 2008). The histone variant CENP-A has been singled out as a key player in determining centromeres in most organisms studied so far. However, diversity and differences within centromeres suggest that additional mechanisms also play a role in centromere determination. Here we provide evidence that the SAT III transcripts from a highly repetitive region of the X chromosome of D. melanogaster are important to maintain correct centromeric function, and therefore normal chromosome segregation. We show that SAT III RNA depletion causes severe chromosome segregation defects and a partial loss of essential kinetochore components that mediate the interaction with the mitotic spindle. Furthermore, we show that SAT III RNA interacts with the inner kinetochore protein CENP-C. We propose a model where SAT III RNA binds to CENP-C, which in turn is required to recruit or stabilize CENP-C and possibly CENP-C–interacting factors such as CENP-A at centromeres (Pauleau and Erhardt, 2011; Chen et al., 2014). When SAT III RNA is absent, the association of CENP-C with centromeres is destabilized or inhibited, which impairs the association of other proteins that are dependent on CENP-C for their centromeric localization. Reciprocally, in the absence of CENP-C, SAT III is absent from centromeres, which suggests an interdependence of SAT III RNA and CENP-C. CENP-C, together with CENP-A and CAL1, forms a platform for binding of KMN proteins, which are required for the attachment of chromosomes to the mitotic spindle (Pauleau and Erhardt, 2011). Therefore, we propose that as a consequence of the SAT III depletion, chromosome missegregation is caused by the destabilization of centromeric chromatin and therefore kinetochore formation during mitosis (Fig. 7).
Figure 7.

Model for a role of SAT III RNA in centromere regulation. SAT III RNA interaction with CENP-C is required to stably localize CENP-C and therefore CENP-A to centromeres. Disruption of this process by SAT III knockdown impairs a stable association of CENP-C and CENP-A with centromeres and disrupts the formation of a functional kinetochore during mitosis. This in turn results in reduced chromosomal attachment to the spindle, lagging chromosomes, and general genome instability.
SAT III is transcribed in D. melanogaster embryos and adult flies (Usakin et al., 2007; Salvany et al., 2009). Long centromeric transcripts have been identified in other species as well (Topp et al., 2004; Bouzinba-Segard et al., 2006; Wong et al., 2007). Even though we predominantly detect long SAT III transcripts, we cannot exclude the existence of smaller transcripts, as rapid centromeric transcript turnover has been described previously (Choi et al., 2011; Ohkuni and Kitagawa, 2011; Chan et al., 2012). In maize, centromeric transcripts remain bound to the kinetochore after transcription, and are thought to participate in stabilization of centromeric chromatin (Topp et al., 2004). Maize RNA binds to centromeric protein CENP-C transiently, and promotes its binding to DNA. Therefore, noncoding RNA may play a role similar to a protein chaperone. Once CENP-C is localized to centromeres, DNA binding is facilitated with the help from RNA to stabilize its position (Du et al., 2010). During interphase, SAT III RNA localizes to the nucleus, and forms a cluster in proximity to sites of centromeric clusters, perhaps at its transcription site. During mitosis, SAT III RNA is present at centromeric regions. We suggest that satellite transcripts function in stabilizing the centromeric positioning of CENP-C, thereby facilitating the building of kinetochore structures, and in turn require CENP-C to localize to centromeres. This mechanism may be evolutionarily conserved, as CENP-C has been described to bind RNA from centromeric repeats in maize (Du et al., 2010). In addition to SAT III RNA present at centromeres, some SAT III RNA is also detectable at pericentromeres of mitotic chromosomes and is non-chromatin-associated (Fig. 1, D and E; and Fig. S1 B). SAT III RNA that is present at pericentromeres might also contribute to overall kinetochore structure, and signals distant from chromatin might represent distinct ribonucleoprotein particles. However, additional work is required to address these questions.
Depletion of SAT III RNA in S2 cells caused severe mitotic defects, which indicates that SAT III RNA is crucial for cell division. The same phenotype was observed in vivo in D. melanogaster embryos. Importantly, we found that flies carrying an X-Y translocation chromosome that has lost most of its SAT III DNA block (Sawamura et al., 1993) do not transcribe any significant amount of SAT III RNA, and display segregation defects in early embryos similar to what we described for S2 cells and SAT III LNA gapmer-injected embryos. Most of the Zhr1 flies are viable and fertile despite the segregation defects in early embryos. We therefore suggest that SAT III RNA function is only one part of a larger safeguard mechanism required for accurate chromosome segregation during mitosis.
Ferree and Barbash (2009) showed that Zhr1 male flies rescue the female hybrid lethality in crosses between D. simulans females and D. melanogaster males. One of their hypotheses was that RNA originating from SAT III might be the cause of hybrid lethality in F1 daughters originating from these crosses. We show here that Zhr1 flies do not have any SAT III transcripts, which indicates a possible incompatibility of SAT III RNA from wild-type D. melanogaster flies with either transcripts or the sequence of the X chromosome of D. simulans. However, this and other possibilities need to be tested in the future.
A previous study showed that transcription of SAT III depends on the homeobox-containing transcription factor Hth, and mutations of hth lead to abnormal distribution of CENP-A (Salvany et al., 2009). Similarly, inhibition of transcription during mitosis resulted in a decreased level of centromeric α-satellite transcripts in human cells, which in turn resulted in lagging chromosomes and a reduction of CENP-C (Chan et al., 2012). Inhibition of transcription or mutations of transcription factors may, however, cause pleiotropic effects in cells; together with the results presented from a direct depletion of SAT III transcripts, we can conclude that the SAT III RNA directly influences centromere function and that satellite transcripts may have a conserved function in kinetochore formation.
The inability of chromosomes to segregate properly in the absence of SAT III RNA is not restricted to chromosome X, the origin of SAT III transcripts. This indicates a trans-acting mechanism, as seen in dosage compensation (Wutz, 2003) and proposed for maize centromeric RNA (Du et al., 2010). Du et al. (2010) suggest that each centromere is capable of producing RNA. Indeed, in D. melanogaster, we observe active centromeric transcription by RNA polymerase II on all chromosomes (Fig. S5 B). This indicates that centromeric RNAs might have redundant functions, similar to what is described for the dosage compensation complex in Drosophila. Here, roX1 and roX2 RNA are required for spreading of the compensasome to the entire X chromosome. These two RNAs are redundant in their function, even though they have little sequence similarity (Meller and Rattner, 2002). The presence of redundant RNAs may also explain why the majority of chromosomes usually segregate correctly upon SAT III RNA depletion, and why only some chromosomes are lagging.
We showed here that SAT III RNA function is independent of heterochromatin formation (Fig. S4, A and B). In support of this, Usakin et al. (2007) reported that many D. melanogaster pericentromeric transcripts participate in heterochromatin formation, but SAT III transcripts were not among the RNAs that had an effect on the formation of centromeric heterochromatin. The observed heterochromatin defects in hth mutant embryos (Salvany et al., 2009) are, therefore, possibly caused by additional effects of depleting this transcription factor. Pericentromeric heterochromatin is required for sister chromatid cohesion and bipolar orientation during mitosis (Yamagishi et al., 2008; Sakuno et al., 2009). However, the levels of cohesion proteins (Fig. S5, C–E), as well as the heterochromatin markers HP1 and H3 lysine 9 methylation (Fig. S4), are unaffected in SAT III–depleted cells. We therefore conclude that the observed chromosome segregation defects after SAT III depletion are unlikely to be caused by a loss of sister chromatid cohesion or heterochromatin integrity.
Levels of centromeric and kinetochore proteins were significantly reduced on mitotic chromosomes that failed to segregate properly in the absence of SAT III RNA, which implies a role of SAT III RNA in providing a competent centromere environment. Additionally, reducing the levels of CENP-C by RNAi caused a complete loss of SAT III from centromeres, which suggests that CENP-C and SAT III RNA are mutually dependent on each other for their centromeric localization. Because loading of CENP-C and CENP-A is mutually dependent as well (Erhardt et a., 2008), both proteins are reduced in the absence of SAT III, as expected (Fig. 5). Spc105 is an essential component of Drosophila kinetochores; its localization is interdependent with MIS12 complex localization and required for localization of the NDC80 subcomplex, which directly binds microtubules (Przewloka et al., 2007; Venkei et al., 2012). Hence, reduction of Spc105 protein at centromeres leads to severe defects in constructing a functional kinetochore, and provides an explanation for failures in chromosome segregation in the absence of SAT III RNA (Fig. 5 E). Finally, our SNAP tag experiments (Fig. 6) showed that loading of newly synthesized CENP-A and CENP-C proteins is also affected by the loss of SAT III, which suggests that SAT III plays an integral role in establishing and stabilizing centromeric chromatin. In conclusion, we identified SAT III RNA as an epigenetic factor involved in centromere regulation and function through interaction with the centromeric protein CENP-C, which suggests a vital and evolutionarily conserved role of noncoding RNAs in centromere determination and chromosome segregation.
Materials and methods
Gene constructs
All standard molecular biology techniques were performed as described by Sambrook and Russell (2001). Constructs created for this study were cloned into AscI and PacI sites of the pCopia–localization and purification (LAP) vector with a basal expression Copia promoter and an N-terminal EGFP tag (Erhardt et al., 2008). For overexpression studies, SAT III was cloned into KpnI (forward primer) and NotI (reverse primer) sites of the pAc5.1/V5-His C plasmid (Invitrogen). Plasmids encoding CENP-A or CENP-C tagged with an N-terminal SNAP tag have been described previously (Mellone et al., 2011). The genes were under control of the Copia promoter, and cloned using AscI and PacI restriction enzymes.
Transfection of S2 cells with plasmids, dsRNA, or LNA probes
S2 cells were grown and maintained, as described previously (Bade et al., 2014), under sterile conditions at 25°C in Schneider medium containing 10% heat-inactivated fetal bovine serum and 100 µg/ml penicillin-streptomycin. For R-IP experiments, cells were grown in suspension culture with the addition of 4 U/ml heparin and 0.05% Synperonic. For transfection, actively dividing cells of 106 cells/ml density were seeded into 25-cm2 flasks 2 d before transfection. Transfection was performed using Cellfectin II (Life Technologies) according to the manufacturer’s instructions with 5 µg of desired plasmid, or 100 nM of LNAs in total. Dextran was used in a concentration of 30 µg/ml. To create stable cell lines, 5 µg of pCopia-Hygro vector was added, and the selection process with 250 µg/ml Hygromycin B was started 2 d after transfection. dsRNA was made using the MEGAscript kit (Ambion) according to the manufacturer’s instructions. RNAi was performed using DOTAP liposomal transfection reagent (Roche) according to manufacturer’s instructions with 5 µg of dsRNA or by soaking of 13 µg CENP-C or Brown dsRNA as reported previously (Erhardt et al., 2008). In brief, one million actively dividing cells were plated in 1 ml of serum-free medium and dsRNA was added. After 1 h of incubation, 1.5 ml of fresh serum-containing medium (SM) was added to the cells. Cells were analyzed 72 h after treatment.
SNAP-tag fusion protein blocking and labeling
Cells transfected with either SNAP-tagged CENP-A or CENP-C proteins were transfected with 100 nM LNA in total. Dextran was used in a concentration of 30 µg/ml. After 3.5 h, cells were collected and pelleted by centrifugation at 800 g for 3 min. The medium was removed, and cells were resuspended in 100 µl of fresh SM containing SNAP-Cell Block (1:200; New England Biolabs, Inc.), according to manufacturer’s instructions. After 30 min of incubation (25°C, 400 rpm), cells were pelleted and the medium was replaced with 1 ml of fresh SM, then incubated for 30 min (25°C, 400 rpm). Cells were washed two more times in SM, then plated in 6-well plates.
48 h after transfection, cells were collected and pelleted (800 g, 3 min), and medium was replaced with 100 µl of SM containing 4 µM SNAP-Cell TMR-Star (New England Biolabs, Inc.). After 15 min of incubation (25°C, 400 rpm), the cells were pelleted and the medium was replaced with 1 ml fresh SM, then incubated for 30 min, at 25°C, 400 rpm, to allow unreacted TMR-Star to diffuse out of the cells. Cells were washed three more times in SM, and one final time in PBS, then prepared for imaging. Cells were settled on a positively charged glass slide for 10 min, fixed with 4% PFA for 10 min, washed three times in PBS with 0.1% Triton-X (PBST), and counterstained with DAPI before mounting.
Indirect IF on S2 cells and mitotic spreads
IF was essentially performed as described previously (Erhardt et al., 2008). 100–200 µl of exponentially growing cells were harvested (3 min, 1,000 g) and washed once in PBS. The pellet was resolved in 100 µl PBS, and cells were settled on a positively charged glass slide for 10 min before fixation with 4% PFA for 10 min. Fixed cells were washed twice in PBS and permeabilized for 5 min with PBS supplemented with 0.5% Triton X-100. Unspecific binding was prevented by blocking the cells for 0.5–1 h with 1% BSA in PBS. Primary antibodies diluted in blocking solution were incubated for 1 h at RT. After three washes with PBS for 5 min each, cells were incubated with the corresponding, fluorescently labeled secondary antibodies (diluted in blocking solution) for 1 h at RT. The secondary antibody incubation and all the following steps were performed while protected from light. After three washes in PBS, DNA was stained for 5 min with DAPI (1 µg/ml in PBS). The cells were then washed two more times with PBS before mounting them in Aqua/Polymount medium, and covered with a glass coverslip of 1.5 mm thickness. The slides were stored at 4°C until imaging.
Preparation of mitotic chromosome spreads
Mitotic chromosome spreads were essentially performed as described previously (Mathew et al., 2014). To obtain mitotic chromosomes, 2 × 10⁵ exponentially growing cells were arrested in mitosis with 2.5 µg/µl Colcemid for 1 h, centrifuged for 10 min at 1,000 g, resuspended in 0.5 ml hypotonic sodium citrate solution (0.5% Na-citrate in ddH2O), and incubated for 8–10 min. 500 µl of swelled cells were spun on positively charged slides in a cytocentrifuge (Shandon 4 Cytospin; Thermo Fisher Scientific) at 900 rpm for 10 min. Mitotic chromosome spreads were fixed with 4% PFA for 10 min and subsequently treated for IF.
Image acquisition and quantification
Microscopy was performed on a DeltaVision Core system (Applied Precision) using softWoRx v.5.5 suite (Applied Precision) and a charge-coupled device camera (CoolSNAP HQ2; Photometrics). Images were acquired with 100× UPlan-SApochromat (NA 1.4; Olympus) or 60× Plan-Apochromat N (NA 1.42; Olympus) objective lenses with a binning of 1 × 1 or 2 × 2. Images were taken as z stacks, with 0.3 µm interval distance. For live cell imaging, 250 µl of exponentially growing cells in SM were placed into a sterile 8-well-chambered slide (Ibidi). Cells were imaged at 25°C with the following settings: 12 µm in z, 0.2–0.3 µm stack interval distance, binning 1 × 1, with a time lapse of 2 min until the end of cell division.
Image processing
All images were deconvolved and projected (maximum intensity) using the softWoRx v.5.5 suite. Deconvolution was performed with the following settings: Ratio (conservative), 10 cycles (for settled cells) or Additive, 5 cycles (for mitotic chromosomes). The distances between SAT III RNA and CENP-C signals were measured using the softWoRx v.5.5 suite, and the distance between the closest points was measured.
For live cell imaging, images were equalized before quick projection, using time point 3 as a reference. The acquired images were processed and analyzed using ImageJ software. The brightness and contrast of the images were adjusted using Photoshop software (Adobe).
Only cells cotransfected with dextran were considered for the quantification. To determine the intensity of centromeric dots, we used the ImageJ plug-ins DoG spot enhancer and ROI particle analyzer, developed by the Nikon Imaging Center (University of Heidelberg; Bade et al., 2014). Final graphs were plotted using GraphPad Prism software. The significance (p-value) was determined using a Student’s t test.
For colocalization analysis, a single z stack was used for every mitotic spread. Intensity profiles were made using an RGB profile tool for ImageJ from the ZMBH Imaging Facility.
RT-PCR
RNA was isolated using the PureLink RNA Mini kit (Ambion), according to the manufacturer’s instructions. Reverse transcription of RNA (1 µl) was performed using the combination of oligo (dT) and random hexamer primers in equal proportions. A control reaction with no reverse transcription was always performed in parallel. RT reaction was followed by PCR with primers specific for transcript of interest, according to Usakin et al. (2007).
Quantitative RT-PCR
RT-qPCR was performed after cDNA synthesis on a LightCycler 480 (Roche) using ABsolute qPCR SYBR Green Mix (Thermo Fisher Scientific) or LightCycler 480 SYBR Green I Master (Roche). All reactions were run in triplicate in a LightCycler 480 multiwell plate. Actin was used as a reference. The level of SAT III in the control mock-treated sample was normalized to 1, and compared with the SAT III–depleted samples.
3′ RACE
3′ RACE was performed using the FirstChoice RLM-RACE kit (Ambion). 1 µl total RNA of S2 cells was used for reverse transcription with oligo (dT) bound to the 3′ RACE adapter. The cDNA was subjected to PCR using a primer complementary to the adapter and the SAT III forward primer.
Injection and IF on D. melanogaster embryos
For injections, ∼30-min-old embryos from w1118 flies were dechorionated by 1.5 min of treatment in sodium hypochlorite (1.2%). Healthy looking embryos were transferred to a glass slide, covered with halocarbon oil, and injected with either control (100 µM scrambled LNA probe) or probe (50 µM SAT III–LNA1 and SAT III–LNA2 probe, each) at 19°C. Zhr1 and OregonR embryos were collected for 2 h at 25°C and dechorionated by 2 min of treatment with sodium hypochlorite (1.2%). All embryos were stained according to the method of Vincent and O’Farrell (1992). In brief, embryos were washed off the coverslip with a stream of heptane and pipetted out together with heptane into 37% formaldehyde (1:1), shaken vigorously for 15 s, and incubated for 5 min at RT. The bottom formaldehyde phase was replaced with 500 µl of methanol. Embryos were shaken for 15 s and left to settle at the bottom of the tube for 1 min. The upper heptane layer was replaced with methanol and left at 4°C overnight (O/N). To rehydrate the embryos, embryos were washed twice with PBTA solution (0.2% Triton-X-100, 0.1% BSA, and 0.002% sodium azide), and incubated in 1 ml PBTA for 15 min at RT on a rotator. For IF staining, the embryos were blocked in PBTA solution for 30 min at RT. The primary antibodies diluted in PBTA were added to the embryos and incubated O/N at 4°C. Embryos were washed three times. Secondary antibodies were incubated for 3–4 h at RT, followed by three washes in PBTA and one wash in PBS. Embryos were counterstained with DAPI in PBS for 5 min, transferred onto a slide, and covered with mounting medium and a coverslip. The slides were stored at 4°C in the dark until imaging.
FISH analysis coupled with IF on S2 cells
For the probe, one repeating unit of SAT III blunt end PCR product was cloned into pCR-Blunt II-TOPO (pCR-SAT III) vector using a Zero Blunt TOPO PCR Cloning kit (Life Technologies). The probes were produced and labeled in a PCR reaction with ChromaTide Alexa Fluor 488–5-dUTP nucleotides (Molecular Probes), according to the manufacturer’s instructions, and used in a concentration of 100 ng/reaction. To enhance the signal, IF with α-Alexa Fluor 488 antibody was performed after hybridization. The dodeca satellite probe with 5′ Cy3 labeling was designed by Ocimum Biosolutions, according to Abad et al. (1992), and used in a concentration of 250 ng/reaction. The chromosome 2–specific probe was designed by Sigma-Aldrich, according to Ferree and Barbash (2009), and used in a concentration of 250 ng/reaction.
FISH analysis was performed either on settled S2 cells or on mitotic chromosome spreads. Cells were settled or spun down on a glass slide and fixed in 4% PFA, then washed twice in PBS for 5 min. Cells were permeabilized by washing in PBST buffer for 5 min, then washed twice in 2× saline-sodium citrate (SSC) buffer. For DNA FISH, probes were diluted in 50 µl of FISH hybridization buffer (50% formamide, 10% dextran sulfate in 2× SSC), added to the cells, and denatured at 95°C for 5 min. For RNA FISH, probes were diluted in FISH hybridization buffer and incubated at 80°C for 10 min. The probes were added to the slides with the cells and incubated at 80°C for 5 min. Hybridization was performed at 42°C O/N. Slides were washed three times in 50% formamide/2× SSC and three times in 2× SSC at 42°C. After the washes, samples were fixed with 4% PFA for 10 min.
For additional IF, slides were blocked with 4% BSA in 2× SSC and incubated with the appropriate antibodies in the same solution, then washed three times in 2× SSC. Secondary antibodies were incubated and washed in the same manner. Slides were counterstained with DAPI for 5 min and mounted.
R-IP
R-IP protocol was adapted from Durdevic et al. (2013). Cells stably expressing GFP-CENP-C, GFP-HP1, or GFP only were grown in suspension cultures. Cells were harvested by centrifugation (1,000 g, 20 min, 4°C), washed twice in ice-cold PBS, and divided into two fractions, one for RNA preparation and one for protein purification. RNA was isolated using TRIzol (Life Technologies) and RNA resuspended in RNA buffer (30 mM Hepes-KOH, pH 7.4, 150 mM NaCl, 2 mM magnesium acetate, and 0.5% NP-40 in H2O).
For protein purification, cells were resuspended in R-IP buffer (RNA buffer supplemented with 5 mM DTT, 1 mM PMSF, 2 µg/ml Aprotinin, 5 µg/ml Leupeptin, 1 µg/ml Pepstatin, and 1 µl/ml RiboLock RNase Inhibitor [Thermo Fisher Scientific]), then sonicated using a Biorupter (Diagenode; 5 cycles, 30 s sonication/30 s break). Insoluble material was removed by centrifugation (15 min, 16,000 g, 4°C). IP was performed on 150 µg of NHS-activated Sepharose (GE Healthcare) coupled GFP-TRAP (Rothbauer et al., 2008; Mathew et al., 2014). Before the protein lysate was added, beads were incubated for 10 min with R-IP buffer supplemented with 10 mM Ribonucleoside Vanadyl complex (New England Biolabs, Inc.), an RNase inhibitor. The protein lysate was added to the beads and incubated with rotation for 2 h at 4°C. After incubation, the beads were collected by centrifugation (3,000 g for 2 min) and washed four times with R-IP buffer for 10 min, rotating at 4°C. 1 ml of 2 µg/µl RNA purified from the same cells was added to the beads in R-IP buffer. Beads were incubated with RNA for 2 h, rotating at 4°C, then washed six times with R-IP buffer for 10 min, rotating at 4°C. Washed beads were divided into two aliquots, one was used for WB and the other for RNA isolation with TRIzol and RT-PCR. Before RT, DNA traces were removed using a DNA-free kit (Life Technologies).
WB analysis and quantification
Cell lysates were separated on a 12% SDS poly-acrylamide gel, transferred onto a nitrocellulose membrane for 1 h at 400 mA, and briefly stained with Ponçeau. After blocking in 5% milk in PBST, primary antibodies were incubated O/N at 4°C in the blocking solution. After washing, secondary antibodies coupled to horseradish peroxidase were added for 2 h at RT before ECL detection (Thermo Fisher Scientific).
WBs were quantified using the Quantity One software (Bio-Rad Laboratories) according to the manufacturer’s instructions (Bade et al., 2014).
Antibodies
The following primary antibodies were used: rabbit anti–Alexa Fluor 488 (1:200 IF; Molecular Probes), mouse anti–α-tubulin (1:500 IF; Sigma-Aldrich), rabbit anti–CENP-A (1:1,000 IF, from A. Straight, Stanford University, Stanford, CA), guinea pig anti–CENP-C (1:1,000 IF and 1:500 WB, from G. Karpen, Lawrence Berkeley National Laboratory and University of California, Berkeley, Berkeley, CA), mouse anti-GFP (1:500 WB; Roche), rabbit anti-H3K9me2 (1:500 IF; Abcam), rabbit anti-H3K16ac (1:500 IF; EMD Millipore), mouse anti-HP1α (1:1,000 IF; Developmental Studies Hybridoma Bank), rat anti-HP1α (1:400 IF; from F. Azorin, IRB Barcelona, Barcelona, Spain), mouse anti-RNAPIIS2 (1:200 IF; Ambion), sheep anti-Spc105 (1:1,000 IF; from D. Glover, University of Cambridge, Cambridge, England, UK), guinea pig mei-S332 (1:100 IF; from T. Orr Weaver, Whitehead Institute, Cambridge, MA), and rabbit Smc1 (1:2,000 WB; from D. Dorsett, Saint Louis University, St. Louis, MO). Secondary antibodies coupled to Alexa Fluor 488, Alexa Fluor 546, and Alexa Fluor 647 fluorophores (Molecular Probes) were used at 1:500 dilutions for IF, and horseradish peroxidase–conjugated secondary antibodies (Abcam) for WB analysis were used at 1:10,000 dilutions.
Online supplemental material
Fig. S1 shows SAT III DNA FISH on mitotic chromosome spreads and additional SAT III RNA FISH on settled, mitotic cells. Fig. S2 shows SAT III overexpression and the efficiency of depletion by LNA gapmers. Fig. S3 shows SAT III depletion with alternative LNA gapmers and the depletion of either only sense or anti-sense transcripts. Fig. S4 shows that the heterochromatin markers HP1 and histone H3 K9-dimethylation are present in mitosis and appear unaffected by SAT III depletion. Fig. S5 shows the influence of SAT III RNA on development and cohesion, and active transcription of centromeric regions during mitosis. Video 1 shows a scrambled LNA probes–transfected S2 cell expressing H2B-GFP and mCherry-tubulin that divides normally. Video 2 shows a SAT III–depleted S2 cell expressing H2B-GFP and mCherry-tubulin that displays chromosome segregation defects. Online supplemental material is available at http://www.jcb.org/cgi/content/full/jcb.201404097/DC1.
Supplementary Material
Acknowledgments
We thank the Erhardt laboratory, G. Stöcklin, and A. Teleman for discussions and comments on the manuscript; M. Portal for FISH protocol discussion; D. Glover, G. Karpen, F. Azorin, P. Verrijzen (Erasmus University, Rotterdam, Netherlands), D. Dorsett, T. Orr Weaver, R. Oliveira (Instituto Gulbenkian de Ciência, Oeiras, Portugal), and A. Straight for flies and reagents; A. Teleman and K. Weischenfeldt for embryo injections; A. Villasante for sequence information; the Nikon Imaging Center for ImageJ plugins; H. Lorenz and G. H. Sendra from the ZMBH Imaging Facility for discussions; the Developmental Studies Hybridoma Bank for HP1 antibodies developed by L. Wallrath; and the Bloomington stock center for fly lines.
We acknowledge funding from the Deutsche Forschungsgemeinschaft through the grants ER576 and EXC81 (CellNetworks) to S. Erhardt. S. Rošić is an alumna of the Hartmut Hoffmann-Berling International Graduate School of Molecular and Cellular Biology.
The authors declare no competing financial interests.
Author contributions: S. Rošić and S. Erhardt designed and analyzed data and wrote the manuscript. F. Köhler performed HP1 and H3K9me2 WB experiments, S. Erhardt performed Zhr1 experiments, and S. Rošić performed all other experiments.
Footnotes
Abbreviations used in this paper:
- dsRNA
- double-stranded RNA
- IF
- immunofluorescence
- LNA
- locked nucleic acid
- O/N
- overnight
- RACE
- rapid amplification of cDNA ends
- R-IP
- RNA-immunoprecipitation
- SAT III
- satellite III
- WB
- Western blot
References
- Abad J.P., Carmena M., Baars S., Saunders R.D., Glover D.M., Ludeña P., Sentis C., Tyler-Smith C., and Villasante A.. 1992. Dodeca satellite: a conserved G+C-rich satellite from the centromeric heterochromatin of Drosophila melanogaster. Proc. Natl. Acad. Sci. USA. 89:4663–4667 10.1073/pnas.89.10.4663 [DOI] [PMC free article] [PubMed] [Google Scholar]
- Ahmad K., and Henikoff S.. 2002. Histone H3 variants specify modes of chromatin assembly. Proc. Natl. Acad. Sci. USA. 99(Suppl 4):16477–16484 10.1073/pnas.172403699 [DOI] [PMC free article] [PubMed] [Google Scholar]
- Allshire R.C., and Karpen G.H.. 2008. Epigenetic regulation of centromeric chromatin: old dogs, new tricks? Nat. Rev. Genet. 9:923–937 10.1038/nrg2466 [DOI] [PMC free article] [PubMed] [Google Scholar]
- Bade D., Pauleau A.L., Wendler A., and Erhardt S.. 2014. The E3 ligase CUL3/RDX controls centromere maintenance by ubiquitylating and stabilizing CENP-A in a CAL1-dependent manner. Dev. Cell. 28:508–519 10.1016/j.devcel.2014.01.031 [DOI] [PubMed] [Google Scholar]
- Blattes R., Monod C., Susbielle G., Cuvier O., Wu J.H., Hsieh T.S., Laemmli U.K., and Käs E.. 2006. Displacement of D1, HP1 and topoisomerase II from satellite heterochromatin by a specific polyamide. EMBO J. 25:2397–2408 10.1038/sj.emboj.7601125 [DOI] [PMC free article] [PubMed] [Google Scholar]
- Bouzinba-Segard H., Guais A., and Francastel C.. 2006. Accumulation of small murine minor satellite transcripts leads to impaired centromeric architecture and function. Proc. Natl. Acad. Sci. USA. 103:8709–8714 10.1073/pnas.0508006103 [DOI] [PMC free article] [PubMed] [Google Scholar]
- Carmena M., Abad J.P., Villasante A., and Gonzalez C.. 1993. The Drosophila melanogaster dodecasatellite sequence is closely linked to the centromere and can form connections between sister chromatids during mitosis. J. Cell Sci. 105:41–50. [DOI] [PubMed] [Google Scholar]
- Carroll C.W., and Straight A.F.. 2006. Centromere formation: from epigenetics to self-assembly. Trends Cell Biol. 16:70–78 10.1016/j.tcb.2005.12.008 [DOI] [PubMed] [Google Scholar]
- Chan F.L., Marshall O.J., Saffery R., Kim B.W., Earle E., Choo K.H., and Wong L.H.. 2012. Active transcription and essential role of RNA polymerase II at the centromere during mitosis. Proc. Natl. Acad. Sci. USA. 109:1979–1984 10.1073/pnas.1108705109 [DOI] [PMC free article] [PubMed] [Google Scholar]
- Chen E.S., Saitoh S., Yanagida M., and Takahashi K.. 2003. A cell cycle-regulated GATA factor promotes centromeric localization of CENP-A in fission yeast. Mol. Cell. 11:175–187 10.1016/S1097-2765(03)00011-X [DOI] [PubMed] [Google Scholar]
- Chen C.C., Dechassa M.L., Bettini E., Ledoux M.B., Belisario C., Heun P., Luger K., and Mellone B.G.. 2014. CAL1 is the Drosophila CENP-A assembly factor. J. Cell Biol. 204:313–329 10.1083/jcb.201305036 [DOI] [PMC free article] [PubMed] [Google Scholar]
- Choi E.S., Strålfors A., Castillo A.G., Durand-Dubief M., Ekwall K., and Allshire R.C.. 2011. Identification of noncoding transcripts from within CENP-A chromatin at fission yeast centromeres. J. Biol. Chem. 286:23600–23607 10.1074/jbc.M111.228510 [DOI] [PMC free article] [PubMed] [Google Scholar]
- Conrad T., and Akhtar A.. 2012. Dosage compensation in Drosophila melanogaster: epigenetic fine-tuning of chromosome-wide transcription. Nat. Rev. Genet. 13:123–134 10.1038/nrg3124 [DOI] [PubMed] [Google Scholar]
- Du Y., Topp C.N., and Dawe R.K.. 2010. DNA binding of centromere protein C (CENPC) is stabilized by single-stranded RNA. PLoS Genet. 6:e1000835 10.1371/journal.pgen.1000835 [DOI] [PMC free article] [PubMed] [Google Scholar]
- Durdevic Z., Hanna K., Gold B., Pollex T., Cherry S., Lyko F., and Schaefer M.. 2013. Efficient RNA virus control in Drosophila requires the RNA methyltransferase Dnmt2. EMBO Rep. 14:269–275 10.1038/embor.2013.3 [DOI] [PMC free article] [PubMed] [Google Scholar]
- Erhardt S., Mellone B.G., Betts C.M., Zhang W., Karpen G.H., and Straight A.F.. 2008. Genome-wide analysis reveals a cell cycle-dependent mechanism controlling centromere propagation. J. Cell Biol. 183:805–818 10.1083/jcb.200806038 [DOI] [PMC free article] [PubMed] [Google Scholar]
- Ferree P.M., and Barbash D.A.. 2009. Species-specific heterochromatin prevents mitotic chromosome segregation to cause hybrid lethality in Drosophila. PLoS Biol. 7:e1000234 10.1371/journal.pbio.1000234 [DOI] [PMC free article] [PubMed] [Google Scholar]
- Fischle W., Tseng B.S., Dormann H.L., Ueberheide B.M., Garcia B.A., Shabanowitz J., Hunt D.F., Funabiki H., and Allis C.D.. 2005. Regulation of HP1-chromatin binding by histone H3 methylation and phosphorylation. Nature. 438:1116–1122 10.1038/nature04219 [DOI] [PubMed] [Google Scholar]
- He B., Caudy A., Parsons L., Rosebrock A., Pane A., Raj S., and Wieschaus E.. 2012. Mapping the pericentric heterochromatin by comparative genomic hybridization analysis and chromosome deletions in Drosophila melanogaster. Genome Res. 22:2507–2519 10.1101/gr.137406.112 [DOI] [PMC free article] [PubMed] [Google Scholar]
- Heun P., Erhardt S., Blower M.D., Weiss S., Skora A.D., and Karpen G.H.. 2006. Mislocalization of the Drosophila centromere-specific histone CID promotes formation of functional ectopic kinetochores. Dev. Cell. 10:303–315 10.1016/j.devcel.2006.01.014 [DOI] [PMC free article] [PubMed] [Google Scholar]
- Hirota T., Lipp J.J., Toh B.H., and Peters J.M.. 2005. Histone H3 serine 10 phosphorylation by Aurora B causes HP1 dissociation from heterochromatin. Nature. 438:1176–1180 10.1038/nature04254 [DOI] [PubMed] [Google Scholar]
- Jansen L.E., Black B.E., Foltz D.R., and Cleveland D.W.. 2007. Propagation of centromeric chromatin requires exit from mitosis. J. Cell Biol. 176:795–805 10.1083/jcb.200701066 [DOI] [PMC free article] [PubMed] [Google Scholar]
- Kauppinen S., Vester B., and Wengel J.. 2005. Locked nucleic acid (LNA): High affinity targeting of RNA for diagnostics and therapeutics. Drug Discov. Today. Technol. 2:287–290 10.1016/j.ddtec.2005.08.012 [DOI] [PMC free article] [PubMed] [Google Scholar]
- Kuhn G.C., Küttler H., Moreira-Filho O., and Heslop-Harrison J.S.. 2012. The 1.688 repetitive DNA of Drosophila: concerted evolution at different genomic scales and association with genes. Mol. Biol. Evol. 29:7–11 10.1093/molbev/msr173 [DOI] [PubMed] [Google Scholar]
- Lamb J.C., and Birchler J.A.. 2003. The role of DNA sequence in centromere formation. Genome Biol. 4:214 10.1186/gb-2003-4-5-214 [DOI] [PMC free article] [PubMed] [Google Scholar]
- Lohe A.R., Hilliker A.J., and Roberts P.A.. 1993. Mapping simple repeated DNA sequences in heterochromatin of Drosophila melanogaster. Genetics. 134:1149–1174. [DOI] [PMC free article] [PubMed] [Google Scholar]
- Mathew V., Pauleau A.L., Steffen N., Bergner A., Becker P.B., and Erhardt S.. 2014. The histone-fold protein CHRAC14 influences chromatin composition in response to DNA damage. Cell Reports. 7:321–330 10.1016/j.celrep.2014.03.008 [DOI] [PubMed] [Google Scholar]
- Meller V.H., and Rattner B.P.. 2002. The roX genes encode redundant male-specific lethal transcripts required for targeting of the MSL complex. EMBO J. 21:1084–1091 10.1093/emboj/21.5.1084 [DOI] [PMC free article] [PubMed] [Google Scholar]
- Mello J.A., and Almouzni G.. 2001. The ins and outs of nucleosome assembly. Curr. Opin. Genet. Dev. 11:136–141 10.1016/S0959-437X(00)00170-2 [DOI] [PubMed] [Google Scholar]
- Mellone B.G., Grive K.J., Shteyn V., Bowers S.R., Oderberg I., and Karpen G.H.. 2011. Assembly of Drosophila centromeric chromatin proteins during mitosis. PLoS Genet. 7:e1002068 10.1371/journal.pgen.1002068 [DOI] [PMC free article] [PubMed] [Google Scholar]
- Mendiburo M.J., Padeken J., Fülöp S., Schepers A., and Heun P.. 2011. Drosophila CENH3 is sufficient for centromere formation. Science. 334:686–690 10.1126/science.1206880 [DOI] [PubMed] [Google Scholar]
- Milks K.J., Moree B., and Straight A.F.. 2009. Dissection of CENP-C-directed centromere and kinetochore assembly. Mol. Biol. Cell. 20:4246–4255 10.1091/mbc.E09-05-0378 [DOI] [PMC free article] [PubMed] [Google Scholar]
- Misquitta L., Wei Q., and Paterson B.M.. 2008. Injection of dsRNA into Drosophila embryos for RNA interference (RNAi). CSH Protoc. 2008:t4918. [DOI] [PubMed] [Google Scholar]
- Moreno-Moreno O., Torras-Llort M., and Azorín F.. 2006. Proteolysis restricts localization of CID, the centromere-specific histone H3 variant of Drosophila, to centromeres. Nucleic Acids Res. 34:6247–6255 10.1093/nar/gkl902 [DOI] [PMC free article] [PubMed] [Google Scholar]
- Ohkuni K., and Kitagawa K.. 2011. Endogenous transcription at the centromere facilitates centromere activity in budding yeast. Curr. Biol. 21:1695–1703 10.1016/j.cub.2011.08.056 [DOI] [PMC free article] [PubMed] [Google Scholar]
- Olszak A.M., van Essen D., Pereira A.J., Diehl S., Manke T., Maiato H., Saccani S., and Heun P.. 2011. Heterochromatin boundaries are hotspots for de novo kinetochore formation. Nat. Cell Biol. 13:799–808 10.1038/ncb2272 [DOI] [PubMed] [Google Scholar]
- Orr B., Afonso O., Feijão T., and Sunkel C.E.. 2010. Driving chromosome segregation: lessons from the human and Drosophila centromere-kinetochore machinery. Biochem. Soc. Trans. 38:1667–1675 10.1042/BST0381667 [DOI] [PubMed] [Google Scholar]
- Pauleau A.L., and Erhardt S.. 2011. Centromere regulation: new players, new rules, new questions. Eur. J. Cell Biol. 90:805–810 10.1016/j.ejcb.2011.04.016 [DOI] [PubMed] [Google Scholar]
- Przewloka M.R., and Glover D.M.. 2009. The kinetochore and the centromere: a working long distance relationship. Annu. Rev. Genet. 43:439–465 10.1146/annurev-genet-102108-134310 [DOI] [PubMed] [Google Scholar]
- Przewloka M.R., Zhang W., Costa P., Archambault V., D’Avino P.P., Lilley K.S., Laue E.D., McAinsh A.D., and Glover D.M.. 2007. Molecular analysis of core kinetochore composition and assembly in Drosophila melanogaster. PLoS ONE. 2:e478 10.1371/journal.pone.0000478 [DOI] [PMC free article] [PubMed] [Google Scholar]
- Przewloka M.R., Venkei Z., Bolanos-Garcia V.M., Debski J., Dadlez M., and Glover D.M.. 2011. CENP-C is a structural platform for kinetochore assembly. Curr. Biol. 21:399–405 10.1016/j.cub.2011.02.005 [DOI] [PubMed] [Google Scholar]
- Rothbauer U., Zolghadr K., Muyldermans S., Schepers A., Cardoso M.C., and Leonhardt H.. 2008. A versatile nanotrap for biochemical and functional studies with fluorescent fusion proteins. Mol. Cell. Proteomics. 7:282–289 10.1074/mcp.M700342-MCP200 [DOI] [PubMed] [Google Scholar]
- Sakuno T., Tada K., and Watanabe Y.. 2009. Kinetochore geometry defined by cohesion within the centromere. Nature. 458:852–858 10.1038/nature07876 [DOI] [PubMed] [Google Scholar]
- Salvany L., Aldaz S., Corsetti E., and Azpiazu N.. 2009. A new role for hth in the early pre-blastodermic divisions in drosophila. Cell Cycle. 8:2748–2755 10.4161/cc.8.17.9388 [DOI] [PubMed] [Google Scholar]
- Sambrook J., and Russell D.W.. 2001. Directional cloning into plasmid vectors. Molecular cloning a laboratory manual. Cold Spring Harbor Laboratory Press, Cold Spring Harbor, New York: Volume 1 1.84–1.87. [Google Scholar]
- Sawamura K., Yamamoto M.T., and Watanabe T.K.. 1993. Hybrid lethal systems in the Drosophila melanogaster species complex. II. The Zygotic hybrid rescue (Zhr) gene of D. melanogaster. Genetics. 133:307–313. [DOI] [PMC free article] [PubMed] [Google Scholar]
- Schuh M., Lehner C.F., and Heidmann S.. 2007. Incorporation of Drosophila CID/CENP-A and CENP-C into centromeres during early embryonic anaphase. Curr. Biol. 17:237–243 10.1016/j.cub.2006.11.051 [DOI] [PubMed] [Google Scholar]
- Shen Y., Fang H., Zhang K., Shrestha R., Wooley K.L., and Taylor J.S.. 2013. Efficient protection and transfection of small interfering RNA by cationic shell-crosslinked knedel-like nanoparticles. Nucleic Acid Ther. 23:95–108. [DOI] [PMC free article] [PubMed] [Google Scholar]
- Sun X., Le H.D., Wahlstrom J.M., and Karpen G.H.. 2003. Sequence analysis of a functional Drosophila centromere. Genome Res. 13:182–194 10.1101/gr.681703 [DOI] [PMC free article] [PubMed] [Google Scholar]
- Topp C.N., Zhong C.X., and Dawe R.K.. 2004. Centromere-encoded RNAs are integral components of the maize kinetochore. Proc. Natl. Acad. Sci. USA. 101:15986–15991 10.1073/pnas.0407154101 [DOI] [PMC free article] [PubMed] [Google Scholar]
- Usakin L., Abad J., Vagin V.V., de Pablos B., Villasante A., and Gvozdev V.A.. 2007. Transcription of the 1.688 satellite DNA family is under the control of RNA interference machinery in Drosophila melanogaster ovaries. Genetics. 176:1343–1349 10.1534/genetics.107.071720 [DOI] [PMC free article] [PubMed] [Google Scholar]
- Valencia P., Dias A.P., and Reed R.. 2008. Splicing promotes rapid and efficient mRNA export in mammalian cells. Proc. Natl. Acad. Sci. USA. 105:3386–3391 10.1073/pnas.0800250105 [DOI] [PMC free article] [PubMed] [Google Scholar]
- Venkei Z., Przewloka M.R., Ladak Y., Albadri S., Sossick A., Juhasz G., Novák B., and Glover D.M.. 2012. Spatiotemporal dynamics of Spc105 regulates the assembly of the Drosophila kinetochore. Open Biol. 2:110032 10.1098/rsob.110032 [DOI] [PMC free article] [PubMed] [Google Scholar]
- Vincent J.P., and O’Farrell P.H.. 1992. The state of engrailed expression is not clonally transmitted during early Drosophila development. Cell. 68:923–931 10.1016/0092-8674(92)90035-B [DOI] [PMC free article] [PubMed] [Google Scholar]
- Wong L.H., Brettingham-Moore K.H., Chan L., Quach J.M., Anderson M.A., Northrop E.L., Hannan R., Saffery R., Shaw M.L., Williams E., and Choo K.H.. 2007. Centromere RNA is a key component for the assembly of nucleoproteins at the nucleolus and centromere. Genome Res. 17:1146–1160 10.1101/gr.6022807 [DOI] [PMC free article] [PubMed] [Google Scholar]
- Wutz A.2003. RNAs templating chromatin structure for dosage compensation in animals. BioEssays. 25:434–442 10.1002/bies.10274 [DOI] [PubMed] [Google Scholar]
- Yamagishi Y., Sakuno T., Shimura M., and Watanabe Y.. 2008. Heterochromatin links to centromeric protection by recruiting shugoshin. Nature. 455:251–255 10.1038/nature07217 [DOI] [PubMed] [Google Scholar]
- Zhang Y., Malone J.H., Powell S.K., Periwal V., Spana E., Macalpine D.M., and Oliver B.. 2010. Expression in aneuploid Drosophila S2 cells. PLoS Biol. 8:e1000320 10.1371/journal.pbio.1000320 [DOI] [PMC free article] [PubMed] [Google Scholar]
Associated Data
This section collects any data citations, data availability statements, or supplementary materials included in this article.