Abstract
FLT3ITD subtype acute myeloid leukemia (AML) has a poor prognosis with currently available therapies. A number of small molecule inhibitors of FLT3 and/or CDK4/6 are currently under development. A more complete and quantitative understanding of the mechanisms of actions of FLT3 and CDK4/6 inhibitors may better inform the development of current and future compounds that act on one or both of the molecular targets, and thus may lead to improved treatments for AML. In this study, we investigated in both subcutaneous and orthotopic AML mouse models, the mechanisms of action of three FLT3 and/or CDK4/6 inhibitors: AMG925 (Amgen), sorafenib (Bayer and Onyx), and quizartinib (Ambit Biosciences). A composite model was developed to integrate the plasma pharmacokinetics of these three compounds on their respective molecular targets, the coupling between the target pathways, as well as the resulting effects on tumor burden reduction in the subcutaneous xenograft model. A sequential modeling approach was used, wherein model structures and estimated parameters from upstream processes (e.g. PK, cellular signaling) were fixed for modeling subsequent downstream processes (cellular signaling, tumor burden). Pooled data analysis was employed for the plasma PK and cellular signaling modeling, while population modeling was applied to the subcutaneous and orthotopic tumor burden modeling. The resulting model allows the decomposition of the relative contributions of FLT3ITD and CDK4/6 inhibition on downstream signaling and tumor burden. In addition, the action of AMG925 on cellular signaling and tumor burden was further studied in an orthotopic tumor mouse model more closely representing the physiologically relevant environment for AML.
Keywords: FLT3 inhibitors, CDK4/6 inhibitors, acute myeloid leukemia, STAT5, Rb, subcutaneous tumor, orthotopic tumor
Introduction
Constitutively activating mutations of the growth factor receptor tyrosine kinase FLT3 (Fms-like tyrosine Kinase 3) have been identified in up to 30% of acute myeloid leukemia (AML) patients [1,2]. These mutations, which are primarily internal tandem duplication (ITD) insertions in the juxtamembrane domain of the enzyme [3], confers a poor prognosis on FLT3ITD AML patients undergoing currently available therapies [4–6]. The disrupted juxtamembrane structure leads to constitutive ligand-independent activation of the kinase, which can result in continuous activation of STAT5 (one member of the signal transducer and activator of transcription family) by phosphorylation [7]. STAT5 stimulates the transcription of anti-apoptotic genes, such as Bcl-XL, Mcl-1 and pim-1 [8–10], ultimately disrupting the cascade of events that result in cell death [11]. In addition, STAT5 is thought to participate in cell proliferation through transcriptional regulation of cyclin D1, which, together with CDK4/6, promotes the G1-S transition in the cell cycle [12]. The receptor tyrosine kinase FLT3 has emerged as a major target for the treatment for FLT3ITD AML, with a number of small molecule FLT3 inhibitors now available or under investigation [13]. Even though some of these compounds have demonstrated initial therapeutic benefits, these responses have been transient and relapse occurs within a few weeks, partially due to insufficient target coverage, activation of parallel pathways, and acquisition of resistance mutations [14].
CDK4 and CDK6 (CDK4/6) are two functionally related cyclin D dependent kinases that are involved in cell cycle regulation. Progression through the G1-S transition requires the phosphorylation of retinoblastoma (Rb) protein by CDK4/6 in complex with D-type cyclins, the activating subunits [15–18]. After phosphorylation, pRb dissociates from a group of transcription factors (E2Fs), permitting the E2Fs to stimulate transcription of their clientele of genes [11]. The products of these genes, in turn, usher the cell from late G1 into S phase. Many diverse human cancers harbor genetic events that overly activate CDK4/6 [19], and thus CDK4/6 has become a target for treating a variety of cancers including AML [20].
While FLT3 and CDK4/6 kinases have each been identified as potential molecular targets for the treatment of AML, it has been proposed that simultaneous inhibition of both FLT3ITD and CDK4/6 may lead to more durable and significant clinical responses. Because of the significant interplay between the signaling pathways engaged by inhibition of FLT3ITD and CDK4/6, as outlined above, a more complete quantitative understanding of these interacting pathways may better inform the development of current and future compounds that act on one or both of these targets, and thus may lead to improved treatments for AML.
Towards this end, we conducted a study to develop a composite signaling pathway model relating FLT3ITD and CDK4/6 inhibition to the resulting phosphorylation of STAT5 and Rb in a FLT3ITD driven AML tumor (MOLM13) xenograft mouse models (both subcutaneous and orthotopic). To quantify the pathway signaling dynamics, separate experiments with three inhibitors were conducted: the multi kinase inhibitor sorafenib (BAY43-9006, Bayer and Onyx) [21]; the relatively selective FLT3ITD inhibitor quizartinib (AC220, Ambit Biosciences) [22]; and the bifunctional FLT3ITD-CDK4/6 inhibitor AMG925 (Amgen) [23]. Compounds with CDK4/6 inhibition potency interfere with the proliferation of tumor cells. While compounds binding FLT3ITD not only inhibit cell proliferation via the inhibitory effect on FLT3ITD-pSTAT5-Cyclin D1-CDK4/6-pRb cascade, they also promote cell apoptosis by reducing pSTAT5 induced anti-apoptotic factors (e.g. Bcl-XL). The multi-kinase inhibitor sorafenib, in addition to inhibiting FLT3ITD, also inhibits Raf kinase and several other receptor tyrosine kinases, including VEGFR, PDGFR-β and c-KIT [21], which ultimately affect the level and availability of cycD1 through a cascade of reactions. In addition, the resulting signaling model was used together with the results from separate tumor MOLM13 mouse subcutaneous tumor studies with sorafenib or AMG925, to characterize the relation between phosphorylated STAT5 and Rb dynamics and tumor burden. Finally, relevant components of the signaling model developed from the MOLM13 subcutaneous tumor studies were used to develop a kinetic/signaling/tumor burden model of AMG925 from experiments involving an MOLM13 orthotopic tumor mouse model.
Methods
Pharmacokinetic studies
The plasma pharmacokinetics (PK) of AMG925 were characterized following oral administration in a MOLM13 mouse model at doses of 6.25, 12.5, 25, 37.5, or 150 mg/kg as detailed in Appendix A, Table A.1. Plasma samples were extracted with 3 volumes of 0.1% formic acid/49.95% acetonitrile/49.95% methanol (v/v/v) and analyzed using a multiple reaction method [24] using a triple quadrupole mass spectrometer with a high pressure liquid chromatography system (LC-MS/MS). Free drug concentrations were determined using a fraction unbound of 0.012, which was determined via a modified ultra-filtration method. In separate experiments, single oral dose administration of sorafenib (1, 3, or 10 mg/kg) or AC220 (0.1, 0.5, 1, or 3 mg/kg) were used to assess the plasma PK of these compounds in MOLM13 mice (see Appendix A, Table A.1 for study designs). Both sorafenib and AC220 were purchased from AdooQ BioScience (Irvine, CA). The total plasma concentrations of sorafenib or AC220 were measured using LC-MS/MS. The unbound fractions sorafenib (0.0017) and AC220 (0.0107) where used to determine the corresponding free drug concentrations. In these PK experiments, as well as other experiments described below, the care and use of animals was conducted in accordance with the regulations of the USDA Animal Welfare Act and in compliance with the testing facility’s animal welfare assurance filed with the NIH prior to the start of the studies.
Subcutaneous tumor studies
CrTac:NCR-Foxn1nu nude mice were inoculated with 7.5 million MOLM13 cells subcutaneously onto the right flank and tumors were allowed to grow for seven days until they reached an average size of 225 mm3. Mice were randomized into groups and orally administered vehicle, AMG925, sorafenib or AC220, at different doses and schedules. These MOLM13 xenograft animals were used in the PK study outlined above, as well as in the cellular signaling and tumor burden studies described below.
Cellular signaling
In the studies designed to characterize signaling dynamics, the inhibitors AMG925, sorafenib or AC220 were separately administered to a second group of MOLM13 mice at the same doses as used in the PK studies. Mice were sacrificed at the post dose times listed in Appendix A, Table A.2, and tumors were immediately dissected and snap frozen in liquid nitrogen. Lysates were prepared and analyzed for STAT5Y694 phosphorylation and RbS780 phosphorylation using MSD (Meso Scale Discovery) assays, which were then normalized to total STAT5 and p38MAPK values to produce the values of phosphorylated STAT5 (pSTAT5) and of phosphorylated Rb (pRb).
Tumor burden
A third group of MOLM13 tumor bearing mice were orally administered vehicle, AMG925 or sorafenib following the doses and schedules listed in Appendix A, Table A.3 (tumor burden experiments with AC220 were not conducted as part of the original study design). At the times noted in Table A.3, tumor size was assessed by two-dimensional caliper measurements (width – W and length – L), and tumor volumes were estimated as W2 · L · 0.5. Body weights were monitored over the course of the experiments (216 or 240 hours) as an assessment of animal health in response to treatments.
Orthotopic tumor studies
A FLT3ITD driven AML orthotopic tumor model was developed to more closely mimic human AML. MOLM13 tumor cells were transfected with the lentivirus vector pLV218G-Luc, which expresses luciferase (transduction procedure developed in-house) NOD SCID IL-2γR−/− mice were injected with 50,000 MOLM13-Luc cells by tail vein injection in both cellular signaling and tumor burden studies.
Cellular signaling
In the assessments of the effect of AMG925 on STAT5Y694 and RbS780 phosphorylation in the bone marrow tumor cells, MOLM13-Luc cells were allowed 14 days to engraft and the mice were then randomized into groups and orally administered AMG925 at different doses and schedules (see study design details in Appendix A, Table A.4). At each measurement time, mice were sacrificed and femurs were harvested, fixed in formalin, decalcified in EDTA and embedded in paraffin. Blocks of the embedded femur were then stained by immunohistochemistry for STAT5Y694 and RbS780. Ten 40X fields of 200 MOLM13-Luc tumor cells were then counted for the presence of positive staining nuclei.
Tumor burden
In studies of the effects of AMG925 on the growth of MOLM13-Luc tumors,. MOLM13-Luc cells were allowed 6 days to engraft and then mice were randomized into groups and orally dosed with vehicle, AMG925 at different doses and schedules (see study design details in Appendix A, Table A.5). Tumor burden was quantified by acquiring the whole body dorsal and ventral images at nine and 11 minutes, respectively, after intraperitoneal administration of luciferin (150mg/Kg). Bioluminescence images were acquired by the IVIS Imaging System Series 200 and tumor burden was quantified using Living Image software (Caliper Life Sciences).
Modeling
Pharmacokinetics
Models considered for characterizing the plasma pharmacokinetics of AMG925, sorafenib and AC220, included first-order absorption, one and two compartment models with linear elimination or Michaelis-Menten elimination. For each compound, all the data from the different doses and study designs were pooled and the maximum likelihood estimates for the different models were calculated using the NPD program in ADAPT (Version 5) [25] (proportional and additive error variance). Model selection was based on the AIC values, standard errors of estimated parameters, as well as on the plausibility of the parameter estimates. Since no plasma samples were obtained during the absorption phases of these inhibitors, the absorption rate constants were fixed as follows based on previous studies: 3 hr−1 for sorafenib [21], and 1.4 hr−1 for AC220 [22].
Subcutaneous tumor cellular signaling
A model for the pathways was developed by co-modeling the action of the three inhibitors AMG925, sorafenib and AC220 on pSTAT5 and pRb. This multiple-input approach exploits the complimentary information that these inhibitors elicit from the different mechanisms of action of these three compounds, and jointly allows estimation of the pathway dynamics that would otherwise be non-identifiable using data from the compounds individually (see [26] and [27]). Figure 1 illustrates the model used for the signaling pathway and actions of the three compounds. Studies have shown that STAT5 and Rb are directly phosphorylated by FLT3ITD and CDK4/6 [11,7]. Thus, pSTAT5 and pRb are used as biomarkers for the activities of FLT3ITD and CDK4/6, respectively. By binding to FLT3ITD, AMG925, sorafenib and AC220 modulate the phosphorylation rate of STAT5, which in turn modulates the phosphorylation of Rb. AMG925 also alters pRb production rate through its direct binding with CDK4/6. Sorafenib also influences cycD1 transcription by inhibiting the activities of kinases other than FLT3 ITD, which ultimately affect the production rate of pRb.
Figure 1.
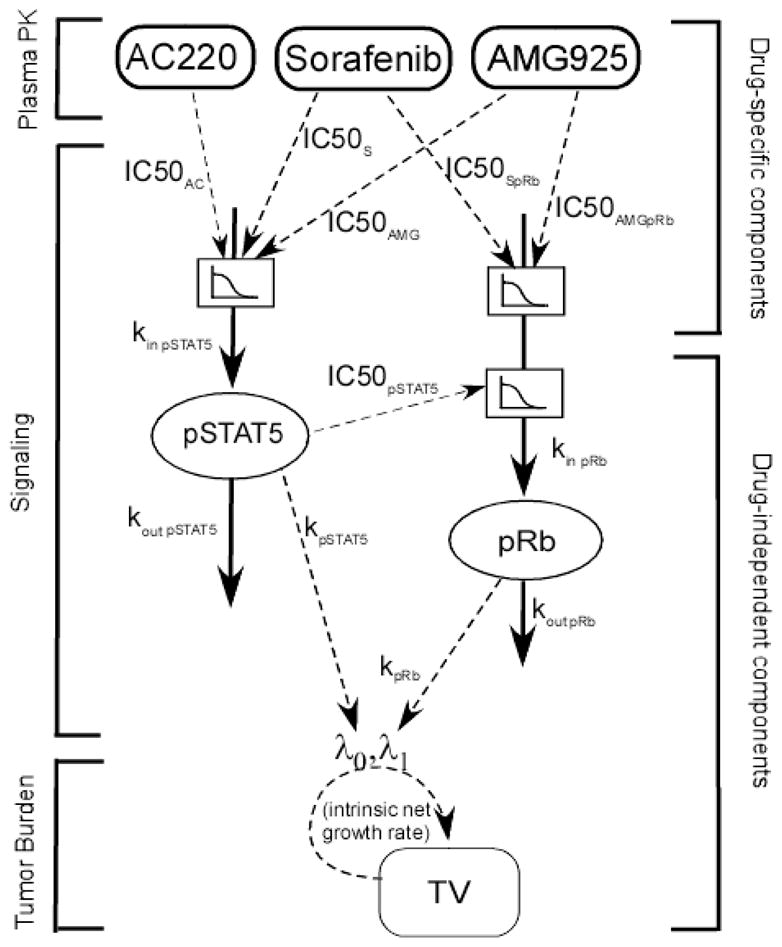
Plasma PK- cellular signaling- tumor burden modeling scheme. AMG925, sorafenib and AC220 inhibit STAT5 phosphorylation via inhibiting FLT3ITD. AMG925 inhibits Rb phosphorylation by directly targeting CDK4/6, and sorafenib also influences the activity of cycD1·CDK4/6 via inhibitory effects on other receptors and/or kinases, including VEGFR, PDGFR-β, c-KIT and etc. The decreased pSTAT5 values not only promote apoptosis in tumor cells, but also hinder the proliferation of tumor cells. In the modeling analysis, PK parameters were fixed at values in Table 1 during parameter estimation of cellular signaling models, and cellular signaling model parameters were fixed at estimates in Table 2 (Subcutaneous tumor studies) or Table 4 (Orthotopic tumor studies) while estimating parameters of the tumor burden models.
The following equations describe the proposed cellular signaling model linking plasma PK of the three compounds to the alteration of molecular targets pSTAT5 and pRb:
- AMG925:
(1) (2) - Sorafenib:
(3) (4) - AC220:
(5) (6)
In the above equations, kin pSTAT5 is the zero-order production rate of pSTAT5, while kout pSTAT5 is the first-order turnover rate of pSTAT5. These two system-specific parameters depend on the intrinsic properties of MOLM13 cell line, and are independent of the administered compounds. Under the assumption that the concentration of pSTAT5 returns to its basal value when the inhibitor is cleared, kin pSTAT5 can be estimated as kout pSTAT5 · pSTAT5(0), where pSTAT5(0) is the baseline level of pSTAT5. Under corresponding assumptions, the pRb zero-order production rate kin pRb can be estimated as kout pRb · pRb(0), where kout pRb is the first-order turnover rate of pRb and pRb(0) is its baseline level. Also in the above equations, CAMG, CS and CAC denote the plasma concentrations of AMG925, sorafenib and AC220. The parameters IC50AMG, IC50S and IC50AC represent the plasma concentrations of AMG925, sorafenib and AC220 that elicit half of maximal inhibition of pSTAT5 production. The parameters IC50AMGpRb and IC50SpRb are the plasma concentrations of AMG925 and sorafenib that elicit half of maximal inhibition of pRb production via direct binding to CDK4/6 for AMG925 or to targets other than FLT3ITD (such as RAF kinase, VEGFR receptor and etc) for sorafenib. The parameter IC50pSTAT5 is the inhibition fraction of pSTAT5 to achieve half of maximal inhibition of pRb production. In Eqs. (2), (4) and (6), InbpSTAT5 = (pSTAT5(0) − pSTAT5)/pSTAT5(0). The pooled data from all of the studies with the three compounds were used to obtain the maximum likelihood estimates for the parameters of the model in Eqs. (1–6) using the NPD program in ADAPT (Version 5) [25] (proportional and additive error variance). The parameters for the pharmacokinetic models of each of the inhibitors were fixed at their values estimated from the PK studies. Table 2 defines all model parameters and their units.
Table 2.
Parameter estimates and percent relative standard errors (%RSE) for the cellular signaling model using pooled data from the AMG925, sorafenib and AC220 studies
| Parameter (units) | Description | Estimate (%RSE) |
|---|---|---|
| kin pSTAT5 (pSTAT5units/h) | Production rate of pSTAT5 | 27,200 (15) |
| kin pRb (pRbunits/h) | Production rate of pRb | 17,500 (2.5) |
| IC50S (nM) | Plasma concentration of sorafenib eliciting half-maximal inhibition of pSTAT5 | 0.144 (25) |
| IC50AC (nM) | Plasma concentration of AC220 eliciting half-maximal inhibition of pSTAT5 | 0.310 (6.1) |
| IC50AMG (nM) | Plasma concentration of AMG925 eliciting half-maximal inhibition of pSTAT5 | 27.7 (8.6) |
| IC50pSTAT5 | Inhibition fraction of pSTAT5 eliciting half-maximal inhibition of pRb | 0.564 (2.0) |
| IC50AMGpRb (nM) | Plasma concentration of AMG925 eliciting half-maximal inhibition of pRb | 42.5 (1.0) |
| IC50SpRb (nM) | Plasma concentration of sorafenib eliciting half-maximal inhibition of pRb | 0.00838 (20) |
| pSTAT5(0) (pSTAT5units) | Baseline level of pSTAT5 | 18,000 (8.6) |
| pRb(0) (pRb units) | Baseline level of pRb | 82,600 (0.97) |
| kout pSTAT5 (h−1) | Turnover rate of pSTAT5, secondary parameter | 1.51 (9.3) |
| kout pRb (h−1) | Turnover rate of pRb, secondary parameter | 0.212 (1.5) |
Plasma PK-subcutaneous tumor cellular signaling- tumor burden
Unperturbed net tumor growth was described by a model incorporating an exponential phase followed by a linear phase as proposed by Simeoni et al [28]. The therapeutic effects of the three inhibitors are mediated by the reduced phosphorylation of STAT5 and Rb. The decreased pSTAT5 values not only promote apoptosis in tumor cells by reducing induction of anti-apoptotic gene transcription, but also impede the proliferation of tumor cells by hindering the G1 to S transition in cell cycle, which is reflected in the reduction of pRb values. In addition, AMG925 and sorafenib mediate a reduction in Rb phosphorylation independent of their action on pSTAT5, which also hinders the proliferation of tumor cells. Accordingly, the model used to describe the action of AMG925 and sorafenib on tumor volume (TV) incorporates pSTAT5 and pRb as follows:
| (7) |
Where: InbpRb = (pRb(0) − pRb)/pRb(0); InbpSTAT5 is as defined above; λ0 and λ1 are exponential and linear rate constants representing net unperturbed tumor growth; and ψ is the exponential/linear growth computational switching factor, fixed at 20 (see [28]). The system-specific parameters kpSTAT5 and kpRb reflect the rates of net tumor growth suppression mediated through the inhibited pSTAT5-induced anti-apoptosis signals, and inhibited Rb phosphorylation, respectively. Based on the tumor size - time measurements from both the AMG925 and sorafenib subcutaneous tumor studies (see Table A.3; no tumor burden studies conducted with AC220), the model parameters in Eq. (7) were estimated via population analysis using the maximum likelihood estimation, expectation maximization (MLEM) algorithm in the ADAPT (Version 5) software [25]. Model parameters were assumed to follow a multivariate Normal distribution, with stage 1 random error taken to be normally distributed with a combined additive and proportional error variance. The parameter values for the pharmacokinetic models of AMG925 and sorafenib were fixed at their values estimated from the PK studies, while the parameters of the signaling model were fixed at their values from the preceding cellular signaling model analysis. Table 3 defines all model parameters and their units.
Table 3.
Parameter estimates, inter-animal variability (IIV as CV%) and corresponding relative standard errors (%RSE) for the plasma PK-cellular signaling-tumor burden model with pooled data from AMG925 and sorafenib studies
| Parameter (units) | Description | Mean (%RSE) | IIV CV% (%RSE) |
|---|---|---|---|
| λ0 (h−1) | Exponential tumor growth rate | 0.0104 (5.9) | 25.2 (17) |
| λ1 (mm3*h−1) | Linear tumor growth rate | 11.2 (23) | 43.5 (36) |
| kpSTAT5 | Rate of net tumor growth suppression due to the inhibition of STAT5 phosphorylation | 0.854 (24) | 26.7 (71) |
| kpRb | Rate of net tumor growth suppression due to the inhibition of Rb phosphorylation | 0.554 (28) | 37.6 (52) |
| TV(0) (mm3) | Initial tumor burden | 211 (3.2) | 15.3 (22) |
Orthotopic tumor cellular signaling
The pharmacokinetics for AMG925 in the FLT3ITD driven AML orthotopic tumor mice were assumed to be sufficiently similar to those in the subcutaneous tumor mice to allow use of the PK model developed from the subcutaneous tumor PK studies. The model developed previously to describe the action of AMG925 on the cellular signaling network in the subcutaneous tumor studies (Eq. (1–2)) was modified as follows to better describe the pSTAT5 alteration in orthotopic tumor studies:
| (8) |
where, HAMG is the hill coefficient and the remaining parameters are the same as defined above. The same Eq. (2) is used to describe the pRb alteration. The model’s drug independent parameters (kin pSTAT5, kin pRb, IC50pSTAT5, pSTAT5(0) and pRb(0)) were fixed at estimated values from the subcutaneous tumor signaling model. Since AMG925 delivery to the orthotopic tumor may differ considerably from that to the subcutaneous tumor due to the different growth environments of the two types of tumor, including blood supply and supporting matrix, the model’s drug specific parameters (IC50AMG, IC50AMGpRb and HAMG) were estimated using the pSTAT5 and pRb data from the orthotopic cellular signaling studies. The pooled data from the three different doses studied were used to obtain the maximum likelihood estimates for the parameters of the model in Eqs. (8) and (2) using the NPD program in ADAPT (Version 5) [25] (proportional and additive error variance). Table 4 defines all the model parameters and their units.
Table 4.
Parameter estimates and percent relative standard errors (%RSE) for the cellular signaling model with AMG925 orthotopic tumor studies
| Parameter (units) | Description | Estimate (%RSE) |
|---|---|---|
| kin pSTAT5 (pSTAT5units/h) | Production rate of pSTAT5 | 27,200 (Fixed) |
| kin pRb (pRbunits/h) | Production rate of pRb | 17,500 (Fixed) |
| IC50AMG (nM) | Plasma concentration of AMG925 eliciting half-maximal inhibition of pSTAT5 | 6.08 (6.2) |
| HAMG | Hill coefficient of pSTAT5 inhibition for AMG925 | 1.92 (4.9) |
| IC50pSTAT5 | Inhibition fraction of pSTAT5 eliciting half-maximal inhibition of pRb | 0.564 (Fixed) |
| IC50AMGpRb (nM) | Plasma concentration of AMG925 eliciting half-maximal inhibition of pRb | 3.93 (1.7) |
| pSTAT5(0) (pSTAT5units) | Baseline level of pSTAT5 | 18,000 (Fixed) |
| pRb(0) (pRb units) | Baseline level of pRb | 82,600 (Fixed) |
Plasma PK-orthotopic cellular signaling-tumor burden
Following inspection of the bioluminescence image (BLI) measurements of tumor burden data following vehicle administration, it was evident that tumor burden exhibited super-linear but sub-exponential growth during latter portion of the study (i.e., larger values of tumor burden). To account for this observed net tumor growth in orthotopic studies, the previous unperturbed growth model in Eq. (7) was modified as follows:
| (9) |
where, γ is the factor determining the shape of tumor growth for larger values of BLI (γ = 1 yields linear growth, γ = 0 yields exponential growth); IC50TS and IC50TR represent the inhibition fraction of pSTAT5 and pRb that elicit half of maximal tumor growth suppression; HS and HR are the corresponding hill coefficients; and the remaining parameters have been defined previously. The parameters and their units are provided in Table 5. The unperturbed tumor growth parameters in Eq. (9) (λ0, λ1, γ) were estimated (via population analysis as described previously) using the BLI-time course measurements from the animals administered vehicle. These parameters were then fixed at their population mean values to estimate (population analysis) the drug action parameters (IC50TS, IC50TR, HS and HR) using BLI measurements from the animals administered AMG925. The parameter values for the pharmacokinetic models of AMG925 were fixed at their values estimated from the subcutaneous tumor PK studies, while the parameters of the signaling model were fixed at their values from the orthotopic tumor cellular signaling analysis.
Table 5.
Parameter estimates and corresponding inter-animal variability (IIV as CV%) for the plasma PK-cellular signaling-tumor burden model with AMG925 orthotopic tumor studies
| Parameter (units) | Description | Mean | IIV CV% |
|---|---|---|---|
| λ0 (h−1) | Exponential tumor growth rate | 0.0439 (Fixed) | - |
| λ1 (megaphotons/sec/h) | Super-linear but sub-exponential growth rate | 0.18 (Fixed) | - |
| γ | Factor determining the shape of tumor growth | 0.257 (Fixed) | - |
| IC50TS | Inhibition fraction of pSTAT5 eliciting half of maximal tumor growth suppression | 0.792 | 14.8 |
| IC50TR | Inhibition fraction of pSTAT5 eliciting half of maximal tumor growth suppression | 2.38 | 14.4 |
| HS | Hill coefficient | 15.1 | 37.6 |
| HR | Hill coefficient | 14.9 | 20.1 |
| BLI (0) (megaphotons/sec) | Initial BLI level | 4.19 | 20.1 |
Results
Pharmacokinetic studies
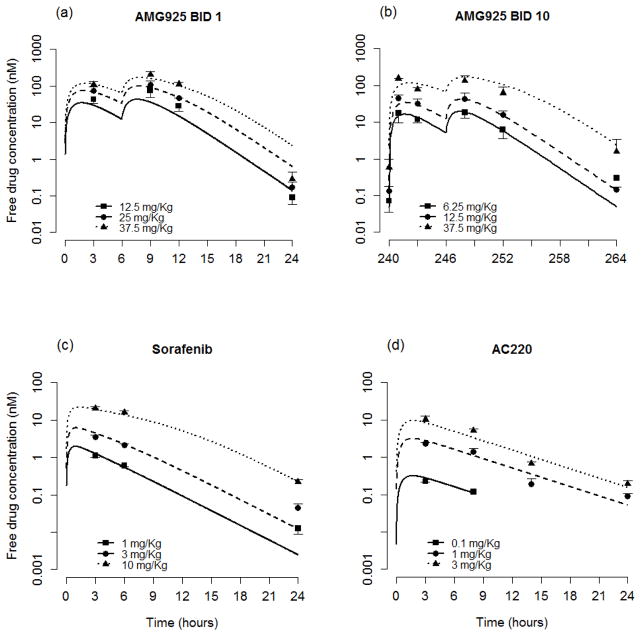
A one compartment model with Michaelis-Menten elimination was selected to describe the plasma concentration-time course measurements for AMG925 from both the single-day and multiple-day studies. The pharmacokinetics of sorafenib were described by a one compartment first-order absorption model with Michaelis-Menten elimination over the dose range studied. A one compartment first-order absorption and first-order elimination model was selected to describe plasma PK of AC220. The resulting parameter estimates of the PK models for each of these inhibitors are shown in Table 1, along with their associated standard errors. Figs. 2a–d show the resulting model predictions and corresponding plasma measurements (mean and standard deviations) for each compound.
Table 1.
Pharmacokinetic parameter estimates and percent relative standard errors (%RSE) for AMG925, sorafenib and AC220
| Compound | Parameter (units) | Estimate (%RSE) |
|---|---|---|
| AMG925 | Km (nM) | 94.5 (7.9) |
| Vmax (nmol/h) | 4.16 (3.1) | |
| V (L) | 0.109 (7.4) | |
| ka (h−1) | 1.00 (20) | |
|
| ||
| Sorafenib | Km (nM) | 9.85 (19) |
| Vmax (nmol/h) | 0.0736 (12) | |
| V (L) | 0.0247 (4.4) | |
| ka (h−1) | 3 (Fixed) | |
|
| ||
| AC220 | kel (h−1) | 0.191 (5.6) |
| V (L) | 0.0964 (10) | |
| ka (h−1) | 1.37 (Fixed) | |
Figure 2.
Plasma PK model performance for AMG925 (a–b), sorafenib (c) and AC220 (d). Symbols are the plasma concentration measurements (mean+/−std), lines are individual model predictions. BID 1 represents single day studies, and BID 10 indicates that the data were collected at the end of 10-day studies. (For clarity in the plots, the BID 25 mg/Kg and QD 150 mg/Kg doses for AMG925 and QD 0.5 mg/Kg dose for AC220 were omitted.)
Subcutaneous tumor studies
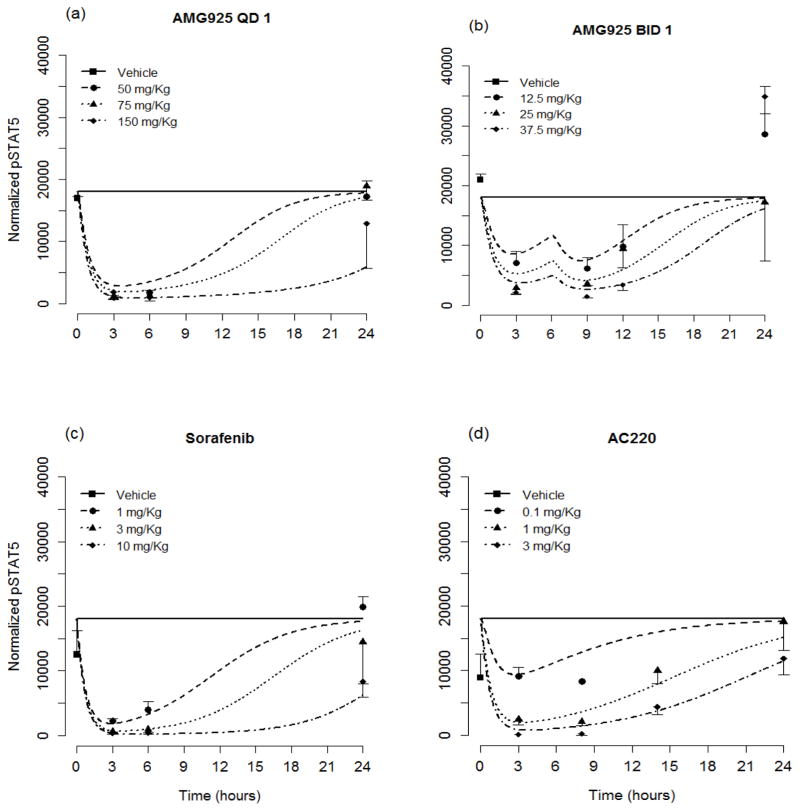
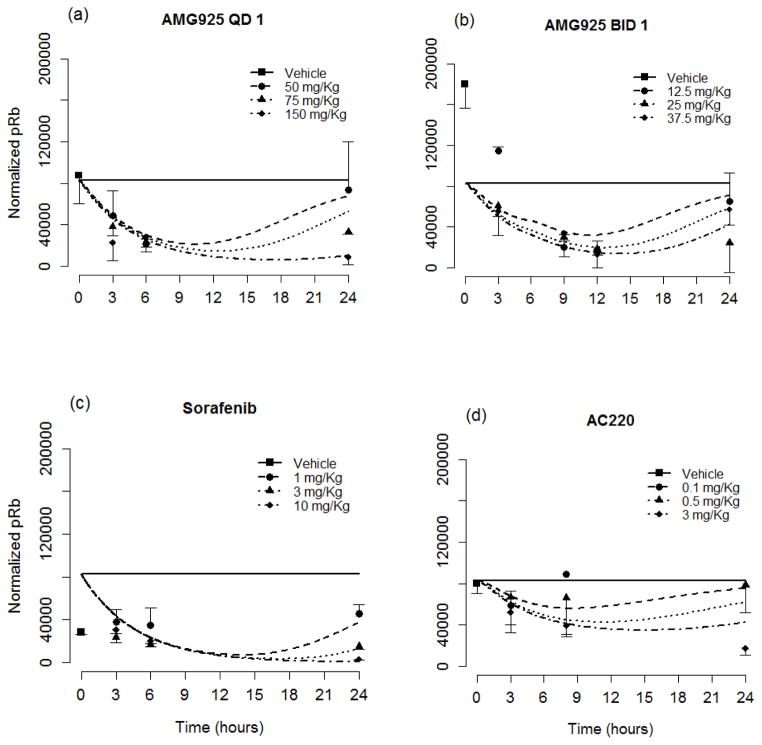
Table 2 lists the resulting estimates and relative standard errors for parameters of the cellular signaling model (Eqs. (1–6)). The resulting model predictions of pSTAT5 along with the measured values (mean and standard deviation) are shown in Figs. 3a and 3b for the once and twice daily dosing studies of AMG925, in Fig. 3c for sorafenib, and in Fig. 3d for AC220. The results show dose-dependent responses, and that the inhibitory effect on STAT5 phosphorylation of each of these compounds is maximal at 2 to 3 hours post dose. Moreover, single doses of 150mg/kg of AMG925, 10mg/kg of sorafenib and 3 mg/Kg of AC220 can almost completely inhibit the phosphorylation of STAT5 at the time of maximum effect. Figures 4a–d show the corresponding model predictions and measurements of pRb. In contrast to the immediate sharp reduction of pSTAT5 values post dose, the pRb values decline more gradually, as reflected in the difference in the estimates of kout pSTAT5 and kout pRb (see Table 2).
Figure 3.
The pSTAT5 portion of the cellular signaling model performance for AMG925 (a–b), sorafenib (c) and AC220 (d). Symbols are measured pSTAT5 values (mean+/−std), and lines are model predictions. (For clarity in the plot, the QD 0.5 mg/Kg dose for AC220 was omitted.)
Figure 4.
The pRb portion of the cellular signaling model performance for AMG925 (a–b), sorafenib (c) and AC220 (d). Symbols are measured pRb values (mean+/−std), and lines are model predictions. (For clarity in the plot, the QD 1 mg/Kg dose for AC220 was omitted.)
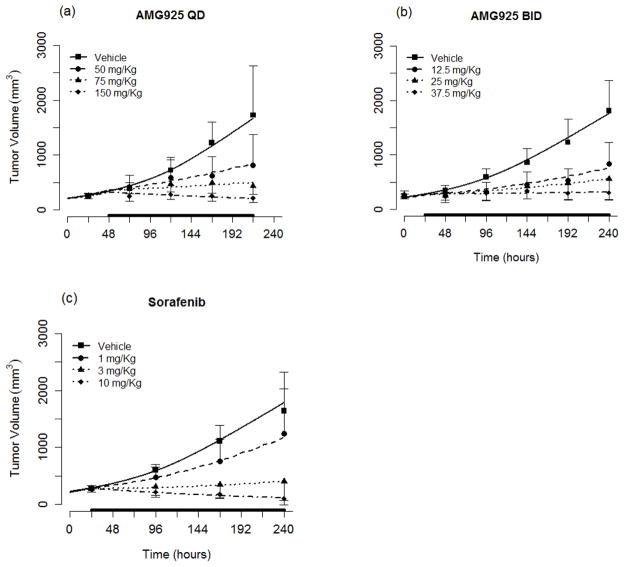
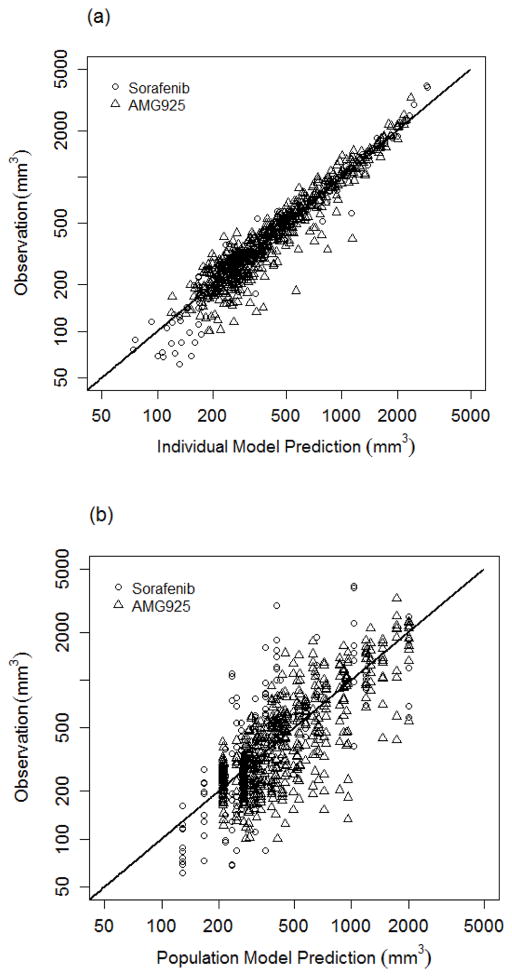
Using the cellular signaling model, the results of the population modeling analysis of tumor burden (see Eq. (7)) following administration of AMG925 or sorafenib are given in Table 3 (model parameter mean and inter-animal variability). Inspection of Table 3 indicates that the population mean of parameters were estimated with reasonable relative standard errors and that the inter-animal variabilities were below 50% CV in all cases. Also some very limited measurements of pSTAT5 and pRb were available for AMG925 multiple-day dosing studies that were not used in the modeling analysis. At dose of 50 mg/Kg QD, the measured values of pSTAT5 and pRb at 240 hr were 17020+/−1133 (mean+/−sd) and 72870+/−1247. The cellular signaling model predictions (17800 and 67570, respectively) are in reasonable agreement with these measurements. The parameters kpSTAT5 and kpRb, which reflect the rates of net tumor growth suppression due to the inhibition of STAT5 and Rb phosphorylation, are 0.854 and 0.554, respectively. The tumor volume (TV) model predictions (average of the predicted TV for each animal within a dose group) and the measured values of tumor volume (mean and standard deviation) are shown in Figs. 5a and 5b for the one and two dose studies of AMG925, and in Fig. 5c for sorafenib. The model predictions and measured tumor volumes are also shown for vehicle. Figure 6a shows the measured tumor volume versus the model predictions for each animal (for all doses of AMG925 and sorafenib), while Figure 6b shows the measured tumor volumes versus their corresponding model predictions based on the population mean parameter estimates.
Figure 5.
Tumor burden model performance for AMG925 (a–b) and sorafenib (c). Symbols are the measured tumor volume (mean+/−std), and lines are the mean of individual model predictions for each dose level. The black bars on x-axis indicate the duration of dosing events. (For clarity in the plots, the QD 25 mg/Kg and BID 6.25 mg/Kg doses for AMG925 and QD 0.1 mg/Kg dose for sorafenib were omitted.)
Figure 6.
Goodness of fit plots for tumor burden model. (a) shows tumor volume measurements and individual model predictions for both AMG925 and sorafenib on log scales, and (b) shows tumor volume measurements and population model predictions for both AMG925 and sorafenib on log scales.
Relative contribution of FLT3ITD and CDK4/6 inhibition to pRb reduction and tumor burden
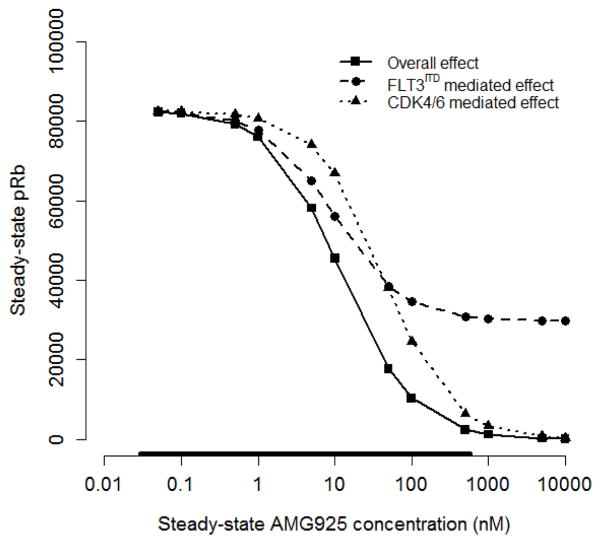
The inhibitory effect of AMG925 on Rb phosphorylation results from both its binding to CDK4/6 and FLT3ITD, with each inhibiting Rb phosphorylation via convergent pathways. Using the cellular signaling model presented above, the overall action of AMG925 on pRb inhibition can be decomposed into its separate FLT3ITD and CDK4/6 mediated components. The signaling model (Eq. (1)–(2) and Table 2) was used to simulate the steady state response to a constant exposure of AMG925 concentration at various values ranging from 0.05 nM to 10000 nM using 1) the complete pathway model, 2) the model with only the CDK4/6 pathway (InbpSTAT5 = 0 in Eq. (2)), and 3) the model with only the FLT3ITD pathway (CAMG = 0 in Eq. (2) but not in Eq. (1)). The results of these simulations, presented in Fig. 7, show that the composite effect of AMG925 is to inhibit pRb in a sigmoidal fashion, with increasing AMG925 concentrations, yielding almost complete inhibition at steady-state concentrations of 1000 nM and above (solid line). The figure also shows that the effect of AMG925’s direct inhibition of CDK4/6 yields similarly shaped concentration-pRb response curve (dotted line) but with lesser potency, while, in contrast, the inhibition of pRb due to AMG925’s binding to FLT3ITD (dashed line) plateaus at around 35% of its baseline value (see Discussion).
Figure 7.
Decomposition of AMG925 inhibitory effects on pRb production, showing steady-state pRb values versus constantly-exposed AMG925 plasma concentration for each pathway separately and jointly. During the simulation, the constant AMG925 concentration varied from 0.05 nM to 10000 nM. Solid line is the overall inhibitory effect of the complete pathway, the dashed line is the effect mediated by only FLT3ITD pathway, and the dotted line is the effect mediated by only CDK4/6 pathway. The bar on the abscissa indicates the range of the AMG925 concentrations observed in the experimental studies.
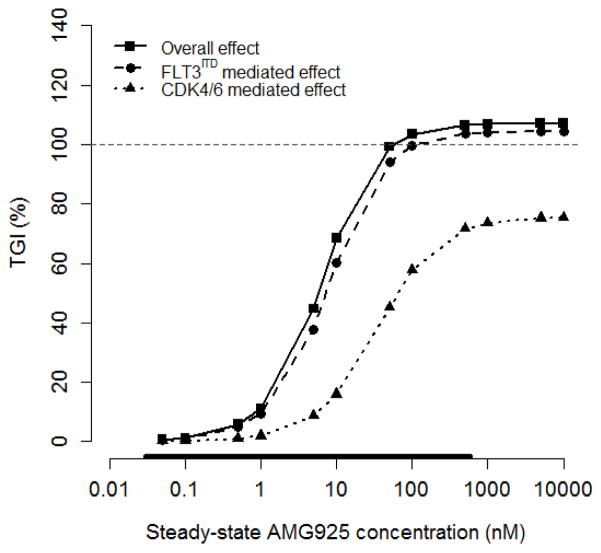
Since the downstream actions of both FLT3ITD and CDK4/6 inhibition each contribute to tumor burden, we investigated their relative contribution to tumor volume using similar simulations of the signaling model but now linked to the model for tumor burden (Eq. (7)). In these simulations, tumor burden was quantified using the change in TV from its initial value to its value following constant AMG925 exposure over 10 days (ΔTVAMG), together with the corresponding change in TV in the vehicle group (ΔTVVeh). The resulting tumor growth inhibition was calculated as: TGI = 100 · (ΔTVVeh − ΔTVAMG)/ΔTVVeh. Using the cellular signaling-tumor burden model, TGI was simulated in response to constant exposure (10 days) of AMG925 concentration at various values ranging from 0.05 nM to 10000 nM using, 1) the complete pathway model, 2) the model with only the CDK4/6 pathway, and 3) the model with only the FLT3ITD pathway as described above.
Figure 8 presents the results of these simulations, showing that the composite effect of AMG925 produces greater than 100% tumor growth inhibition (i.e., tumor regression) for AMG925 concentrations exceeding 50 nM (solid line). The figure also shows that the FLT3ITD mediated pathway produces only somewhat less TGI across the concentration range, resulting in tumor regression at concentrations above 100 nM (dashed line). However, the CDK4/6 pathway has a lesser effect on TGI (dotted line), with a maximum tumor growth inhibition of less than 80%, in contrast to its relatively greater effect on pRb as highlighted above (see Discussion).
Figure 8.
Decomposition of AMG925 inhibitory effect on tumor burden, showing TGI versus constantly-exposed AMG925 plasma concentration for each pathway separately and jointly. The horizontal line indicates 100% TGI. See caption in Fig. 7 for definition of symbols.
Orthotopic tumor studies
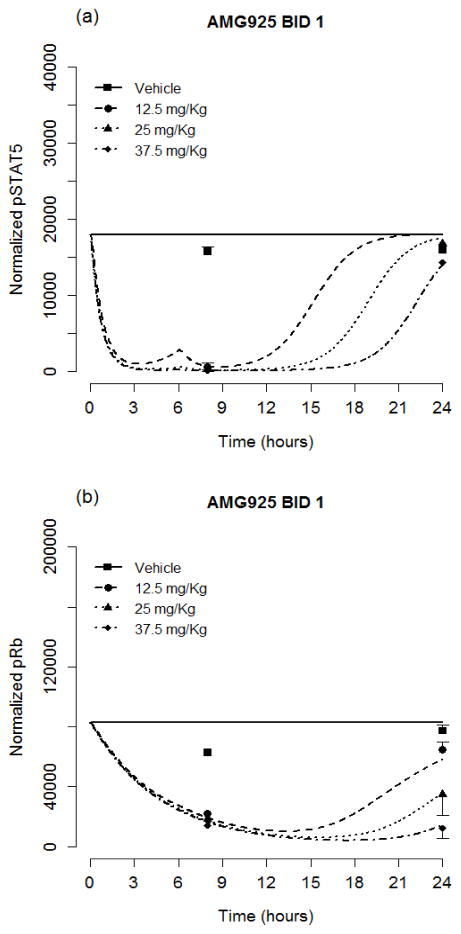
The limited data from the AMG925 orthotopic tumor studies, along with the signaling model in Eqs. (8) and (2), were used to estimate the model’s drug specific parameters, IC50AMG HAMG and IC50AMGpRb, while fixing the remaining cell line specific parameters at values estimated from the multi inhibitor subcutaneous tumor studies. Table 4 lists the estimated and fixed parameter values defining the orthotopic tumor cellular signaling model. It is of note that the estimates of IC50AMG and IC50AMGpRb are each smaller in the orthotopic tumor model than they are in the subcutaneous tumor model. The resulting model predictions of pSTAT5 along with the measured values(mean and standard deviation) are shown in Fig. 9a and those for pRb are shown in Fig. 9b.
Figure 9.
Cellular signaling model performance for AMG925 orthotopic tumor studies. Symbols are the converted pSTAT5 (a) and pRb (b) values (mean+/−std), and lines are model predictions.
The population analysis results using the orthotopic tumor burden data and model (see Eq. (9)) following administration of AMG925 are given in Table 5 (PK and signaling model parameters fixed at their values given in Tables 1 and 4; unperturbed tumor growth parameters fixed at their population mean values when only vehicle data were used (results not shown separately)). The relative standard errors (%RSE) corresponding to parameter estimates and inter-animal variability were large and could not be calculated, thus, no %RSE values are reported in Table 5. The tumor burden model predictions (average of the predicted BLI for each animal within a dose group, as well as vehicle) and the measured values of bioluminescence (mean and standard deviation) are shown in Fig. 10 for all doses of AMG925, as well as for vehicle.
Figure 10.
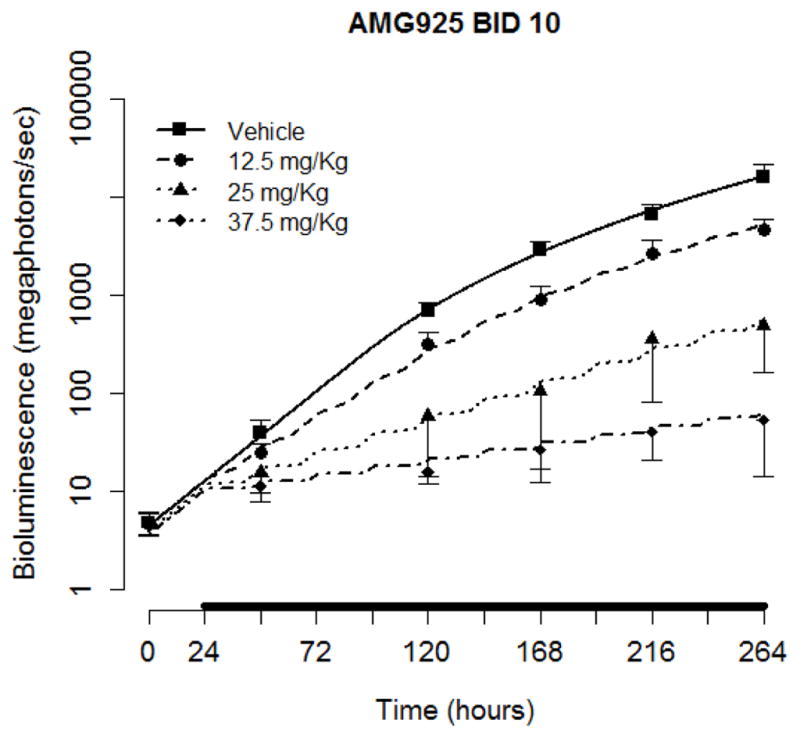
Tumor burden model performance for AMG925 orthotopic tumor studies. Symbols are the measured bioluminescence (mean+/−std), and solid lines are the mean of individual model predictions for each dose level. The black bars on the x-axis indicate the duration of dosing events.
Discussion
In this work we investigated the action of three FLT3 and/or CDK4/6 inhibitors (AMG925 (Amgen), sorafenib (Bayer and Onyx), and AC220 (Ambit Biosciences)) in both subcutaneous and orthotopic AML (MOLM13) xenograft mouse models. By co-modeling the action of the three inhibitors on pSTAT5 and pRb, a model for pathway dynamics was developed and linked to tumor burden. By including separate drug-independent (system specific) components, the model provides a quantitative assessment of the signaling alterations following FLT3 and/or CDK4/6 inhibition. Moreover, the orthotopic AML xenograft model results may provide a more physiologically relevant basis for extrapolation to treatment in patients.
Based on the cellular signaling model developed from the subcutaneous tumor studies, it was found that the free concentration of the bifunctional FLT3ITD-CDK4/6 inhibitor AMG925 eliciting half-maximal inhibition of pSTAT5 is comparable to that for its pRb inhibition (IC50AMG = 28 nM, IC50AMGpRb = 43 nM, see Table 2)), which indicates that AMG925 has a similar inhibitory potency on FLT3ITD and CDK4/6. For the multikinase inihibitor sorafenib, the estimated value of IC50 for pSTAT5 inhibition is 17 fold greater than that for pRb inhibition (IC50S = 0.14 nM, IC50SpRb = 0.0084 nM, see Table 2), which suggests that sorafenib has considerably less potency as a FLT3ITD inhibitor compared to its ability to inhibit additional kinases that may lead to the phosphorylation of Rb, including Raf, VEGFR, PDGFR-β and c-KIT.
In the model simulation study investigating the relative contributions of FLT3ITD and CDK4/6 to the overall inhibitory effects of AM925 on Rb phosphorylation and on tumor burden, the separate contributions of the FLT3ITD and the CDK4/6 pathways were assessed relative to their combined overall effect. As shown in Fig. 7, inhibition of FLT3ITD activity alone does not produce complete suppression of Rb phosphorylation. This result indicates that while pSTAT5 can modulate the transcription level of cycD1, it is not the sole determinant of cycD expression, thus even full suppression of pSTAT5 does not suppress Rb phosphorylation completely. In contrast, when CDK4/6 activity is fully suppressed with increasing AMG925 plasma concentration, complete inhibition of Rb phosphorylation is achieved, since CDK4/6 kinase activity is required for Rb phosphorylation. Figure 8 shows that tumor regression (TGI greater than 100%) occurred with FLT3ITD inhibition or with combined inhibition of both FLT3ITD and CDK4/6. Tumor regression did not result following CDK4/6 inhibition, since CDK4/6 inhibition only leads to the inhibition of tumor proliferation, while FLT3ITD inhibition promotes both apoptosis as well as inhibition of proliferation. Figure 8 also shows that the FLT3ITD mediated effect on tumor burden suppression is dominant over the range of AMG925 exposures examined, in contrast to the CDK4/6 mediated effect. This suggests that apoptotic effect due to reduced pSTAT5 is the dominant pathway in mediating the FLT3ITD effect on tumor burden. Inhibiting both FLT3ITD and CDK4/6 showed only a slightly greater effect on tumor burden when compared to inhibiting FLT3ITD alone, and the slight increased effect can be attributed to the greater magnitude of pRb inhibition (see Fig. 7). However, when acquired resistance to FLT3ITD inhibition develops, as is frequently observed in patients treated with currently available FLT3ITD inhibitors, the inhibitory effect of AMG925 on CDK4/6 kinase can be pivotal (see Fig. 8, CDK4/6 mediated effect curve). Thus, the modeling analysis indicates the therapeutic advantage of the bi-specific inhibitor AMG925 expected in patients who would develop resistance to a FLT3ITD inhibition alone.
The limitations of extrapolating results obtained using ectopic subcutaneous xenograft tumor mouse models (MOLM13 in this case) to first in-human-studies are well known and may result in alteration of growth behavior due to, for example, non-physiologically vascularization and lack of cancer cell support matrix [29]. These issues were addressed, at least in part, by also investigating the action of AMG925 using an orthotopic MOLM13 mouse model. The modeling results reveal significant differences between the subcutaneous and orthotopic xenograft models for both delivery/action of AMG925 on target inhibition and the relation between cellular signals (pSTAT5 and pRb) on tumor burden. For example, comparison of the signaling models developed from the subcutaneous and orthotopic studies (Tables 2 and 4), shows that the IC50 values for AMG925 on pSTAT5 were 4-fold higher in the subcutaneous xenograft than in the orthotopic xenograft (27.7 nM vs 6.08 nM), while the corresponding value of the IC50 for pRb inhibition was more than 10-fold higher in the subcutaneous xenograft than in the orthotopic xenograft (42.5 nM vs 3.93 nM). Regarding the tumor burden modeling analysis, linear effects of pSTAT5 inhibition and pRb inhibition, as incorporated in subcutaneous tumor model in Eq. (7), were not capable of describing the bioluminescence data following different doses of AMG925 administration, therefore, nonlinear effects were used in orthotopic tumor model as shown in Eq. (9). Despite the uncertainty associated with the estimated parameters, these results suggest the effect of pSTAT5 inhibition on tumor burden (IC50=0.79) is greater than that of pRb inhibition (IC50=2.4), which is consistent with the results obtained from the subcutaneous tumor model analysis. By relating pSTAT5 and pRb to tumor burden, the model presented may provide a more robust basis for extrapolation to human studies, in comparison to traditional studies that attempt to extrapolate drug exposure to tumor burden relations observed in animal models to humans.
This work provides additional insights into the action of FLT3 and/or CDK4/6 inhibitors on downstream signaling pathways, as well as on the resulting relation between pSTAT5 and pRb tumor burden in both subcutaneous and orthotopic mouse models of AML. Moreover, it illustrates the benefits of a multiple-input approach to modeling interacting signaling pathways, to allow estimation of pathway dynamics that would otherwise be non-identifiable from studies using single compounds.
Acknowledgments
We gratefully acknowledge Kathy Keegan for her contribution to mouse tumor studies. We also acknowledge Ruta Phadnis and Tim Carlson for their contribution to pharmacokinetic studies. We appreciate the helpful comments provided by Jordan Fridman at Flexus Biosciences, Inc. This work was supported by Amgen Inc., as well as by grant NIH/NIBIB P41-EB001978 (DZD).
Appendix
Study Designs
Table A.1.
The PK study dosing regimens and observation schedules for AMG925, sorafenib and AC220. In BID studies, the two doses each day were 6 hours apart. The doses were chosen from in vitro and PK analysis to ensure in vivo plasma level coverage of in vitro EC50 by either QD or BID dosing regimens.
| Compound | Dosing Regimen | Observation Times (hours) | Number of Animals |
|---|---|---|---|
| AMG925 | BID 37.5 mg/Kg for 1 day | 3, 9, 12, 24 | 3 |
| BID 25 mg/Kg for 1 day | 3, 9, 12, 24 | 3 | |
| BID 12.5 mg/Kg for 1 day | 3, 9, 12, 24 | 3 | |
| BID 37.5 mg/Kg for 10 days | 240, 241, 243, 248, 252, 264 | 3 | |
| BID 25 mg/Kg for 10 days | 240, 241, 243, 248, 252, 264 | 3 | |
| BID 12.5 mg/Kg for 10 days | 240, 241, 243, 248, 252, 264 | 3 | |
| BID 6.25 mg/Kg for 10 days | 240, 241, 243, 248, 252, 264 | 3 | |
| QD 150 mg/Kg for 8 days | 216, 217, 219, 222, 240 | 2 | |
| Sorafenib | QD 10 mg/Kg for 1 day | 3, 6, 24 | 2 |
| QD 3 mg/Kg for 1 day | 3, 6, 24 | 2 | |
| QD 1 mg/Kg for 1 day | 3, 6, 24 | 2 | |
| AC220 | QD 3 mg/Kg for 1 day | 3, 8, 14, 24 | 3 |
| QD 1 mg/Kg for 1 day | 3, 8, 14, 24 | 3 | |
| QD 0.5 mg/Kg for 1 day | 3, 8, 14, 24 | 3 | |
| QD 0.1 mg/Kg for 1 day | 3, 8, 14, 24 | 3 |
Table A.2.
The cellular signaling study dosing regimens and observation schedules for AMG925, sorafenib and AC220. In BID studies, the two doses each day were 6 hours apart.
| Compound | Dosing Regimen | Observation Times (hours) | Number of Animals |
|---|---|---|---|
| AMG925 | BID 37.5 mg/Kg for 1 day | 3, 9, 12, 24 | 3 |
| BID 25 mg/Kg for 1 day | 3, 9, 12, 24 | 3 | |
| BID 12.5 mg/Kg for 1 day | 3, 9, 12, 24 | 3 | |
| BID Vehicle for 1 day | 24 | 3 | |
| QD 150 mg/Kg for 1 day | 3, 6, 24 | 3 | |
| QD 75 mg/Kg for 1 day | 3, 6, 24 | 3 | |
| QD 50 mg/Kg for 1 day | 3, 6, 24 | 3 | |
| QD Vehicle for 1 day | 24 | 3 | |
| Sorafenib | QD 10 mg/Kg for 1 day | 3, 6, 24 | 3 |
| QD 3 mg/Kg for 1 day | 3, 6, 24 | 3 | |
| QD 1 mg/Kg for 1 day | 3, 6, 24 | 3 | |
| QD Vehicle for 1 day | 24 | 3 | |
| AC220 | QD 3 mg/Kg for 1 day | 3, 8, 24 | 3 |
| QD 1 mg/Kg for 1 day | 3, 8, 24 | 3 | |
| QD 0.5 mg/Kg for 1 day | 3, 8, 24 | 3 | |
| QD 0.1 mg/Kg for 1 day | 3, 8, 24 | 3 | |
| QD Vehicle for 1 day | 24 | 3 |
Table A.3.
The tumor burden study dosing regimens and observation schedules for AMG925 and sorafenib. In BID studies, the two doses each day were 6 hours apart.
| Compound | Dosing Regimen | Dosing start time (hours) | Observation Times (hours) | Number of Animals |
|---|---|---|---|---|
| AMG925 | BID 37.5 mg/Kg for 10 days | 24 | 0, 48, 96, 144, 192, 240 | 10 |
| BID 25 mg/Kg for 10 days | 24 | 0, 48, 96, 144, 192, 240 | 10 | |
| BID 12.5 mg/Kg for 10 days | 24 | 0, 48, 96, 144, 192, 240 | 10 | |
| BID 6.25 mg/Kg for 10 days | 24 | 0, 48, 96, 144, 192, 240 | 10 | |
| BID Vehicle for 10 days | 24 | 0, 48, 96, 144, 192, 240 | 10 | |
| QD 150 mg/Kg for 8 days | 48 | 24, 72, 120, 168, 216 | 10 | |
| QD 75 mg/Kg for 8 days | 48 | 24, 72, 120, 168, 216 | 10 | |
| QD 50 mg/Kg for 8 days | 48 | 24, 72, 120, 168, 216 | 10 | |
| QD 25 mg/Kg for 8 days | 48 | 24, 72, 120, 168, 216 | 10 | |
| QD Vehicle for 8 days | 48 | 24, 72, 120, 168, 216 | 10 | |
| Sorafenib | QD 10 mg/Kg for 10 days | 24 | 24, 96, 168, 240 | 10 |
| QD 3 mg/Kg for 10 days | 24 | 24, 96, 168, 240 | 10 | |
| QD 1 mg/Kg for 10 days | 24 | 24, 96, 168, 240 | 10 | |
| QD 0.1 mg/Kg for 10 days | 24 | 24, 96, 168, 240 | 9 | |
| QD Vehicle for 10 days | 24 | 24, 96, 168, 240 | 9 |
Table A.4.
The orthotopic cellular signaling study dosing regimens and observation schedules for AMG925. In BID studies, the two doses each day were 6 hours apart.
| Compound | Dosing Regimen | Observation Times (hours) | Number of Animals |
|---|---|---|---|
| AMG925 | BID 37.5 mg/Kg for 1 day | 8, 24 | 30 |
| BID 25 mg/Kg for 1 day | 8, 24 | 30 | |
| BID 12.5 mg/Kg for 1 day | 8, 24 | 30 | |
| BID Vehicle for 1 day | 8, 24 | 30 |
Table A.5.
The orthotopic tumor burden study dosing regimens and observation schedules for AMG925. In BID studies, the two doses each day were 6 hours apart.
| Compound | Dosing Regimen | Dosing start time (hours) | Observation Times (hours) | Number of Animals |
|---|---|---|---|---|
| AMG925 | BID 37.5 mg/Kg for 10 days | 24 | 0, 48, 120, 168, 216, 264 | 10 |
| BID 25 mg/Kg for 10 days | 24 | 0, 48, 120, 168, 216, 264 | 10 | |
| BID 12.5 mg/Kg for 10 days | 24 | 0, 48, 120, 168, 216, 264 | 10 | |
| BID Vehicle for 10 days | 24 | 0, 48, 120, 168, 216, 264 | 10 |
Footnotes
Conflict of interest:
Y. Zhang and D.Z. D’Argenio declare no conflict of interests. J.-F. Lu is an employee of Askgene Pharma, and the remaining authors are employees of Amgen Inc.
Contributor Information
Yaping Zhang, Department of Biomedical Engineering, University of Southern California, Los Angeles, CA, USA.
Cheng-Pang Hsu, PKDM, Amgen, Thousand Oaks, CA, USA.
Jian-Feng Lu, Askgene Pharma, Camarillo, CA, USA.
Mita Kuchimanchi, PKDM, Amgen, Thousand Oaks, CA, USA.
Yu-Nien Sun, PKDM, Amgen, Thousand Oaks, CA, USA.
Ji Ma, PKDM, Amgen, Thousand Oaks, CA, USA.
Guifen Xu, PKDM, Amgen, Thousand Oaks, CA, USA.
Yilong Zhang, PKDM, Amgen, Thousand Oaks, CA, USA.
Yang Xu, PKDM, Amgen, Thousand Oaks, CA, USA.
Margaret Weidner, Therapeutic innovation unit, Amgen, Seattle, WA, USA.
Justin Huard, Therapeutic innovation unit, Amgen, Seattle, WA, USA.
David Z. D’Argenio, Department of Biomedical Engineering, University of Southern California, Los Angeles, CA, USA
References
- 1.Gilliland DG, Griffin JD. The roles of FLT3 in hematopoiesis and leukemia. Blood. 2002;100 (5):1532–1542. doi: 10.1182/blood-2002-02-0492. [DOI] [PubMed] [Google Scholar]
- 2.Levis M, Small D. FLT3: ITDoes matter in leukemia. Leukemia : official journal of the Leukemia Society of America, Leukemia Research Fund, UK. 2003;17 (9):1738–1752. doi: 10.1038/sj.leu.2403099. [DOI] [PubMed] [Google Scholar]
- 3.Nakao M, Yokota S, Iwai T, Kaneko H, Horiike S, Kashima K, Sonoda Y, Fujimoto T, Misawa S. Internal tandem duplication of the flt3 gene found in acute myeloid leukemia. Leukemia : official journal of the Leukemia Society of America, Leukemia Research Fund, UK. 1996;10 (12):1911–1918. [PubMed] [Google Scholar]
- 4.Vardiman JW, Thiele J, Arber DA, Brunning RD, Borowitz MJ, Porwit A, Harris NL, Le Beau MM, Hellstrom-Lindberg E, Tefferi A, Bloomfield CD. The 2008 revision of the World Health Organization (WHO) classification of myeloid neoplasms and acute leukemia: rationale and important changes. Blood. 2009;114 (5):937–951. doi: 10.1182/blood-2009-03-209262. [DOI] [PubMed] [Google Scholar]
- 5.Kiyoi H, Yanada M, Ozekia K. Clinical significance of FLT3 in leukemia. International journal of hematology. 2005;82 (2):85–92. doi: 10.1532/IJH97.05066. [DOI] [PubMed] [Google Scholar]
- 6.Levis M, Small D. FLT3 tyrosine kinase inhibitors. International journal of hematology. 2005;82 (2):100–107. doi: 10.1532/IJH97.05079. [DOI] [PubMed] [Google Scholar]
- 7.Hayakawa F, Towatari M, Kiyoi H, Tanimoto M, Kitamura T, Saito H, Naoe T. Tandem-duplicated Flt3 constitutively activates STAT5 and MAP kinase and introduces autonomous cell growth in IL-3-dependent cell lines. Oncogene. 2000;19 (5):624–631. doi: 10.1038/sj.onc.1203354. [DOI] [PubMed] [Google Scholar]
- 8.Yoshimoto G, Miyamoto T, Jabbarzadeh-Tabrizi S, Iino T, Rocnik JL, Kikushige Y, Mori Y, Shima T, Iwasaki H, Takenaka K, Nagafuji K, Mizuno S, Niiro H, Gilliland GD, Akashi K. FLT3-ITD up-regulates MCL-1 to promote survival of stem cells in acute myeloid leukemia via FLT3-ITD-specific STAT5 activation. Blood. 2009;114 (24):5034–5043. doi: 10.1182/blood-2008-12-196055. [DOI] [PMC free article] [PubMed] [Google Scholar]
- 9.Kim KT, Baird K, Ahn JY, Meltzer P, Lilly M, Levis M, Small D. Pim-1 is up-regulated by constitutively activated FLT3 and plays a role in FLT3-mediated cell survival. Blood. 2005;105 (4):1759–1767. doi: 10.1182/blood-2004-05-2006. [DOI] [PubMed] [Google Scholar]
- 10.Dumon S, Santos SC, Debierre-Grockiego F, Gouilleux-Gruart V, Cocault L, Boucheron C, Mollat P, Gisselbrecht S, Gouilleux F. IL-3 dependent regulation of Bcl-xL gene expression by STAT5 in a bone marrow derived cell line. Oncogene. 1999;18 (29):4191–4199. doi: 10.1038/sj.onc.1202796. [DOI] [PubMed] [Google Scholar]
- 11.Weinberg RA. The biology of cancer. New York: Garland Science; 2007. [Google Scholar]
- 12.Matsumura I, Kitamura T, Wakao H, Tanaka H, Hashimoto K, Albanese C, Downward J, Pestell RG, Kanakura Y. Transcriptional regulation of the cyclin D1 promoter by STAT5: its involvement in cytokine-dependent growth of hematopoietic cells. The EMBO journal. 1999;18 (5):1367–1377. doi: 10.1093/emboj/18.5.1367. [DOI] [PMC free article] [PubMed] [Google Scholar]
- 13.Wiernik PH. FLT3 inhibitors for the treatment of acute myeloid leukemia. Clinical advances in hematology & oncology : H&O. 2010;8 (6):429–436. 444. [PubMed] [Google Scholar]
- 14.Grunwald MR, Levis MJ. FLT3 inhibitors for acute myeloid leukemia: a review of their efficacy and mechanisms of resistance. International journal of hematology. 2013;97 (6):683–694. doi: 10.1007/s12185-013-1334-8. [DOI] [PubMed] [Google Scholar]
- 15.Harbour JW, Luo RX, Dei Santi A, Postigo AA, Dean DC. Cdk phosphorylation triggers sequential intramolecular interactions that progressively block Rb functions as cells move through G1. Cell. 1999;98 (6):859–869. doi: 10.1016/s0092-8674(00)81519-6. [DOI] [PubMed] [Google Scholar]
- 16.Lundberg AS, Weinberg RA. Functional inactivation of the retinoblastoma protein requires sequential modification by at least two distinct cyclin-cdk complexes. Molecular and cellular biology. 1998;18 (2):753–761. doi: 10.1128/mcb.18.2.753. [DOI] [PMC free article] [PubMed] [Google Scholar]
- 17.Meyerson M, Harlow E. Identification of G1 kinase activity for cdk6, a novel cyclin D partner. Molecular and cellular biology. 1994;14 (3):2077–2086. doi: 10.1128/mcb.14.3.2077. [DOI] [PMC free article] [PubMed] [Google Scholar]
- 18.Sherr CJ. D-type cyclins. Trends in biochemical sciences. 1995;20 (5):187–190. doi: 10.1016/s0968-0004(00)89005-2. [DOI] [PubMed] [Google Scholar]
- 19.Hall M, Peters G. Genetic alterations of cyclins, cyclin-dependent kinases, and Cdk inhibitors in human cancer. Advances in cancer research. 1996;68:67–108. doi: 10.1016/s0065-230x(08)60352-8. [DOI] [PubMed] [Google Scholar]
- 20.Sheppard KE, McArthur GA. The cell-cycle regulator CDK4: an emerging therapeutic target in melanoma. Clinical cancer research : an official journal of the American Association for Cancer Research. 2013;19 (19):5320–5328. doi: 10.1158/1078-0432.CCR-13-0259. [DOI] [PubMed] [Google Scholar]
- 21.Wilhelm SM, Carter C, Tang L, Wilkie D, McNabola A, Rong H, Chen C, Zhang X, Vincent P, McHugh M, Cao Y, Shujath J, Gawlak S, Eveleigh D, Rowley B, Liu L, Adnane L, Lynch M, Auclair D, Taylor I, Gedrich R, Voznesensky A, Riedl B, Post LE, Bollag G, Trail PA. BAY 43-9006 exhibits broad spectrum oral antitumor activity and targets the RAF/MEK/ERK pathway and receptor tyrosine kinases involved in tumor progression and angiogenesis. Cancer research. 2004;64 (19):7099–7109. doi: 10.1158/0008-5472.CAN-04-1443. [DOI] [PubMed] [Google Scholar]
- 22.Zarrinkar PP, Gunawardane RN, Cramer MD, Gardner MF, Brigham D, Belli B, Karaman MW, Pratz KW, Pallares G, Chao Q, Sprankle KG, Patel HK, Levis M, Armstrong RC, James J, Bhagwat SS. AC220 is a uniquely potent and selective inhibitor of FLT3 for the treatment of acute myeloid leukemia (AML) Blood. 2009;114 (14):2984–2992. doi: 10.1182/blood-2009-05-222034. [DOI] [PMC free article] [PubMed] [Google Scholar]
- 23.Keegan K, Li C, Li Z, Ma J, Ragains M, Coberly S, Hollenback D, Eksterowicz J, Liang L, Weidner M, Huard JN, Wang X, Alba G, Orf J, Lo MC, Zhao S, Ngo R, Chen A, Liu L, Carlson T, Queva C, McGee LR, Medina JC, Kamb A, Wickramasinghe D, Dai K. Preclinical evaluation of AMG 925, a FLT3/CDK4 dual kinase inhibitor for treating acute myeloid leukemia. Molecular cancer therapeutics. 2014 doi: 10.1158/1535-7163.MCT-13-0858. [DOI] [PubMed] [Google Scholar]
- 24.Cox DM, Zhong F, Du M, Duchoslav E, Sakuma T, McDermott JC. Multiple reaction monitoring as a method for identifying protein posttranslational modifications. Journal of biomolecular techniques : JBT. 2005;16 (2):83–90. [PMC free article] [PubMed] [Google Scholar]
- 25.D’Argenio DZAS, Wang X. ADAPT 5 User’s Guide: Pharmacokinetic/Pharmacodynamic Systems Analysis Software. Biomedical Simulations Resource; Los Angeles: 2009. [Google Scholar]
- 26.Kay BP, Hsu CP, Lu JF, Sun YN, Bai S, Xin Y, D’Argenio DZ. Intracellular-signaling tumor-regression modeling of the pro-apoptotic receptor agonists dulanermin and conatumumab. Journal of pharmacokinetics and pharmacodynamics. 2012;39 (5):577–590. doi: 10.1007/s10928-012-9269-x. [DOI] [PMC free article] [PubMed] [Google Scholar]
- 27.Harrold JM, Straubinger RM, Mager DE. Combinatorial chemotherapeutic efficacy in non-Hodgkin lymphoma can be predicted by a signaling model of CD20 pharmacodynamics. Cancer research. 2012;72 (7):1632–1641. doi: 10.1158/0008-5472.CAN-11-2432. [DOI] [PMC free article] [PubMed] [Google Scholar]
- 28.Simeoni M, Magni P, Cammia C, De Nicolao G, Croci V, Pesenti E, Germani M, Poggesi I, Rocchetti M. Predictive pharmacokinetic-pharmacodynamic modeling of tumor growth kinetics in xenograft models after administration of anticancer agents. Cancer research. 2004;64 (3):1094–1101. doi: 10.1158/0008-5472.can-03-2524. [DOI] [PubMed] [Google Scholar]
- 29.Garber K. Realistic rodents? Debate grows over new mouse models of cancer. Journal of the National Cancer Institute. 2006;98 (17):1176–1178. doi: 10.1093/jnci/djj381. [DOI] [PubMed] [Google Scholar]


