Abstract
Minimal physiologically based pharmacokinetic (mPBPK) models provide a simple and sensible approach that incorporates physiological elements into pharmacokinetic (PK) analysis when only plasma data are available. With this modeling concept, a second-generation mPBPK model was further developed with specific accommodations for the unique PK properties of monoclonal antibodies (mAb). This study applied this model to extensively survey mAb PK in man in order to seek general perspectives on mAb distributional and elimination features. Profiles for 72 antibodies were successfully analyzed with this model. The model results provide assessment regarding: 1) predominant clearance site, in plasma or interstitial fluid (ISF); 2) mAb ISF concentrations in two groups of lumped tissues with continuous (Vtight) or fenestrated (Vleaky) vascular endothelium; 3) Transcapillary Escape Rate (TER), an indicator of systemic vascular permeability. For 93% of surveyed mAbs, the model assuming clearance from plasma (CLp) produced better or at least equivalent model performance than the model with clearance from ISF and yielded most consistent values of vascular reflection coefficients (σ1 and σ2) among all antibodies. The average mAb ISF concentration in Vtight and Vleaky at equilibrium was predicted to be about 6.8% and 37.9% of that in plasma. A positive correlation was detected between plasma clearance and TER among most mAbs, which could be interpreted as both parameters having common determinants related to ISF tissue distribution in this model context. The mAbs with relative higher plasma clearance (> 0.035 L/hr/70 kg) did not reveal such positive correlation between clearance and TER, implying that the factors contributing to high clearance may not necessarily increase tissue distribution and penetration. In conclusion, this mPBPK model offers a more mechanistic approach for analyzing plasma mAb PK than compartment models and generates parameters providing useful intrinsic distributional and elimination insights for a large number of mAbs that were examined in man.
Keywords: PBPK, minimal PBPK models, monoclonal antibody, distribution
Introduction
Over the last three decades, monoclonal antibodies (mAb) have dramatically transformed drug discovery and human therapeutics. More than 30 antibodies have been approved by the U.S. Food and Drug Administration, and hundreds of candidates are in clinical trials [1]. So far, most of the approved mAbs are used for cancer [2] and autoimmune diseases [3], but it is likely that therapeutic antibodies will find indications for a variety of other diseases.
Pharmacokinetic (PK) studies are important in almost every stage of drug development and a proper PK model can assist in quantitation and prediction of drug properties [4]. It has been well documented that mAbs exhibit many different PK behaviors from small molecules [5], such as limited vascular permeability, much less renal filtration and hepatic metabolism, and more common receptor-mediated nonlinearity. Models that specially accommodate these PK features would be helpful. Although a typical bi-exponential PK profile is often observed for many mAbs, the underlying processes are intrinsically different from small molecules. Hence, in mAb PK analysis, classical PK approaches (noncompartmental analysis (NCA), twocompartment models (2CM)) should be applied with caution as the analysis results sometimes involve problems for interpretation [6, 7], particularly for those mAbs with activity within or clearance from peripheral tissues that are not in rapid equilibrium with plasma.
Minimal physiologically-based pharmacokinetic (mPBPK) models offer a simple and sensible modeling approach to incorporate physiological elements into pharmacokinetic (PK) analysis when only plasma data are available [8]. We introduced a second-generation mPBPK model, which was developed in specific consideration of those unique PK behaviors of mAb [9]. Specifically, the model divides the system tissues into two groups based on the structure of their vascular endothelium, continuous and discontinuous or fenestrated. Lymph was separately considered in this model and convection was assumed as the primary distribution and recycling mechanism. This model has shown the potential to serve as a general approach if one can only analyze mAb plasma concentration vs time data and it generates parameters providing better PK insights than NCA and the 2CM mammillary model. One feature of this model is predicting antibody concentrations in the ISF of two groups of lumped tissues, which is always a challenging task for experimental measurements. This becomes particularly important for antibodies with targets in ISF, as the predicted ISF concentrations may allow assessments of receptor occupancy and the following pharmacodynamics at the site of action, which otherwise has to rely on plasma concentrations.
The study applies this model to over 80 literature-surveyed mAb PK profiles in man, mainly to: 1) evaluate the feasibility of this model as a general modeling approach for mAb PK analysis; and 2) seek general perspectives of distributional and elimination properties of available mAbs.
Theoretical
Second-generation mPBPK model
The second-generation mPBPK model was developed specifically for linear mAb PK analysis (9). The model structure is shown in Figure 1. Two groups of tissues (Vtight and Vleaky) were defined in the model according to the vascular endothelial structure as ISF volumes in tissues that have continuous or fenestrated capillaries [10]. The Vtight includes muscle, skin, adipose and brain and Vleaky refers to all other tissues (liver, kidney, heart, etc). Model A assumed clearance from plasma and Model B assumed clearance from ISF. The differential equations for the model A (with CLp) are:
Figure 1.
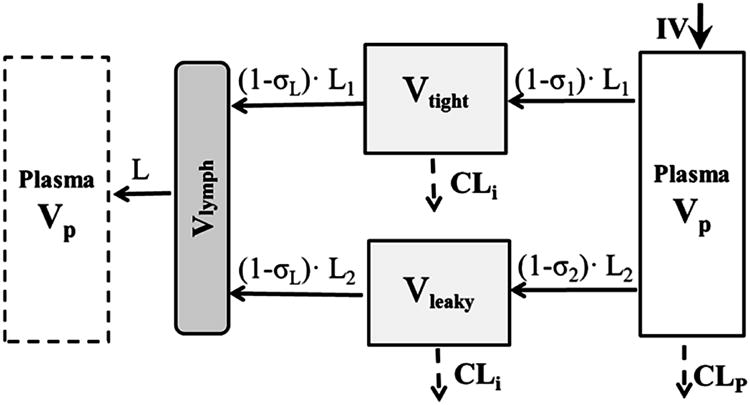
Second-generation minimal PBPK model for monoclonal antibody pharmacokinetics. Symbols and physiological restrictions are defined in Eq (1) – (6). Clearance is applied either to plasma or interstitial fluid. The plasma compartment in the left box represents the venous plasma as in full PBPK models but is not applied in this model.
| (1) |
| (2) |
| (3) |
| (4) |
where Cp and Clymph are antibody concentrations in plasma and lymph and Ctight and Cleaky are antibody concentrations in tissues with continuous endothelium (Vtight) and with fenestrated or discontinuous endothelium (Vleaky). The L is total lymph flow and equals the sum of L1 and L2, where L1 = 0.33•L and L2 = 0.67•L. These fractions were derived from previously used values of lymph flow in full PBPK models [11, 12] except for brain that has no measurable lymph flow [13]. The σ1 and σ2 are vascular reflection coefficients for Vtight and Vleaky. The σL is the lymphatic capillary reflection coefficient, which is assumed to be 0.2 [11]. The CLi and CLp are clearances from ISF and plasma. All Initial Conditions are concentrations = 0.
The physiological restrictions are: Vp is plasma volume and Vlymph is total lymph volume, and:
| (5a, b) |
| (6a, b) |
where ISF is total system ISF and Kp is available fraction of ISF for antibody distribution. The physiologic parameters [14, 15] for a 70 kg body weight person are: L = 2.9 L/day, ISF = 15.6 L, Vlymph = 5.2 L, and Vplasma = 2.6 L. Also, Kp = 0.8 for native IgG1 and 0.4 for native IgG4 [16, 17].
Only three parameters need to be estimated in this model: σ1, σ2 and CLp (or CLi). The two clearances are not estimated together, but the model can test which one works better. One point should be clarified is that this model does not enact the function of FcRn according to our previous analysis [9]. The analysis showed that FcRn may play important role in antibody systemic persistence but may not substantially contribute to tissue distribution.
The Transcapillary Escape Rate (TER) is the sum of two routes,
| (7) |
The concentration ratios at equilibrium between ISF and plasma can be calculated in Model A as,
| (8a, b) |
In Model B, where clearance from ISF (CLi) is assumed, the ratios are:
| (9a, b) |
As shown in Eq. (7) – (9), the vascular reflection coefficients (σ1 and σ2) are parameters that not only determine transcapillary rate but also predict the extent of distribution. The lower vascular reflection coefficient produces a more rapid transcapillary rate, resulting in earlier peaking and higher concentrations of mAb in the lumped ISF compartment.
The ADAPT and WinNonlin model codes for these equations were provided previously [9].
Data analysis
The second-generation mPBPK model was applied to analyze 83 mAb PK profiles found in the literature for man (Tables 1 and 2). The mAbs selected were those with linear PK in the tested dose range and study conditions. Plasma concentration versus time data for these antibodies were captured using Digitizer software. Where possible, a wide range of doses were utilized with all data for each mAb and fitted jointly. Given the similar isoelectric point (pI) values (in the range of 8-9) of the currently assessed mAbs with native IgG1, Kp was set to 0.8 in this analysis.
Table 1.
Pharmacokinetic parameters of monoclonal antibodies (mAb) in man.
| Model with CLp (L/hr/70 kg) | Model with CLi (L/hr/70 kg) | Preference for CLp c | |||||||||
|---|---|---|---|---|---|---|---|---|---|---|---|
|
|
|
||||||||||
| Name | Type | Ref a | σ1 | σ2 | CLp | Obj b | σ1 | σ2 | CLi | Obj | |
| Adalimumab | IgG1 | [S1] | 0.950d | 0.628 | 0.0104 | 89.5 | 0.515 | 0.476 | <0.0001 | 112.4 | Yes |
| Adecatumumab | IgG1 | [S2] | 0.883 | 0.524 | 0.0300 | 223.2 | 0.416 | 0.296 | 0.0318 | 220.8 | Similar |
| Aflibercept | IgG1 | [S3-5] | 0.950 | 0.340 | 0.0333 | 91.0 | 0.762 | <0.001 | 0.0362 | 88.9 | Yes |
| AGS-1C4D4 | IgG1 | [S6] | 0.950 | 0.701 | 0.0062 | 172.1 | 1.000 | 0.562 | 0.0176 | 171.6 | Similar |
| Alefacept | IgG1 | [S7] | 0.950 | 0.682 | 0.0131 | -14.1 | 0.950 | 0.460 | 0.0268 | -17.1 | Similar |
| AMG102 | IgG2 | [S8] | 0.950 | 0.590 | 0.0090 | 109.0 | 0.950 | 0.438 | 0.0160 | 107.8 | Similar |
| AMG386 | IgG1 | [S9] | 0.950 | 0.321 | 0.0612 | 204.1 | <0.001 | <0.001 | 0.0529 | 201.5 | Yes |
| APG101 | IgG1 | [S10] | 0.950 | 0.202 | 0.0278 | 153.9 | 0.579 | <0.001 | 0.0223 | 152.1 | Similar |
| AS1402 | IgG1 | [S11] | 0.950 | 0.862 | 0.0251 | 115.3 | 0.950 | 0.471 | 0.0964 | 113.3 | Similar |
| AVE1642 | IgG1 | [S12] | 0.950 | 0.639 | 0.0156 | 244.0 | 0.916 | 0.418 | 0.0285 | 242.2 | Similar |
| Bapineuzumab | IgG1 | [S13] | 0.950 | 0.587 | 0.0086 | 56.5 | 0.822 | 0.531 | 0.0134 | 56.4 | Similar |
| Basiliximab | IgG1 | [S14,S15] | 0.950 | 0.649 | 0.0191 | 45.3 | 0.896 | 0.320 | 0.0299 | 43.8 | Similar |
| Belimumab | IgG1 | [S16] | 0.958 | 0.759 | 0.0175 | 95.5 | 0.511 | 0.738 | 0.0351 | 92.8 | Yes |
| Bevacizumab | IgG1 | [S17] | 0.950 | 0.869 | 0.0086 | 256.8 | 0.990 | 0.683 | 0.0343 | 254.1 | Similar |
| Canakinumab | IgG1 | [S18] | 0.917 | 0.716 | 0.0073 | 66.5 | 0.870 | 0.577 | 0.0118 | 109.2 | Yes |
| Cantuzumab mertansine | IgG1 | [S19] | 0.990 | 0.984 | 0.0664 | 58.2 | <0.001 | 0.483 | 0.2785 | 57.3 | Yes |
| CαStx2 | IgG1 | [S20] | 0.950 | 0.775 | 0.0186 | 178.5 | 0.950 | 0.455 | 0.0417 | 170.1 | No |
| CAT-354 | IgG4 | [S21,S22] | 0.928 | 0.919 | 0.0066 | 87.9 | 0.556 | 1.000 | 0.0201 | 91.7 | Yes |
| CDP571 | IgG4 | [S23] | 0.950 | 0.811 | 0.0482 | 44.4 | 0.874 | <0.001 | 0.0926 | 41.9 | Yes |
| CGP 51901 | IgG1 | [S24] | 0.950 | 0.702 | 0.0115 | 82.3 | 0.950 | 0.522 | 0.0307 | 73.8 | No |
| CNTO 5825 | IgG1 | [S25] | 0.902 | 0.832 | 0.0075 | 100.4 | 0.644 | 0.874 | 0.0182 | 100.5 | Yes |
| Conatumumab | IgG1 | [S26,S27] | 0.950 | 0.790 | 0.0038 | 87.2 | 0.774 | 0.854 | 0.0097 | 86.8 | Yes |
| CR002 | IgG1 | [S28] | 0.907 | 0.854 | 0.0049 | 114.2 | 0.746 | 0.874 | 0.0141 | 114.1 | Yes |
| Daclizumab | IgG1 | [S29,S30] | 0.950 | 0.263 | 0.0183 | 59.1 | 0.913 | < 0.001 | 0.0172 | 58.0 | Yes |
| Drozitumab | IgG1 | [S31] | 0.908 | 0.685 | 0.0146 | 107.1 | 0.614 | 0.627 | 0.0242 | 107.0 | Yes |
| F105 | IgG1 | [S32] | 0.950 | 0.633 | 0.0171 | 69.5 | 0.950 | 0.285 | 0.0257 | 67.5 | Similar |
| Galiximab | IgG1 | [S33,S34] | 0.950 | 0.672 | 0.0048 | 338.4 | 0.749 | 0.878 | 0.0169 | 318.8 | Yes |
| Ganitumab | IgG1 | [S35] | 0.950 | 0.584 | 0.0252 | 329.4 | 0.630 | 0.364 | 0.0345 | 328.7 | Similar |
| Gevokizumab | IgG2 | [S36] | 0.931 | 0.837 | 0.0067 | -20.1 | 0.757 | 0.834 | 0.0193 | -20.0 | Yes |
| GNbAC1 | IgG4 | [S37] | 0.915 | 0.831 | 0.0071 | 56.1 | 0.776 | 0.787 | 0.0189 | 53.9 | Yes |
| Golimumab | IgG1 | [S38,S39] | 0.950 | 0.793 | 0.0182 | 43.1 | 0.950 | 0.489 | 0.0457 | 52.8 | Yes |
| Hu12F6mu | IgG2 | [S40] | 0.950 | 0.427 | 0.0254 | -16.2 | 0.929 | < 0.001 | 0.0276 | -18.5 | Yes |
| Infliximab | IgG1 | [S41] | 0.990 | 0.924 | 0.0085 | 127.9 | 0.738 | 0.954 | 0.0572 | 127.9 | Yes |
| KB001 | Fab’ | [S42] | 0.950 | 0.753 | 0.0158 | 42.4 | 0.756 | 0.617 | 0.0355 | 42.1 | Similar |
| Lexatumumab | IgG1 | [S43] | 0.950 | 0.685 | 0.0140 | 216.8 | 0.950 | 0.445 | 0.0283 | 213.7 | Similar |
| Lumiliximab | IgG1 | [S44] | 0.962 | 0.780 | 0.0057 | 66.7 | 0.950 | 0.692 | 0.0125 | 64.8 | Similar |
| Gemtuzumab ozogamicin | IgG1 | [S45] | 0.950 | 0.638 | 0.0605 | -7.4 | 0.283 | < 0.001 | 0.0831 | -12.7 | Yes |
| MDX-1106 | IgG1 | [S46] | 0.950 | 0.899 | 0.0065 | 73.4 | 0.551 | 0.966 | 0.0150 | 78.4 | Yes |
| MEDI-528 | IgG4 | [S47] | 0.987 | 0.754 | 0.0054 | 113.4 | 0.942 | 0.735 | 0.0182 | 112.5 | Similar |
| MEDI-563 | IgG1 | [S48] | 0.950 | 0.826 | 0.0125 | 19.4 | 0.950 | 0.600 | 0.0334 | 18.1 | Similar |
| Mepolizumab | IgG1 | [S49] | 0.950 | 0.750 | 0.0085 | 64.5 | 0.950 | 0.591 | 0.0193 | 58.2 | No |
| MGAWN1 | IgG1 | [S50] | 0.950 | 0.915 | 0.0051 | 160.5 | 0.950 | 0.799 | 0.0226 | 161.5 | Similar |
| Mogamulizumab | IgG1 | [S51] | 0.950 | 0.378 | 0.0144 | 69.2 | 0.894 | 0.156 | 0.0157 | 68.7 | Yes |
| Natalizumab | IgG4 | [S52] | 0.950 | 0.565 | 0.0242 | 37.1 | 0.950 | 0.017 | 0.0287 | 35.9 | Yes |
| Obinutuzumab | IgG1 | [S53] | 0.946 | 0.870 | 0.0024 | 642.0 | 0.873 | 0.880 | 0.0095 | 642.0 | Yes |
| Ocrelizumab | IgG1 | [S54] | 0.950 | 0.706 | 0.0208 | 71.9 | 0.501 | 0.631 | 0.0345 | 71.4 | Yes |
| Pagibaximab | IgG1 | [S55] | 0.950 | 0.864 | 0.0022 | 34.1 | 0.950 | 0.826 | 0.0109 | 33.6 | Similar |
| PAmAb | IgG1 | [S56] | 0.950 | 0.779 | 0.0087 | 184.4 | 0.950 | 0.621 | 0.0224 | 180.2 | No |
| Panobacumab | IgM | [S57] | 0.950 | 0.732 | 0.0435 | 172.7 | 0.952 | 0.000 | 0.0729 | 164.0 | Yes |
| Pateclizumab | IgG1 | [S58] | 0.950 | 0.638 | 0.0144 | 76.7 | 0.848 | 0.441 | 0.0231 | 76.1 | Similar |
| PRO95780 | IgG1 | [S59] | 0.984 | 0.638 | 0.0124 | 107.7 | 0.575 | 0.702 | 0.0189 | 107.8 | Yes |
| Rilotumumab | IgG2 | [S60] | 0.950 | 0.699 | 0.0085 | 168.9 | 0.950 | 0.553 | 0.0194 | 167.5 | Similar |
| Rituximab | IgG1 | [S54] | 0.894 | 0.826 | 0.0118 | 73.2 | 0.680 | 0.644 | 0.0199 | 69.1 | No |
| Siltuximab | IgG1 | [S61] | 0.965 | 0.673 | 0.0115 | 281.0 | 0.950 | 0.467 | 0.0218 | 279.8 | Similar |
| Siplizumab | IgG1 | [S62] | 0.950 | 0.318 | 0.0560 | 4.8 | 0.770 | <0.001 | 0.1669 | -0.7 | Yes |
| Solanezuma | IgG1 | [S63] | 0.950 | 0.852 | 0.0068 | 98.2 | 0.950 | 0.666 | 0.0150 | 104.1 | Yes |
| TB-402 | IgG4 | [S64] | 0.950 | 0.681 | 0.0074 | 50.9 | 0.950 | 0.552 | 0.0154 | 49.9 | Similar |
| Tefibazumab | IgG1 | [S65] | 0.902 | 0.815 | 0.0093 | 102.0 | 0.644 | 0.819 | 0.0215 | 100.2 | Yes |
| Tigatuzumab | IgG1 | [S66] | 0.950 | 0.710 | 0.0005 | 108.0 | 0.876 | 0.749 | 0.0008 | 108.0 | Similar |
| Tremelimumab | IgG2 | [S67] | 0.954 | 0.541 | 0.0080 | 108.2 | 0.890 | 0.443 | 0.0116 | 107.2 | Similar |
| Urtoxazumab | IgG1 | [S68] | 0.957 | 0.766 | 0.0062 | 28.2 | 0.865 | 0.720 | 0.0157 | 27.5 | Similar |
| Vedolizumab | IgG1 | [S69] | 0.950 | 0.823 | 0.0062 | 281.3 | 0.950 | 0.701 | 0.0185 | 290.2 | Yes |
| Visilizumab | IgG2 | [S70] | 0.949 | 0.834 | 0.0152 | -35.2 | 0.567 | 0.806 | 0.0390 | -34.6 | Yes |
| HGS004 | IgG1 | [S71] | 0.983 | 0.601 | 0.0306 | 90.9 | 0.874 | 0.149 | 0.0433 | 93.4 | Yes |
| HuMV833 | IgG1 | [S72] | 0.981 | 0.936 | 0.0449 | 68.6 | 0.950 | 0.400 | very high | 69.3 | Similar |
| KBPA-101 | IgG1 | [S73] | 0.990 | 0.703 | 0.0361 | 88.9 | 0.950 | 0.125 | 0.0700 | 86.4 | Yes |
| R1507 | IgG1 | [S74] | 0.950 | 0.615 | 0.0134 | 74.2 | 0.950 | 0.377 | 0.0001 | 77.1 | Yes |
| Trastuzumab | IgG1 | [S75] | 0.950 | 0.636 | 0.0168 | 127.6 | 0.950 | 0.380 | 0.0335 | 126.3 | Similar |
| Tocilizumab | IgG1 | [S76] | 0.693 | 0.346 | 0.0368 | 96.8 | 0.215 | 0.048 | 0.0287 | 96.8 | Yes |
| Raxibacumab | IgG1 | [S77] | 0.950 | 0.802 | 0.0085 | 173.9 | 0.950 | 0.648 | 0.0241 | 171.2 | Similar |
| Panitumumab | IgG2 | [S78] | 0.950 | 0.781 | 0.0164 | 67.4 | 0.950 | 0.509 | 0.0461 | 66.5 | Similar |
| Cetuximab | IgG1 | [S79] | 0.999 | 0.650 | 0.0322 | 106.0 | 0.950 | 0.154 | 0.0560 | 104.0 | Yes |
References provided in Supplementary Materials.
Value of objective function in ADAPT-V.
Three categories are defined in text.
0.95 for σ1 was a fixed value.
Table 2.
Monoclonal antibodies that failed in model application.
| Antibodies | Type | Ref a | Fittings or estimated parameters | Speculative reasons |
|---|---|---|---|---|
| Afelimomab | (Fab)2 | [S80] | over-prediction of initial phase, tiny σ1 and σ2 | nonspecific binding in blood |
| AHM | IgG1 | [S81] | over-prediction of initial phase, tiny σ1 and σ2 | nonspecific binding in blood |
| Bavituximab | IgG1 | [S82] | over-prediction of initial phase, tiny σ1 and σ2 | nonspecific binding in blood |
| Intetumumab | IgG1 | [S83] | over-prediction of initial phase, tiny σ1 and σ2 | nonspecific binding in blood |
| Roledumab | IgG1 | [S84] | over-prediction of initial phase, tiny σ1 and σ2 | nonspecific binding in blood |
| SB 249417 | IgG1 | [S85] | over-prediction of initial phase, tiny σ1 and σ2 | nonspecific binding in blood |
| Anti-IL-12p40 | IgG1 | [S86] | σ1< σ2 for both clearance mechanisms | unknown |
| Ipilimumab | IgG1 | [S87] | under-prediction of initial phase | measurement error |
| MDX-1303 | IgG1 | [S88] | under-prediction of initial phase | measurement error |
| Ponezumab | IgG2 | [S89] | under-prediction of initial phase | measurement error |
| Sirukumab | IgG1 | [S90] | σ1< σ2 for both clearance mechanisms | unknown |
References provided in Supplementary Materials
Two clearance mechanisms CLi and CLp were tested and compared in terms of model performance and parameter estimates. Three categories were defined to indicate the preference for Model A with CLp for the overall clearance: “Yes”, “Similar”, and “No”. Based on the results obtained from the model with CLp, “Yes” was defined by either better model performance in comparison with the model with CLi (ΔObj < - 3.0), or the model with CLi resulted in unreasonable estimated parameters, such as σ1 < σ2 or with minute σ values; “Similar” was defined by comparable model performance with reasonable parameter estimates; “No” was defined by poorer model performance (ΔObj > 3.0) than the model with CLi and less reasonable parameter estimates.
All fittings utilized the maximum likelihood method in ADAPT 5 [18] and naïve pooled data modeling. The variance model was:
| (10) |
where: Vi is the variance of the response at the ith time point, ti is the actual time at the ith time point, and Y(ti) is the predicted response at time ti from the model. Variance parameter intercept and slope were estimated together with system parameters.
Model performance was evaluated by goodness-of-fittings, visual inspection, sum of square residuals, Akaike Information Criterion (AIC), Schwarz Criterion (SC), and Coefficient of Variation (CV) of the estimated parameters.
Results
The second-generation mPBPK model provides a modeling approach specifically for PK analysis of mAbs. The model, with several assumed physiologic parameters and fitting only plasma concentration vs time data, provides estimations of average vascular reflection coefficients (σ1 and σ2) and assesses the possible location of predominant clearance in either plasma or ISF. Values of TER were calculated from the estimated σ1 and σ2 values (Eq. (7)) to reflect the overall vascular permeability. The equilibrium concentration ratio (ISF / Plasma) was predicted based on the estimated σ (Eq. (8)) and clearance values (Eq. (9)). Literature data for 83 mAbs with linear PK were analyzed with this modeling approach. Of these mAbs, 72 mAb PK profiles were well-captured with reasonable parameter estimates (Table 1). Representative plasma concentration versus time profiles are shown for 9 mAbs in Figure 2. Additional fitted mAb profiles were shown in our previous publication [9]. Eleven mAbs failed with this model due to several speculative reasons (Table 2).
Figure 2.
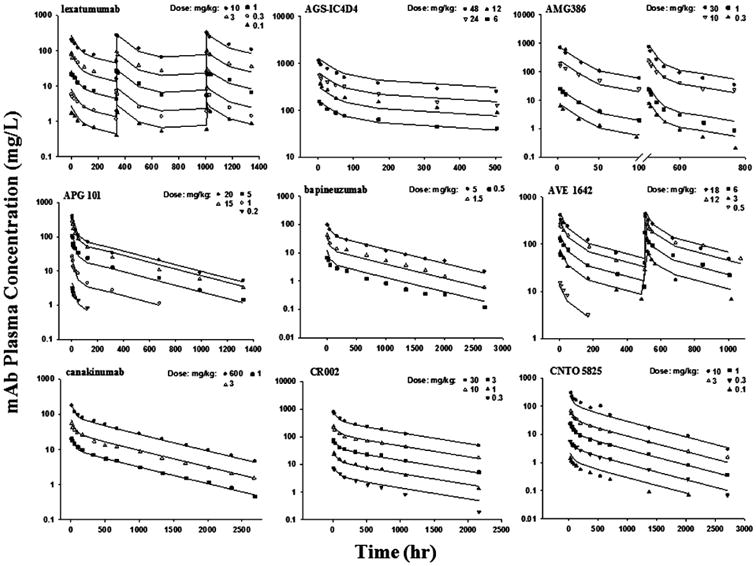
Pharmacokinetic profiles of 9 monoclonal antibodies in human subjects. Symbols are observations and curves are mPBPK model fittings.
Single or several dose profiles were characterized (Figure 2) and all parameters were estimated with reasonable precision (CV% < 50%) for the 72 well-captured mAbs (Table 1). In the model with CLp, the estimated σ1 ranged from 0.693 to 0.999 with an average of 0.945 and σ2 ranged from 0.202 to 0.984 with an average of 0.697. The grouped σ1 values showed lower inter-antibody variability (CV% = 3.67%) than σ2 (CV% =16.9%) (Figure 3). Some mAbs did not have sufficient data to support a clear identification of σ1 different from 1, which resulted in an estimate of σ1 as 1 (the physiological limit). In those cases, σ1 was fixed to 0.95, the average value from the other mAbs with precise estimates of σ1. No correlation (r2 = 0.038) was found between σ1 and σ2 for the surveyed mAbs. The estimated values of CLp ranged 0.517 – 66.4 mL/hr/70 kg with high inter-antibody variability (Figure 3). The average CLp was 17.6 ± 15.0 mL/hr/70 kg. Of note, 9 mAbs (13%) showed relatively high clearance (> 35 mL/hr/70 kg).
Figure 3.
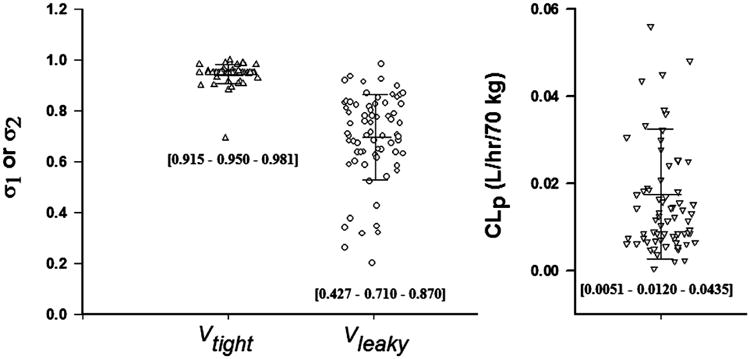
The estimated parameters of 72 monoclonal antibodies using the second-generation minimal PBPK model for the reflection coefficients (σ1 and σ2) for two groups of tissues (Vtight and Vleaky) using the model when CLp applies. Bars indicate mean and standard deviation. Numbers in brackets are [10% - 50% - 90%] percentiles.
Surprisingly, 11 mAbs failed in application of this model with either inadequately captured PK profiles or unreasonable parameter estimates. Table 2 lists these mAbs and provides the possible reasons. Figure 4 displays two representative suboptimal cases. For most of these mAbs, the mPBPK model had difficulties in capturing the initial phase (early α-phase). Given the fact that the mPBPK model assumes actual plasma volume as the initial distribution space, the under-prediction of the initial phase with such model assumption is unexpected and may be caused either by measurement error or blood collection from the infusion tubing in the original study. The over-prediction was speculated due to appreciable nonspecific binding of mAb in blood, a mechanism not included in the mPBPK model.
Figure 4.
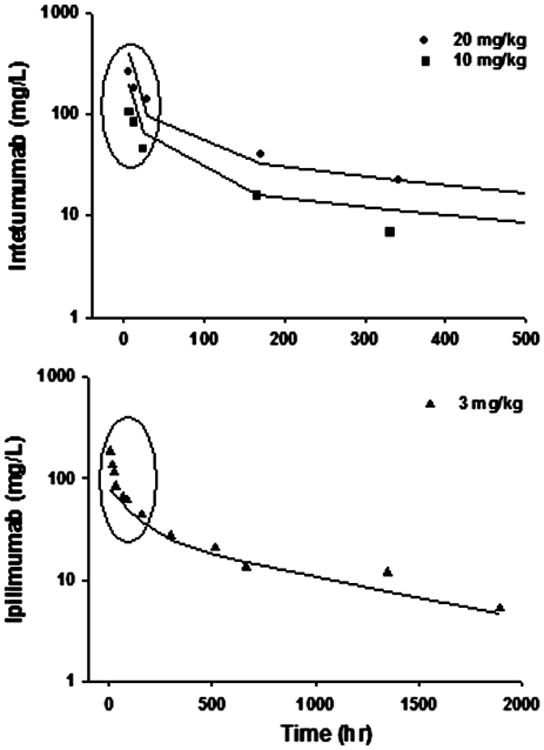
Profiles of two representative monoclonal antibodies where the minimal PBPK model was suboptimal. The circles highlight the primary mis-fitted data points.
As indicated in Eq (8), the vascular reflection coefficients affect not only TER but also ISF concentrations. High TER values anticipate high ISF concentrations. Figure 5 displays the ISF / Plasma concentration ratios for Vleaky and Vtight that were calculated for all 72 mAbs listed in Table 1. The average ratios for Vtight were about 6.8% and for Vleaky about 37.9%. Six antibodies (tocilizumab, APG101, daclizumab, siplizumab, AMG386, aflibercept) had equilibrium ratios in Vleaky higher than 81%, indicating relatively high vascular permeability and probably rapid distribution of these mAbs into tissues with leaky endothelium.
Figure 5.
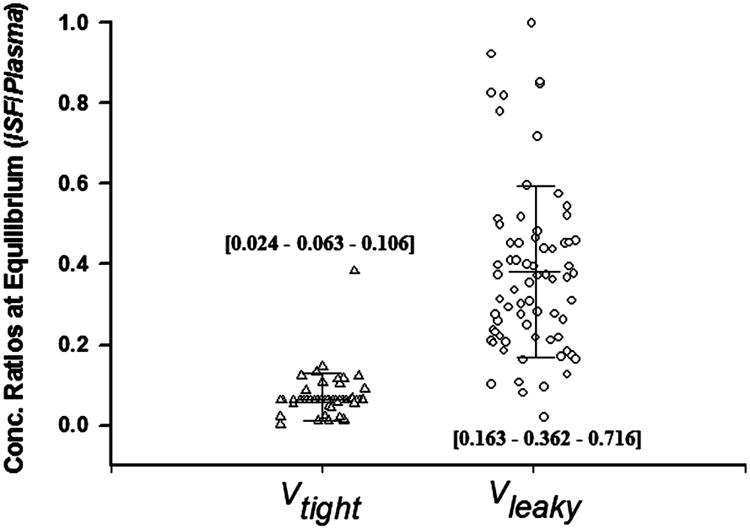
Predicted mAb concentration ratios of interstitial fluid (ISF): plasma at equilibrium using the model with CLp. Bars depict mean and standard deviation. Numbers in brackets are [10% - 50% - 90%] percentiles.
Comparisons of Clearances
Table 1 lists the occurrence of model-based preference for a predominant CLp that was implied by this modeling approach: 37 mAbs (51%) are “Yes”, 5 mAbs (7%) are “No”, and 30 mAbs (42%) are “Similar”. In the “Yes” group, the model with CLp showed better model performance for 6 mAbs and the model with CLi resulted in unreasonable parameter estimates (either σ1 < σ2 or very small σ) for the remaining 31 mAbs. In the “No” group, the model with CLp showed worse model performance in comparison with model with CLi. There are 30 mAbs in the “Similar” group that showed similar model performance and both models gave reasonable parameter estimates. Thus, for 93% of the well-fitted antibody PK profiles, the model with CLp is either preferred or equivalent to that with CLi.
Interestingly, as shown in Figure 6, many of the mAbs in the “Yes” group appeared to have higher clearances than the mAbs in the “Similar” group (p = 0.035), which suggests that the mAbs with relatively high clearance are more likely degraded or eliminated from plasma rather than from ISF. No statistical difference in clearances was detected between the mAbs in the “Yes” group and “No” group, probably because of the limited numbers in the latter group.
Figure 6.
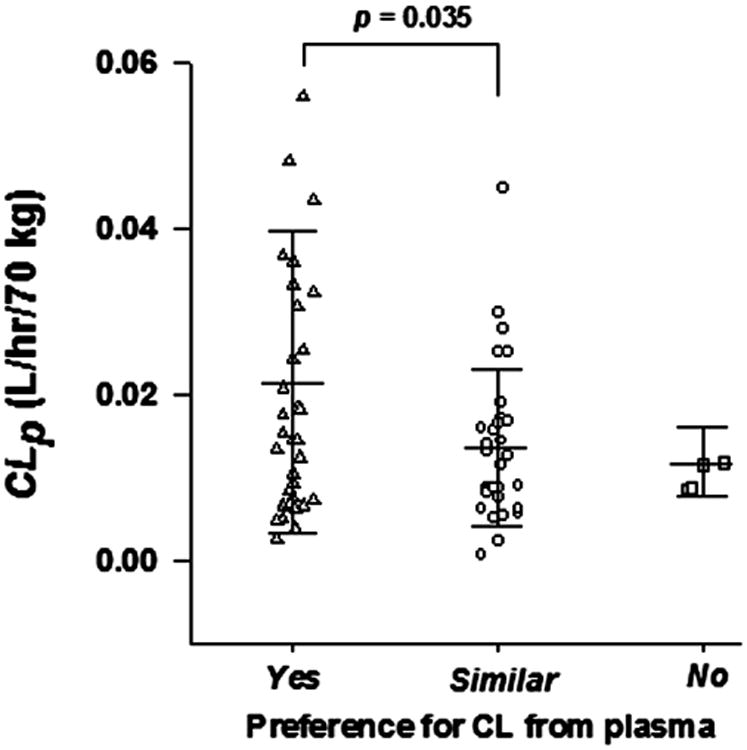
The estimated plasma clearance (CLp) of monoclonal antibodies in groups with “Yes” “Similar” and “No” preference for fittings with plasma clearance (CLp). Three categories are defined in the text. The student t-test was applied.
Distribution (TER) vs CLp
The estimated TER values were in the range of 1.70 – 66.6 mL/hr/70 kg. As shown in Figure 7, the estimated TER is about 2.5-fold higher than CLp values and TER positively correlated with CLp (r2 = 0.336). As mentioned before, higher TER generally produces higher ISF concentrations in this modeling context. Thus, such correlation also reflects a relationship between ISF distribution extent and CLp. This provides further evidence in support of previous observations that enhancement of tissue distribution usually results in an increase in systemic clearance [19]. The mAbs with the highest clearances were not included in the regression and correlation analysis. No statistical difference was detected in comparison of the TER values for the high CLp mAbs versus other mAbs (0.032 vs 0.026, p = 0.28). HuMv833 and gemtuzumab ozogamicin were mAbs as exceptions with fast clearance but relatively small TER.
Figure 7.
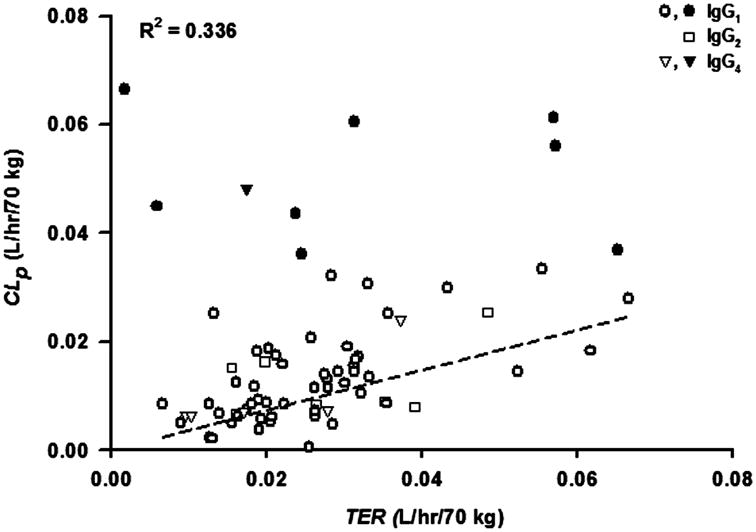
Correlation between plasma clearance (CLp) and Transcapillary Escape Rate (TER). The linear regression line (forced through (0,0); slope = 0.37) and correlation coefficient are shown for mAbs with CLp < 0.035 L/hr/70 kg. Solid symbols: clearance > 0.035 L/hr/70 kg; open symbols: clearance < 0.035 L/hr/70 kg.
As shown in Figure 7, the type of immunoglobulin did not appear to affect the TER or CLp values, as the values for mAbs that were IgG2 or IgG4 were dispersed within the data for IgG1 mAbs.
Discussion
The mPBPK model provides a consistent and mechanistic approach for analyzing PK profiles for mAb and allows systematic comparisons of their elimination and distributional properties. By fitting only plasma data, the mPBPK model provides assessments regarding: 1) predominant clearance site, plasma or ISF; 2) ISF concentrations in two groups of lumped tissues, Vleaky and Vtight; 3) TER, an indicator of systemic vascular permeability. Many of these issues could not be easily addressed experimentally, but sometimes are essential for therapeutic mAb development and optimization. Therefore, the mPBPK model appears to be preferable for mAb PK analysis than the commonly used 2CM to address these critical issues when fitting only plasma data.
This survey indicated that an assumption of CLp provides better or at least equal model performance than does CLi for 93% of the surveyed mAbs. It can be seen in Table 1 that Model A with CLp produces highly consistent values of σ1 and σ2 while Model B produces highly variable results. This may further suggest that CLp reflects the most common nonspecific clearance mechanism for most mAbs. As stated in our previous analysis [9], the linear clearance in this model context mostly represents the nonspecific clearance and such a clearance preference may be not directly associated with target location. From a mechanistic perspective, the degradation in endothelial lysosomes contributes to CLp in this model framework given the efficient endocytosis that allows rapid uptake of mAb into endothelial endosomes and the rapid ‘equilibrium’ between endothelial endosomes and plasma [20]. Although the functioning of FcRn was not enacted in this model, a higher FcRn affinity would reduce mAb lysosome degradation and anticipate a lower estimate of CLp (data not shown). Then, for mAbs with a dominant CLp, it may be of pharmacokinetic and therapeutic value to design features to increase systemic persistence via an improved FcRn-binding affinity. If CLi is dominant, less efficiency is expected by this strategy. The present model allows assessment of the two clearance mechanisms and may help new mAb development strategy in this regard.
It should be clarified that a preference for CLi or CLp suggested by the model does not necessarily exclude the existence of the other. Both CLi and CLp processes could more or less exist. The use of model fitting for such discrimination should be followed by direct experimental validation, if possible, when this is an important issue. As shown in Table 2, modeling alone is often inadequate to differentiate the two clearance mechanisms.
Interestingly, the mAbs that were associated with a preferred CLp tend to have higher clearance than the others (Figure 6). This could be related to their limited vascular permeability. Simulations of PK profiles with high values of CLi provide a further explanation for this, as the plasma profiles and apparent plasma clearance would not further change when CLi was set higher than TER. This is because the apparent plasma clearance would not go any higher than TER if the predominant clearance occurs in ISF. It is a similar principle to the well-stirred hepatic clearance model where the apparent plasma clearance would be largely restricted by blood flow and become less dependent on intrinsic clearance when intrinsic clearance is much higher than blood flow. Therefore, it is expected that, when a mAb has a high apparent plasma clearance, particularly a clearance higher than distribution clearance (TER), it would become less likely to have a predominant CLi. This also explains why the mAbs with high clearances (> 35 mL/hr/70 kg) were more often associated with a model-preferred CLp (Table 1).
Many factors have been found to influence mAb tissue distribution and systemic clearance [21], including size, shape, hydrophobicity, and charge. The mPBPK model supports a positive correlation between tissue distribution and systemic clearance (Figure 7), but the isotype of the immunoglobulins was not a factor. The TER vs CLp correlation poses a challenge in selection of strategies for improving tissue distribution to enhance target site exposure as the systemic clearance would probably increase consequently and offset the improved distribution. An increase of net positive charge has shown to increase both tissue retention and systemic clearance [19]. The effect of molecular size was also investigated in this scenario showing that a larger molecule would generally result in lower tissue penetration with reduced systemic clearance [22]. An optimum probably exists when putting all these factors together to consider a general balance between distribution and clearance. Whatever factors contribute to this, this positive correlation seems not applicable to mAbs with high clearances (> 35 mL/hr/70 kg), implying that the factors contributing to high clearance may not necessarily increase tissue distribution and penetration, in contrast with most mAbs and other macromolecules.
Our results and conclusions should be considered with some caution. Firstly, the fitting results for each mAb (Table 1) should be interpreted within the specific study conditions where the data were originally collected. For instance, some mAbs, such as rituximab [23] and cetuximab [24], display nonlinear PK in certain populations while our assessment only considered the subjects and dose ranges with linear PK. Secondly, the model did not take account of immunogenicity, differing measurement assays and variability, and concomitant medications. These factors could potentially impact mAb PK and result in different model fittings and parameter estimates. In addition, the data digitization and model fittings utilized the available average PK profiles and thus the parameter estimates are approximate. Other cautions relate to the model assumptions regarding the available fraction of ISF for mAb distribution, convection as the major extravasation mechanism, assuming the same CLi in Vleaky and Vtight, and use of standard physiological constants. However, our assumptions allowed a simple and consistent starting point and allowed a global comparison among studies.
The present modeling approach can be useful in generally assessing mAb PK and in drug development. While further examination of structural features contributing to the variability in TER and CLp values seen in Figure 7 is warranted, application of this model will provide an indication of whether the properties of a new mAb resemble most others, particularly for a related indication. Inconsistencies such as we noted in Table 2 may warrant more careful analytical or clinical evaluation. The model provides approximate ISF concentrations and can be readily extended to handle target-mediated drug disposition and dynamics [25]. If utilized for population analysis, physiologic features can be more easily incorporated for model components.
In conclusion, this study successfully applied the mPBPK model to extensively survey literature available mAb PK in man and clearly demonstrated the feasibility of this model as a general approach in mAb PK analysis. The estimated parameters reflect many intrinsic distributional and elimination insights and relations. Although the reductionist feature of the mPBPK model was emphasized in our previous publications [8, 9], specific considerations of other kinetic mechanisms, such as target-mediated drug disposition [25], formation of anti-drug antibodies, and target kinetics are also feasible in this modeling framework. This mPBPK model offers a more mechanistic approach using the major structural features of full PBPK models for mAbs in specifically analyzing mAb PK than found in compartment models and provides an intermediary method if a full PBPK model is not available.
Supplementary Material
Acknowledgments
This research was supported by the National Institutes of Health Grant GM57980 and the UB Center for Protein Therapeutics.
References
- 1.Reichert JM. Marketed therapeutic antibodies compendium. MAbs. 2012;4:413–415. doi: 10.4161/mabs.19931. [DOI] [PMC free article] [PubMed] [Google Scholar]
- 2.Sliwkowski MX, Mellman I. Antibody therapeutics in cancer. Science. 2013;341:1192–1198. doi: 10.1126/science.1241145. [DOI] [PubMed] [Google Scholar]
- 3.Chan AC, Carter PJ. Therapeutic antibodies for autoimmunity and inflammation. Nat Rev Immunol. 2010;10:301–316. doi: 10.1038/nri2761. [DOI] [PubMed] [Google Scholar]
- 4.Lin JH, Lu AY. Role of pharmacokinetics and metabolism in drug discovery and development. Pharmacol Rev. 1997;49:403–449. [PubMed] [Google Scholar]
- 5.Wang W, Wang EQ, Balthasar JP. Monoclonal antibody pharmacokinetics and pharmacodynamics. Clin Pharmacol Ther. 2008;84:548–558. doi: 10.1038/clpt.2008.170. [DOI] [PubMed] [Google Scholar]
- 6.Richter WF, Grimm HP, Theil FP. Potential errors in the volume of distribution estimation of therapeutic proteins composed of differently cleared components. J Pharmacokinet Pharmacodyn. 2011;38:581–593. doi: 10.1007/s10928-011-9209-1. [DOI] [PubMed] [Google Scholar]
- 7.Garzone PD, Atkinson AJ., Jr In search of physiologically based distribution volume estimates for macromolecules. Clin Pharmacol Ther. 2012;92:419–421. doi: 10.1038/clpt.2012.156. [DOI] [PubMed] [Google Scholar]
- 8.Cao Y, Jusko WJ. Applications of minimal physiologically-based pharmacokinetic models. J Pharmacokinet Pharmacodyn. 2012;39:711–723. doi: 10.1007/s10928-012-9280-2. [DOI] [PMC free article] [PubMed] [Google Scholar]
- 9.Cao Y, Balthasar JP, Jusko WJ. Second-generation minimal physiologically-based pharmacokinetic model for monoclonal antibodies. J Pharmacokinet Pharmacodyn. 2013;40:597–607. doi: 10.1007/s10928-013-9332-2. [DOI] [PMC free article] [PubMed] [Google Scholar]
- 10.Sarin H. Physiologic upper limits of pore size of different blood capillary types and another perspective on the dual pore theory of microvascular permeability. J Angiogenes Res. 2010;2:14. doi: 10.1186/2040-2384-2-14. [DOI] [PMC free article] [PubMed] [Google Scholar]
- 11.Garg A, Balthasar JP. Physiologically-based pharmacokinetic (PBPK) model to predict IgG tissue kinetics in wild-type and FcRn-knockout mice. J Pharmacokinet Pharmacodyn. 2007;34:687–709. doi: 10.1007/s10928-007-9065-1. [DOI] [PubMed] [Google Scholar]
- 12.Shah DK, Betts AM. Towards a platform PBPK model to characterize the plasma and tissue disposition of monoclonal antibodies in preclinical species and human. J Pharmacokinet Pharmacodyn. 2012;39:67–86. doi: 10.1007/s10928-011-9232-2. [DOI] [PubMed] [Google Scholar]
- 13.Wagshul ME, Johnston M. The brain and the lymphatic system. Immunology of the Lymphatic System. 2013:143–164. [Google Scholar]
- 14.Davies B, Morris T. Physiological parameters in laboratory animals and humans. Pharm Res. 1993;10:1093–1095. doi: 10.1023/a:1018943613122. [DOI] [PubMed] [Google Scholar]
- 15.Stucker O, Pons-Himbert C, Laemmel E. Towards a better understanding of lymph circulation. Phlebolymphology. 2008;15:31–36. [Google Scholar]
- 16.Wiig H, Tenstad O. Interstitial exclusion of positively and negatively charged IgG in rat skin and muscle. Am J Physiol Heart Circ Physiol. 2001;280:H1505–1512. doi: 10.1152/ajpheart.2001.280.4.H1505. [DOI] [PubMed] [Google Scholar]
- 17.Wiig H, Kaysen GA, al-Bander HA, De Carlo M, Sibley L, Renkin EM. Interstitial exclusion of IgG in rat tissues estimated by continuous infusion. Am J Physiol. 1994;266:H212–219. doi: 10.1152/ajpheart.1994.266.1.H212. [DOI] [PubMed] [Google Scholar]
- 18.D'Argenio DZ, Schumitzky A. ADAPT V User's Guide: Pharmacokinetic/Pharmacodynamic System Analysis Software Biomedical Simulations Resource. Los Angeles CA: 2009. [Google Scholar]
- 19.Boswell CA, Tesar DB, Mukhyala K, Theil FP, Fielder PJ, Khawli LA. Effects of charge on antibody tissue distribution and pharmacokinetics. Bioconjug Chem. 2010;21:2153–2163. doi: 10.1021/bc100261d. [DOI] [PubMed] [Google Scholar]
- 20.Davies PF, Ross R. Mediation of pinocytosis in cultured arterial smooth muscle and endothelial cells by platelet-derived growth factor. J Cell Biol. 1978;79:663–671. doi: 10.1083/jcb.79.3.663. [DOI] [PMC free article] [PubMed] [Google Scholar]
- 21.Bumbaca D, Boswell CA, Fielder PJ, Khawli LA. Physiochemical and biochemical factors influencing the pharmacokinetics of antibody therapeutics. AAPS J. 2012;14:554–558. doi: 10.1208/s12248-012-9369-y. [DOI] [PMC free article] [PubMed] [Google Scholar]
- 22.Schmidt MM, Wittrup KD. A modeling analysis of the effects of molecular size and binding affinity on tumor targeting. Mol Cancer Ther. 2009;8:2861–2871. doi: 10.1158/1535-7163.MCT-09-0195. [DOI] [PMC free article] [PubMed] [Google Scholar]
- 23.Golay J, Semenzato G, Rambaldi A, Foa R, Gaidano G, Gamba E, Pane F, Pinto A, Specchia G, Zaja F, Regazzi M. Lessons for the clinic from rituximab pharmacokinetics and pharmacodynamics. MAbs. 2013;5:826–837. doi: 10.4161/mabs.26008. [DOI] [PMC free article] [PubMed] [Google Scholar]
- 24.Tan AR, Moore DF, Hidalgo M, Doroshow JH, Poplin EA, Goodin S, Mauro D, Rubin EH. Pharmacokinetics of cetuximab after administration of escalating single dosing and weekly fixed dosing in patients with solid tumors. Clin Cancer Res. 2006;12:6517–6522. doi: 10.1158/1078-0432.CCR-06-0705. [DOI] [PubMed] [Google Scholar]
- 25.Cao YG, Jusko WJ. Incorporating target-mediated drug disposition in a minimal physiologically-based pharmacokinetic model for monoclonal antibodies. J Pharmacokinet Pharmacodyn. 2014 doi: 10.1007/s10928-014-9372-2. in press. [DOI] [PMC free article] [PubMed] [Google Scholar]
Associated Data
This section collects any data citations, data availability statements, or supplementary materials included in this article.


