Abstract
The somatic mutations present in the genome of a cell have been accumulated over the lifetime of a multicellular organism. These mutations can provide insights into the developmental lineage tree1, the number of divisions each cell has undergone and the mutational processes that have been operative2. Here, we conducted whole genome sequencing of clonal lines3 derived from multiple tissues of healthy mice. Using somatic base substitutions, we reconstructed the early cell divisions of each animal demonstrating the contributions of embryonic cells to adult tissues. Differences were observed between tissues in the numbers and types of mutations accumulated by each cell, which likely reflect differences in the number of cell divisions they have undergone and varying contributions of different mutational processes. If somatic mutation rates are similar to those in mice, the results indicate that precise insights into development and mutagenesis of normal human cells will be possible.
Somatic mutations in normal cells from multicellular organisms can provide insights into the origins and past experiences of each cell4. The developmental lineages of individual cells may be reconstructed, as previously explored in studies using insertion/deletion mutations at short tandem repeats1,5-11 (Supplementary Discussion A). Complete reconstruction of the bifurcating cell division tree requires at least one somatic mutation in the two daughter cells arising from each cell division. If mutations are generated during mitotic DNA replication, the number of divisions a cell has undergone may be reflected in the number of mutations present6,9. Finally, the processes of DNA damage and/or repair experienced by different cell types may manifest in distinct mutational signatures within the catalogues of mutation in each cell2.
Single cell whole genome DNA sequencing has the potential to elucidate these aspects of the biology of normal cells. However, technologies are still under development12 and are often characterised by incomplete genome coverage, suboptimal mutation sensitivity and substantial error rates for most mutation types. Errors mislead lineage reconstruction, distort mutational signatures and cause mis-estimation of numbers of mitoses undergone.
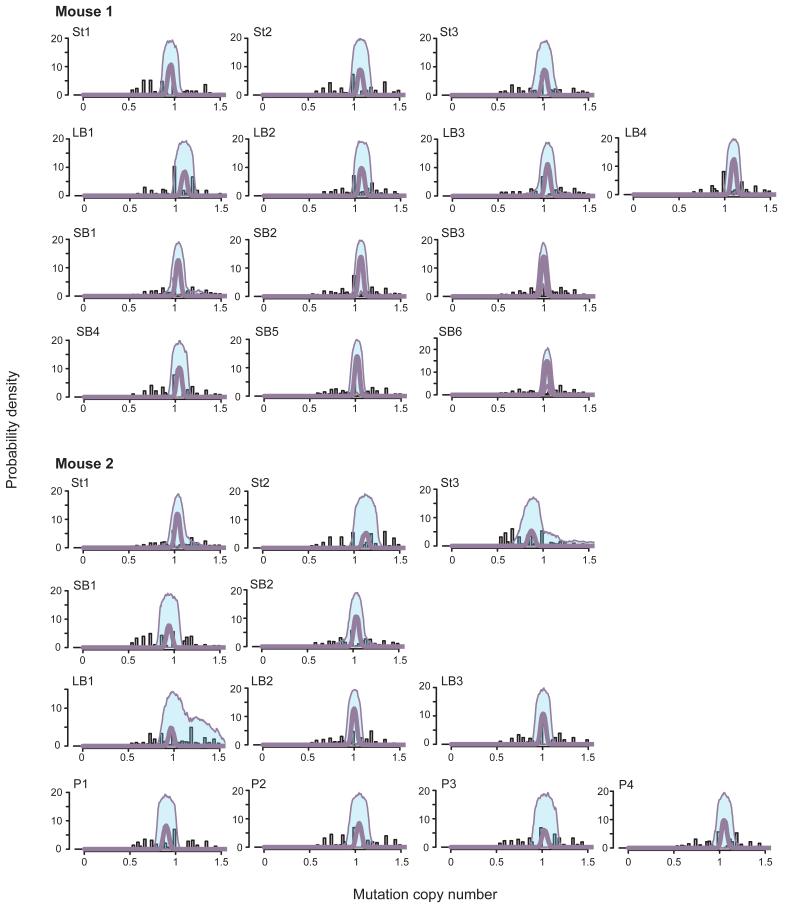
We therefore derived clonal lines from normal mouse cells using organoid technology3,13-17 as an alternative to single cell analysis. Twenty-five organoid lines were obtained from the stomach, small bowel and large bowel of two mice (Mouse 1 aged 116 and Mouse 2 aged 98 weeks) and from the prostate of Mouse 2 (Supplementary Table 1). The whole genome was sequenced of each line and the polyclonal tail of each mouse, and extensive validation was performed to obtain high quality catalogues of somatic mutations. Following alignment to the reference mouse genome, sets of somatic base substitution mutations were obtained by comparing each single cell clone with all other clones from the same mouse, and with the tail (see Methods). Analyses of read count frequencies of the somatic substitutions indicated that they were heterozygous and that very few subclonal mutations, which may have arisen in vitro, were captured (Extended data figure 1, Supplementary Discussion B).
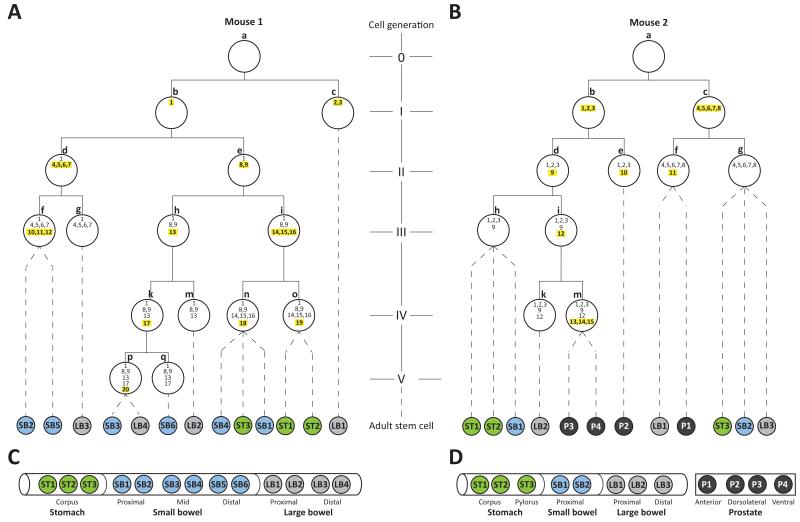
To reconstruct the early developmental lineage tree of each mouse we searched for mutations present in at least two organoids and absent from at least one, applying computational and manual approaches (Methods, Extended data figures 2 and 3). All such putative early embryonic mutations were further assessed by re-sequencing in every organoid, yielding 35 from the two mice (Supplementary Table 2). The phylogenetic lineage was then developed into a hypothetical tree of early embryonic cell divisions (Methods, Extended data figure 3). Of the 23 cell divisions requiring reconstruction to generate a simple bifurcating tree for all the individual cell clones from both mice, 17 were reconstructable and six were not (Figure 1, Extended data figure 4). Thus the intrinsic substitution mutation rate per cell division in early mouse embryos is almost sufficient to reconstruct the tree. Mutations defining the first four cell generations were found in the tails of the two mice confirming that they occurred prior to formation of the three germ layers during gastrulation since they were present in endoderm (the precursor of tissues from which the clonal organoids were derived) and either/both mesoderm and ectoderm (which contribute to the tail).
Figure 1. Reconstructed phylogenetic trees of cells from early mouse embryos.
(A) Mouse 1. (B) Mouse 2. Each white-filled large circle represents an embryonic cell that is defined by a unique combination of mutations. Each mutation is represented by a number inside the white circles. Yellow highlighted numbers: mutations acquired during most recent mitosis. Letters next to white circles: identifiers of each embryonic cell. Roman numerals indicate each reconstructed cell generation. Colour-filled smaller circles represent individual organoids derived from different anatomical regions (C, D). Dotted lines connect each organoid with its last identifiable embryological precursor. An unknown number of cell generations lies between each organoid and its last identifiable embryological precursor.
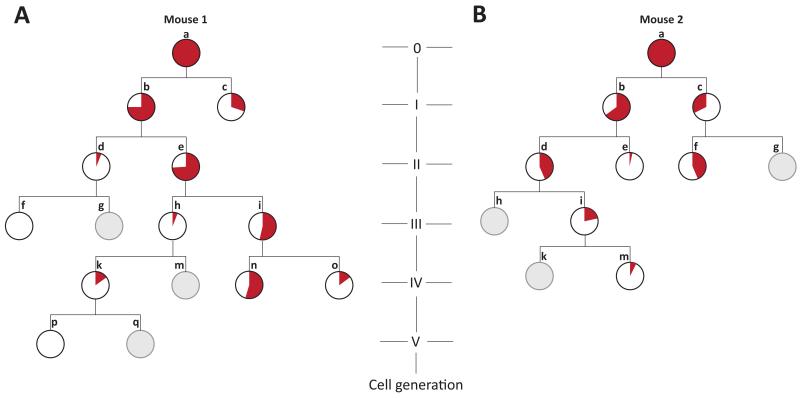
The earliest reconstructed cell division in each tree may represent the first division of the fertilised egg. However, it is possible that earlier cell divisions took place generating daughter cells which were not ancestors of any of the 25 single cells sampled in the two mice. To assess this possibility, we examined the sequencing read counts of mutations in the putative first two daughter cells (Generation I, cells ‘b’ and ‘c’) in the polyclonal tail samples of each mouse. Although we cannot exclude a small proportion being from earlier progenitors, the results are compatible with all cells in the tail samples being derivatives of the two earliest reconstructed cells in each mouse, and therefore that this first reconstructed cell division represents division of the fertilised egg (Figure 2). It is also possible that daughter cells from earlier cell divisions did not contribute at all to the adult mice. If so, we would be unable to detect their existence.
Figure 2. Contributions of early embryonic cells to adult tail cell populations.
Early embryonic phylogenetic trees of cells, as in Figure 1. The proportional contribution of each embryonic precursor cell to the population of cells in the tail is represented by the proportion of the circle area coloured red. This contribution was determined by assessment of the read count, in the tail, of the most recently acquired mutation(s) in each early embryo cell. Grey embryonic precursor cells did not acquire new mutations in the most recent mitosis, so their contributions to the tail cannot be directly measured.
Several features of normal mouse development can be extracted from these reconstructions. The two daughter cells of early embryonic cell divisions often contribute unequally to adult tissues. For example, one of the daughter cells in the first generation of reconstructed cell divisions in Mouse 1 (cell ‘b’; Figure 1A) is the progenitor for 12 organoid clones, while the other is the progenitor of just one (cell ‘c’). Examination of the tail from this animal using the sequencing read counts of the mutations found in the first two daughter cells, again shows unequal contributions of the two progenitors, ~75% from one and ~30% from the other (cells ‘b’ and ‘c’, Figure 2A). A similar degree of inequality of contribution is shown for the first reconstructed cell division of Mouse 2 (cells ‘b’ and ‘c’; Figure 2B). These observations are consistent with results obtained by other approaches18,19. Of note, this asymmetry propagates beyond the first cell division in both mice (Figure 2).
At these early stages of embryo development, individual cells contribute to multiple tissues. For example, at least three of the four reconstructed cells from the two mice at Generation I are ancestors of all tissues sampled, including tail, and thus likely contribute to endoderm, mesoderm and ectoderm (Mouse 1, cell ‘b’; Mouse 2, cells ‘b’ and ‘c’; Figure 1A, 1B, 2A and 2B). A similarly broad tissue contribution is made by at least one reconstructed cell which has undergone two cell divisions (Mouse 2, cell ‘d’; Fig 1B). Cell ‘i’, which has undergone three cell divisions in Mouse 2, is the progenitor of prostate and large bowel cells and cells in tail tissues. The most distant early embryonic cells from the fertilised egg that we can reconstruct have undergone five cell divisions (Mouse 1, cells ‘p’ and ‘q’; Figure 1A) and one of these contributes both to the distal colon and mid small intestine. Similarly, each organ derives from multiple early embryonic progenitor cells. For example, prostate in Mouse 2 is contributed to by both reconstructed cells in Generation I (cells ‘b’ and ‘c’; Figure 1B) and by at least three of the four cells in Generation II (cells ‘d’, ‘e’ and ‘f’; Figure 1B).
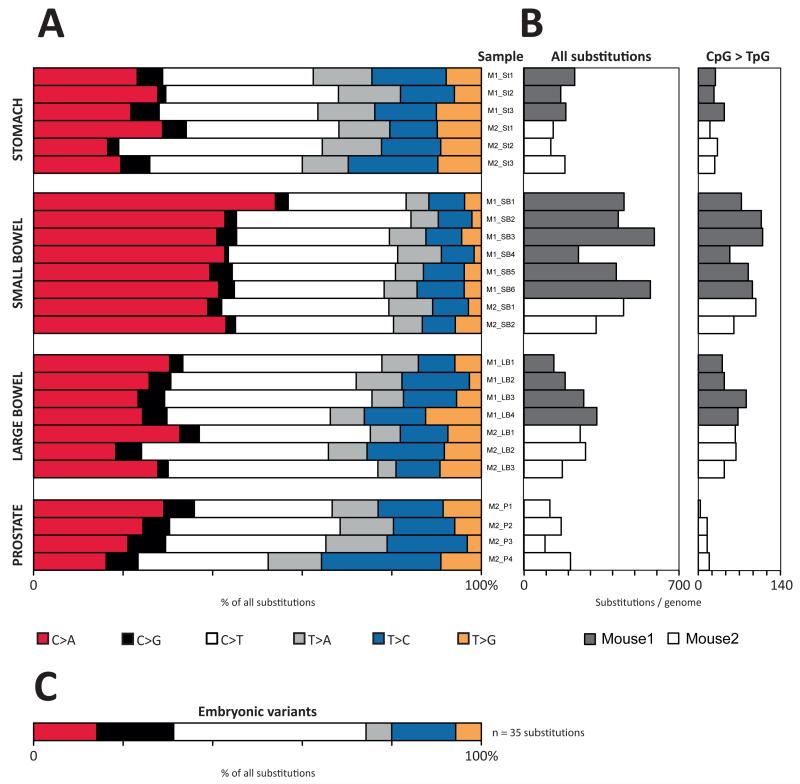
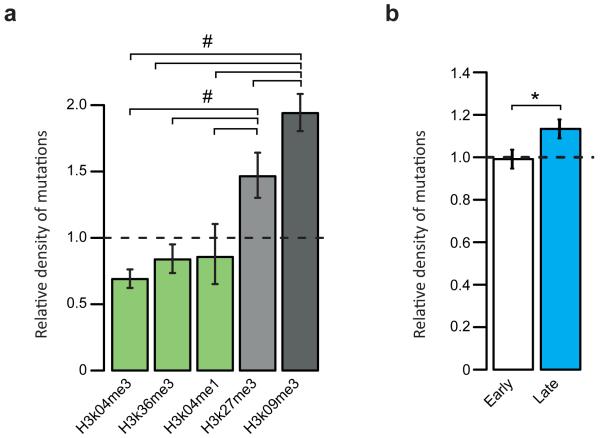
Mutations in individual cells can also provide insights into the number of cell divisions and the mutational processes that have been operative in normal tissues. To explore these questions, we extracted 25 sets of somatic substitutions (in total 6714) unique to individual clones (with a true positive rate of 92%, as assessed by validation of 743 variants, and a mean sensitivity of 50% for detecting heterozygous substitutions (Supplementary Table 1)). Of the four tissues sampled, small bowel stem cells have acquired significantly more base substitutions than any other tissue, and prostate and stomach the fewest (Figure 3B; Methods for explanation of statistical test and p-values). This remains the case if the analysis is restricted to C>T substitutions at CpG dinucleotides which are predominantly due to a ubiquitous, intrinsic mutation process depending on deamination of 5-methylcytosine to thymine2. These differences could be due to different mutation rates per cell division in different tissues, different numbers of cell divisions in the lineage from fertilised egg to adult stem cell in different tissues, or both. Using other approaches, it has been estimated that the rate of small bowel stem cell division is greater than that of colon or stomach20, consistent with the mutation counts demonstrated here, suggesting that the number of somatic substitutions is acting as a “cell division clock”. The murine small bowel Lgr5+ stem cell has been reported to divide every 21.5 hours21. Thus, the number of substitution mutations arising in each cell division in small bowel stem cells is ~1.1 / cell division (Methods), similar to the rate of ~1.5 / cell division during early embryogenesis (Supplementary Discussion C). The burden of mutations was higher in zones of repressed chromatin (q < 0.00001) and late replicating regions (p = 0.000034), patterns previously reported in human cancer22,23 (Extended data figure 5). There was no statistically significant difference in mutation burden between the two mice.
Figure 3. The number and spectrum of substitution mutations in individual organoids.
(A) The spectrum of base substitution mutations in each organoid. (B, left) The absolute number of genome-wide substitutions is shown. When adjusted for sensitivity, the range of the mutation burden per organoid genome is 179 to 1190 (mean 609) substitutions (see Supplementary Table 1). (B, right) The number of CpG > TpG substitutions. Grey bars: mouse 1. White bars: mouse 2. (C) Mutational spectrum of embryonic variants.
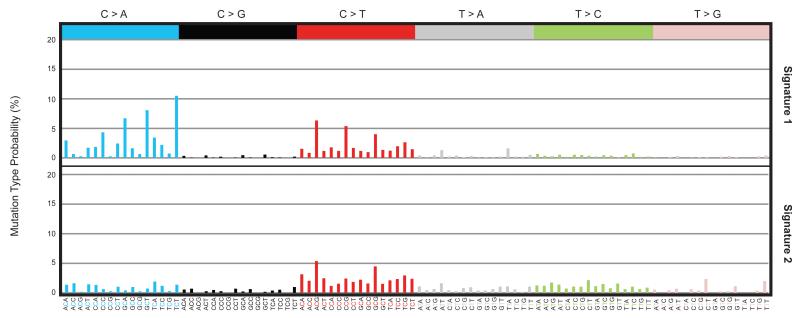
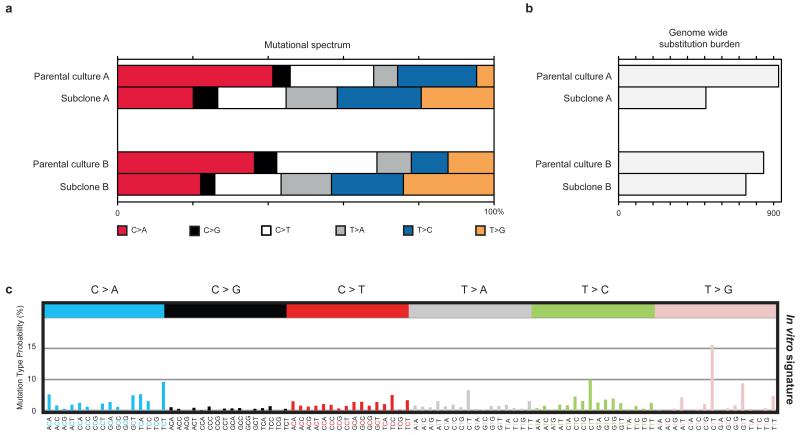
Comparison of the six subclasses of base substitution between the four mouse tissues sampled revealed differences in mutation patterns. Notably, the proportion of C>A substitutions in small bowel stem cells was elevated compared to other adult tissues and to the 35 aggregated early embryonic mutations (Figure 3A and C) which predominantly were C>T transitions enriched at CpG dinucleotides. Analysis by non-negative matrix factorization24, incorporating the immediate 5′ and 3′ sequence context of each mutated base, extracted two underlying mutational signatures. One is characterised predominantly by C>T mutations (signature 2, Extended data figure 6). The other has a major feature of C>A substitutions at XpCpT trinucleotides in addition to C>T mutations (signature 1, Extended data figure 6). Mutations acquired in vitro by small bowel organoid stem cells exhibit a different mutational signature. Sequencing of subclones of cell populations expanded from two small bowel single stem cells that had been exposed to a period of culture revealed a distinct mutational signature characterised by T>G mutations enriched at XpTpT trinucleotides (Extended data figure 7). The data indicate that multiple mutational processes are operative in normal cells in vivo and in vitro and that the degree of exposure differs across tissues. The mechanism underlying the signature characterised by C>A mutations is unclear. However, one possible cause is mutagenesis by reactive oxygen species, which are reported to generate C>A mutations25.
Catalogues of somatic mutations act as “archaeological” records reflecting the past experiences of cancer cells26. Our results illustrate the insights they can provide into the life histories of normal cells. Sequencing of larger numbers of individual cells from a wider range of tissues will allow precise reconstruction of cell lineages extending into later stages of embryogenesis with further insights into tissue-specific development, mutational processes and mutation rates. Studies of multiple animals will reveal variability between individuals and relationships with age, disease and environmental exposures. If somatic mutation rates are similar to those in mice, the results indicate that application of this approach to human cells is a tractable endeavour.
Online Only Methods
Organoid generation
Two homozygous C57Bl6 male mice with Lgr5-ki, mouse 1 and mouse 2, were sacrificed at 116 and 98 weeks of age, respectively. These mice were chosen for our experiments because they have a normal phenotype, are not known to be hypermutable, and are likely to be highly inbred being derived from a colony established in 2006/7. Clonal organoid lines were established from single glands (stomach)13,17,27, single crypts (small intestine16,17, colon15,17) or single cells (prostate; Karthaus and Clevers, manuscript in preparation) and expanded in vitro for 3-6 weeks. Single stomach glands13,17,27, small intestine16,17 and colonic crypts15,17 are known to be clonal and are derived from a single stem cell. Prostate organoid lines were established from single prostate cells as follows: The prostate was divided into three lobe pairs and each lobe was placed in 5-mg/ml collagenase type II (Gibco) in advanced DMEM/F12 and digested for 1 to 2 hours at 37 ° C. Glandular structures were washed with ADMEM/F12 and centrifuged at 100*G. Subsequently structures were digested in 5ml TriplE (Gibco) with the addition Y-27632 10 μM (Sigma) for 15 min at 37 ° C. Trypsinized cells were washed and single cells were seeded in growth factor reduced matrigel (BD biosciences) under prostate organoid conditions.
Whole genome sequencing
DNA was extracted from 25 organoid lines and the tail of each mouse, and whole genome sequencing was performed as described before26. Reads were aligned to the reference mouse genome (NCBI37) by using BWA on default settings. Reads which were unmapped or PCR-derived duplicates were excluded from the analysis.
Somatic variant calling and validation
To call somatic single nucleotide substitutions that were unique to each organoid, the CaVEMan (cancer variants through expectation maximization) algorithm26 was used by comparing each organoid to the tail of the same mouse. We aimed to find heterozygous variants, to avoid contaminating the data set with subclonal mutations that are likely to have arisen in vitro. In addition to previously reported post-processing filtering 26 we applied the following criteria for variant calling: depth of at least 5× in the variant locus; variant allele fraction of at least 25%; presence of the variant in at least 1 forward and 1 reverse read; variant not located in a single nucleotide polymorphism loci (as per dbSNP, http://www.ncbi.nlm.nih.gov/SNP); variant falls within a homozygous region.
Putative somatic variants were subjected to manual inspection, and artefacts excluded from the data set. To validate the final catalogue of substitutions unique to each organoid, randomly selected substitutions (n=743 variants; 11%) were experimentally validated. DNA of the organoids and tail tissue from same mouse was amplified by PCR (primer sequences available on request) targeting the variant location. PCR amplicons were sequenced on an Illumina MiSeq (read length 150 base pairs) to a median depth of 15,000×. The precision of the final catalogue of substitutions was thus determined to be at least 92%.
Measurement of sensitivity
To measure sensitivity of the sequencing and analysis pipeline to detect heterozygous mutations, we extracted 1000 randomly selected heterozygous SNPs from tail sequences of each mouse. As a measure of sensitivity, we determined how many of these 1000 SNPs we were able to call in each organoid, using the same stringent post-processing filtering criteria as used in initial variant calling, namely: minimum depth of 5 reads; allele fraction of > 25%; variant presents in at least one read in each direction. The heterozygous SNPs were determined by interrogating ~ 1.5 million potential SNP positions (as per dbSNP) in each tail and selecting those SNPs in which the two major alleles present with an allele fraction of 45% to 55%. A minimum depth threshold of 10× was chosen (tail sequence coverage being ~35×) to avoid biasing for SNP positions with a relatively high depth. Of this catalogue of heterozygous SNPs, 1000 SNPs were randomly selected.
Embryonic variant calling and validation
An embryonic mutation was defined as a mutation that was present in at least two organoids or one organoid and the tail. In addition, the mutation had to absent from at least one organoid or the tail. To derive unbiased catalogues of putative embryonic variants, we used CaVEMan in a comparison of each organoid against the tail of the other mouse. From the resulting list of variants we removed variants that were present in all organoids of the same mouse; variants in loci of single nucleotide polymorphisms; variants that did not fall into a homozygous region. We applied numerical rules to exclude likely germline variants that were not identified as such due to insufficient coverage. Artefacts were then removed by manual inspection. Every potential variant thus detected was subjected to validation by capillary sequencing in every organoid and control tissue. Following lineage tree construction from unbiased calls, further supporting variants were sought. The final catalogue of embryonic mutations comprised 35 mutations. Every mutation was capillary sequenced in every organoid, yielding 437/475 informative reads. Based on these, the precision of the catalogue of embryonic variants was 100%.
Lineage tree construction
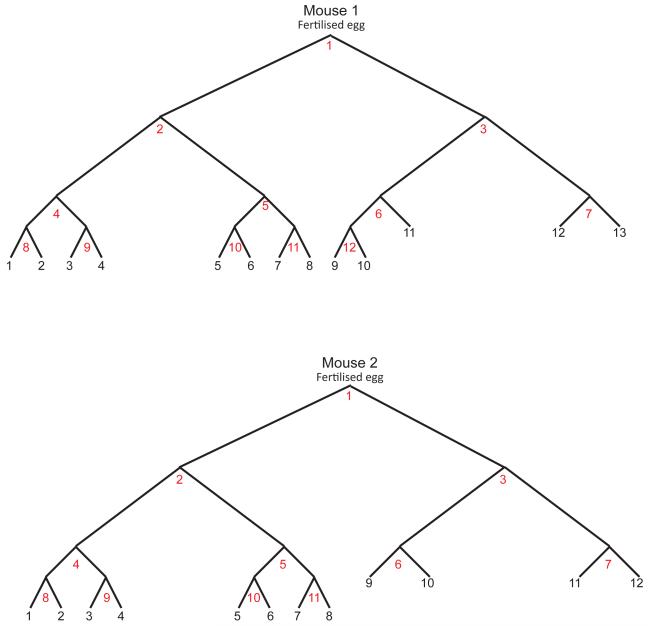
We first constructed hypothetical trees for each mouse to determine the minimum number of cell divisions required to fully resolve the trees. On the assumption that two bifurcating lineage trees have led to all the cells in the two mice, we constructed two hypothetical trees to include the minimum number of bifurcations required to place all 25 organoid lines singly at the end of the branches of each tree, 13 organoids in mouse 1 and 12 in mouse 2. Together the two trees comprised 23 cell divisions (Extended data figure 4).
We then constructed lineage trees manually, and computationally using maximum parsimony (as implemented in the PHYLIP DNAPARS software, with settings: randomize input order; outgroup root)29,30 from variants that were confirmed to be genuine, non-germline. In performing the computational analyses, the root of each lineage was represented by wildtype sequences. A unique most-parsimonious solution was found for each mouse into which all embryonic variants fitted with no homoplasy.
These phylogenetic lineage trees may correspond to the tree of cell divisions during embryogenesis. However, it is possible that some cell divisions may have been missed, either because multiple mutations at a lineage branch point have actually arisen at more than one cell division and/or because certain cell divisions have lacked mutations and/or because some daughter cells have died during development and have not contributed to the adult mouse. To evaluate whether the lineage trees may correspond to cell divisions two tests were applied using the read counts of mutations in the tail sample (see also Extended data figure 2):
When multiple mutations define an embryonic precursor, we tested whether there was a significant difference in the tail allele frequencies of the mutations (Fisher’s exact test). Significant differences between mutations defining the same precursor would indicate that the mutations did not occur during the same cell division but successively and another cell generation would have to be added. Within each precursor cell, we did not find mutations with consistent significant differences in tail allele frequency. Under these circumstances we classified such branches as single cell divisions. However, since sequence coverage and hence read counts in the tail are limited we cannot exclude the possibility that real differences in read counts have not been detected because of lack of statistical power.
It is possible that between generations “silent” cell divisions (in which no mutation took place) occurred that we did not capture because of the lack of detectable mutations. The existence of “silent” cell divisions can be tested by comparing the tail allele frequencies of a precursor cell with the sum of the allele frequencies of the two derivative cells, which should be similar. According to this test, it is possible to derive the trees that we propose without having to invoke “silent” cell divisions. Again, however, lack of statistical power through limited coverage may limit our ability to detect these differences. Moreover, if a cell division results in one daughter with no mutations and the other daughter dies and does not contribute to the adult, then we will be unable to detect the existence of this cell division.
Copy number
We derived copy number data by averaging whole genome coverage data within defined segments. Organoids were compared to tails of the same mouse to identify somatic copy number changes.
Mutational signatures
Mutational signatures were determined using non-negative matrix factorization, as previously described2,24.
Analysis of allele frequencies
We applied the Dirichlet process, as described previously26, to assess the read count frequency of mutations in each organoid.
Analysis of association of mutations with chromatin organisation
To study the whether somatic mutations that are unique to each organoid are associated with distinct chromatin states we tested whether mutations were enriched in regions of repressed versus active chromatin. To this end, files with the location of histone modification peaks from ChIP-seq data were downloaded from UCSC for 5 different modifications (H3K14me1, H3K4me3, H3K9me3, H3K27me3 and H3K36me3), profiled across two mouse cell lines (CH12 and G1E) and two primary sources (erythroblasts and megakaryocytes). To obtain a conservative segmentation of the genome into different chromatin regions, a segment was annotated as marked by a histone modification only when supported by all four cell types. We then calculated the density of mutations in each region. To avoid the possible confounding effect of sequence composition, a second analysis was performed calculating the mutation density as the number of G>N or C>N mutations per G/C nucleotide in every chromatin region, yielding analogous results. Non-homozygous areas of the organoid genomes, which were excluded from mutation calling, were not considered in this analysis. Statistical significance was assessed for every pairwise comparison (n=10) using an Exact Poisson test for the ratio between two rate parameters (r=1 in the null hypothesis) and adjusted for multiple testing using Benjamini-Hochberg’s False Discovery Rate.
Analysis of association of mutations with replication timing
To evaluate the association of the mutation density with replication timing, we used 16 Repli-chip datasets from ENCODE/FSU: Wavelet-smoothed values of mean early/late S-phase ratios from UCSC for 4 mouse cell lines (CH12, J185a, L1210 and MEL); 5 primary sources (epidermal stem cells -EpiSC-5, EpiSC-7-, embryonic stem cells -ES-46C, ES-D3- and embryonic fibroblast -MEF-). We noticed a generally good agreement between technical replicates but substantial variation among cell types, particularly at certain genomic regions. To generate a conservative segmentation of the genome in replication times across cell types, we calculated the average replication time in non-overlapping windows of 200kb and removed all regions that showed extensive variation between biological replicates (standard deviation > 0.5). The resulting distribution is strongly bimodal so we classified regions as early (positive average ratio) or late (negative ratio). Non-homozygous areas of the organoid genomes, which were excluded from mutation calling, were not considered in this analysis. The average density of mutations and the statistical analyses were performed as for the Analysis of association of mutations with chromatin organisation.
Assessment of in vitro mutations in small bowel organoids
Two small bowel organoids were derived from a third mouse, mouse 3. For this experiment the organoids were derived from single Lgr5+ stem cells, rather than clonal crypts. After 56 days in culture DNA was harvested for sequencing and analysis of in vivo mutations. Further, individual Lgr5+ stem cells were isolated from the cultures and one cell per mouse cultured and expanded for DNA harvesting. Using an orthogonal sequencing platform (SOLiD 5500), parental clones and subclones were sequenced to an average depth of 18×, aligned by BWA to the mouse reference genome (NCBI37), and substitutions called using Genome Analysis Toolkit (GATK) v2.3.9 36. Post-processing filters were: minimum depth of 10×; variant absent from paired normal; variant absent from panel of unmatched normal mouse genomes; variant not a SNP (as per dbSNP); in subclones, variant absent from parental clones. The precision of the catalogue of mutations was experimentally determined by sequencing randomly selected substitutions targeted by PCR on an Illumina MiSeq sequencer. For subclones 3 and 4, informative reads were obtained for 131/1246 substitutions which indicate that the precision of the data set is ~95%. Variant data of both subclones is reported in Supplementary Discussion, Supplementary Table 4 and Extended data figure 7. Catalogues of mutations from parental clones of mouse 3 are publicly available at http://www.hubrecht.eu/research/cuppen/suppl_data.html and corresponding sequencing data is deposited at the EMBL European Nucleotide Archive, accession number ERP005717.
Further statistical analyses
The significance of the difference in mutation burden between mice and between tissues was tested using a linear mixed effects model, implemented using the R package lme4. After incorporating sequence coverage as a fixed effect, neither the identity of the mouse nor the tissue of origin was found to have any random effect on the number of mutations, but the tissue of origin had a significant fixed effect: prostate (p=0.001) and stomach (p=0.003) had fewer mutations than colon; small bowel had more mutations than all other tissues including colon (p=0.003 in comparison to next highest tissue, i.e. colon). Consequently, colon had significantly more mutations than either prostate or stomach but fewer than small bowel.
Calculation of mutation rate per cell division
Average of mutation burden (corrected for sensitivity) / number of cell divisions, in small bowel organoids.
Extended Data
Extended data figure 1. Mutant read count frequencies and clonality of organoids.
Using the Dirichlet process to analyse the mutant read count frequencies, we determined the clonality of each organoid. In every organoid only one clone can be found, with no evidence of subclonality. The single clone of each organoid presents with variants that are heterozygous (mutation copy number of 1). The shaded area represents the 95% confidence interval around each peak. Y-axis: Probability density. X-axis: mutation copy number. Identifier in top left corner of each graph is the sample ID. St: stomach. SB: small bowel. LB: large bowel. P: prostate.
Extended data figure 2. Example of an embryonic mutation.
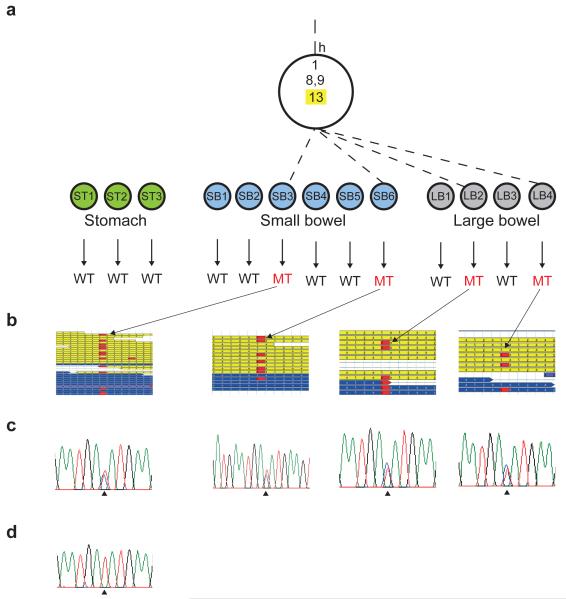
a, Mutation 13 of mouse 1 is shown that defines an embryological lineage that ultimately gives rise to 4 organoids from large and small bowel. b, The mutation was called from next generation sequencing data. c, It was then validated by capillary sequencing. d, In addition, the absence of the variant in all other organoids was confirmed by capillary sequencing (representative trace shown). WT = wildtype. MT = mutant.
Extended data figure 3. Principles of parsimonious construction of cell division trees.
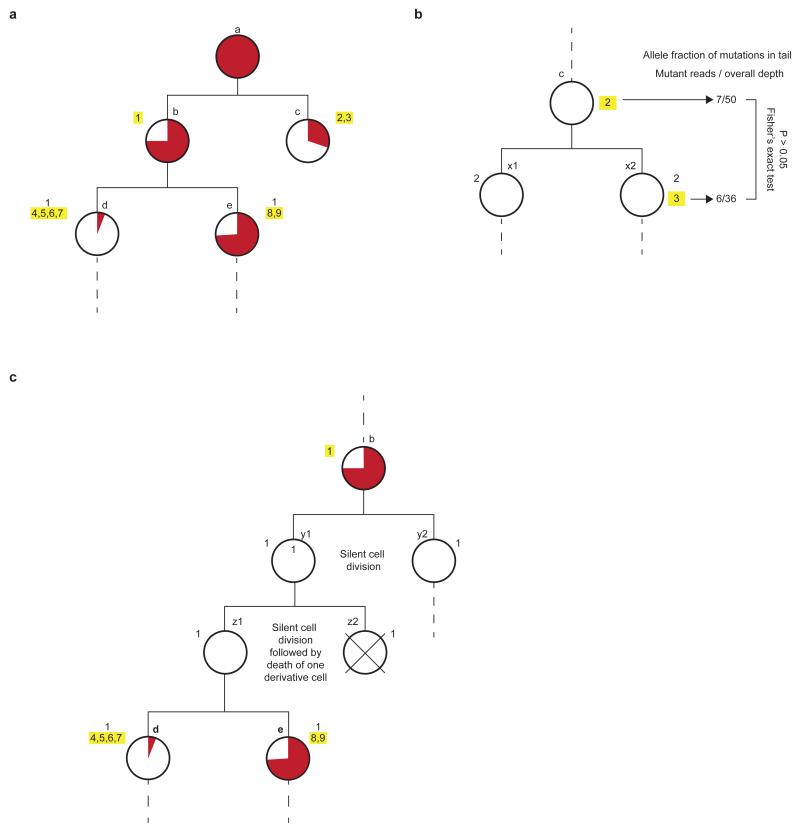
a, First two cell division of mouse 1. Each white-filled large circle represents an embryo cell that is defined by a unique combination of mutations. Each mutation is represented by a number next to the white circles, and yellow highlights mutation(s) acquired during the most recent mitosis. Letters next to white circles are identifiers of each embryonic precursor cell. The proportional contribution of each embryonic precursor cell to the population of cells in the tail is represented by the proportion of the circle area coloured red, assessed by read counts, in the tail, of the most recently acquired mutation(s) in each embryo cell. b, Note that cells ‘c’, ‘d’, and ‘e’ are defined by more than one mutation which may have occurred in successive cell divisions rather than in a single cell division, as illustrated here for cell ‘c’. As the allele fractions of these mutations “2” and “3” in the tail are not significantly different, the mutations can be interpreted as having occurred during the same cell division. The limited depth of these mutations in the tail, however, may not provide sufficient power to detect small, but real, significant differences so we cannot exclude the possibility that these mutations occurred in successive cell divisions. c, Possibility of “silent” division and cell death. It is possible that any number of “silent” cell divisions (in which no mutation took place) occurred which we did not capture because of the lack of detectable mutations. In the hypothetical scenario illustrated here, two such silent divisions took place between precursor ‘b’ and ‘d’/‘e’. The existence of “silent” cell divisions can be tested by comparing the tail allele frequencies of a precursor cell with the sum of the allele frequencies of the two derivative cells, which should be similar. In the example illustrated here, the combined tail allele fractions of mutations defining ‘d’ and ‘e’ are not significantly different from mutation 1 of cell ‘b’. The tail allele fraction of mutation 1 is 37.5 % and the combined allele fraction of mutations 4 to 9 is 39.8%. These observations are therefore compatible with our hypothesis that cell ‘b’ is the immediate precursor of cells ‘d’ and ‘e’. Again, however, lack of statistical power through limited coverage may limit our ability to detect these differences. Moreover, if a cell division results in one daughter with no mutations and the other daughter dies and does not contribute to the adult, then we will be unable to detect the existence of this cell division, illustrated here in cells ‘z1’ and ‘z2’.
Extended data figure 4. Hypothetical lineage trees.
Red numbers: count of cell divisions. Black numbers: count of organoids. On the assumption that two bifurcating lineage trees have led to all the cells in the two mice, we constructed two hypothetical trees to include the minimum number of bifurcations required to place all 25 organoid lines singly at the end of the branches of each tree, 13 organoids in mouse 1 and 12 in mouse 2. Together the two trees comprised 23 cell divisions.
Extended data figure 5. Association of mutation density with genome features.
a, Association of mutation density with chromatin states. Shown is the relative density of mutations in regions of open chromatin (green bars) or repressed chromatin (grey bars). Chromatin states are inferred from histone modifications (as per labels of bars), according to publicly available ChIP-seq data. Mutation rates are normalised to the average genomic rate. Error bars denote 95% confidence intervals using an Exact Poisson test. Significance was obtained for every pairwise comparison (n=10) using an Exact Poisson test for the ratio between two rate parameters (r=1 in the null hypothesis) and adjusted for multiple testing using Benjamini-Hochberg’s False Discovery Rate. # denotes q-value < 1e-5. b, Density of mutations in early (white bar) versus late (blue bar) replicating regions. The mouse genome was segmented into early or late replicating regions based on 16 publicly available Repli-chip datasets. Statistical analysis as per (a). * denotes p-value = 3.4e-5.
Extended data figure 6. Mutational signatures extracted from mouse organoids.
The vertical axis depicts the contribution of each mutation-type at each context for the two identified mutational signatures. The horizontal axis shows the six base substitutions including the bases immediately 5′ and 3′ to the mutation.
Extended data figure 7. In vitro mutations of murine small bowel organoids.
a, Mutational spectra of small bowel in vitro mutations. Small bowel organoids were isolated and expanded from a third mouse (mouse 3). After 56 days in culture single Lgr5+ stem cells were isolated from the parental organoid cultures and expanded to obtain sufficient quantities of DNA for sequencing. Both subclones exhibit a different mutational spectrum, compared to parental cultures, characterised by a decrease in C>A and an increase in T>G mutations. b, Mutation burden of in vitro mutations. The absolute number of mutations unique to each organoid is shown. Mutations that were found in more than one organoid were excluded from the count. In vitro the small bowel organoid cells, subclone A and B, acquired 507 and 739 mutations, respectively. c, Non-negative matrix factorisation extracted a distinct mutational signature from the mutations of the subclones termed in vitro signature, which is characterised by an excess of T>X mutations at XpTpT trinucleotides. Vertical axis: contribution of each mutation-type at each context to the overall mutation burden. Horizontal axis: six classes of base substitutions including the bases immediately 5′ and 3′ to the mutation.
Supplementary Material
Acknowledgements
This work was supported by funding from the Wellcome Trust (grant reference 077012/Z/05/Z), the Kadoorie Charitable Foundation and the Louis-Jeantet Foundation. Individual authors were supported as follows. M.H. - Marie Curie IEF fellowship (EU/236954), ERC grant (232814); R.B. and E.C. - Zenith grant of the Netherlands Genomics Initiative (935.12.003); W.K. – CBG; I.M. - EMBO Long Term Fellowship (ALTF-1287-2012); S.N.Z. - Wellcome Trust Intermediate Clinical Fellowship (WT100183MA) and Wellcome-Beit Prize Fellowship 2013; S.B. - Wellcome Trust Research Training Fellowship for Clinicians; P.C. – Wellcome Trust Senior Research Fellowship in Clinical Science.
We thank Magdalena Zernicka-Goetz (The Gurdon Institute, Cambridge, UK), and the Goldman group (European Bioinformatics Institute, Hinxton, UK) for discussion of our findings.
Footnotes
Author Information
Sequencing data have been deposited at the European Nucleotide Archive (http://www.ebi.ac.uk/ena/), accession numbers ERP002057 (Illumina data) and ERP005717 (SOLID data). H.C. is an inventor of several patents involving the organoid culture system.
References
- 1.Shapiro E, Biezuner T, Linnarsson S. Single-cell sequencing-based technologies will revolutionize whole-organism science. Nat Rev Genet. 2013;14:618–30. doi: 10.1038/nrg3542. [DOI] [PubMed] [Google Scholar]
- 2.Alexandrov LB, et al. Signatures of mutational processes in human cancer. Nature. 2013;500:415–21. doi: 10.1038/nature12477. [DOI] [PMC free article] [PubMed] [Google Scholar]
- 3.Sato T, Clevers H. Growing self-organizing mini-guts from a single intestinal stem cell: mechanism and applications. Science. 2013;340:1190–4. doi: 10.1126/science.1234852. [DOI] [PubMed] [Google Scholar]
- 4.De S. Somatic mosaicism in healthy human tissues. Trends Genet. 2011;27:217–23. doi: 10.1016/j.tig.2011.03.002. [DOI] [PubMed] [Google Scholar]
- 5.Carlson CA, et al. Decoding cell lineage from acquired mutations using arbitrary deep sequencing. Nat Methods. 2012;9:78–80. doi: 10.1038/nmeth.1781. [DOI] [PMC free article] [PubMed] [Google Scholar]
- 6.Kennedy SR, Loeb LA, Herr AJ. Somatic mutations in aging, cancer and neurodegeneration. Mech Ageing Dev. 2012;133:118–26. doi: 10.1016/j.mad.2011.10.009. [DOI] [PMC free article] [PubMed] [Google Scholar]
- 7.Salipante SJ, Horwitz MS. Phylogenetic fate mapping. Proc Natl Acad Sci U S A. 2006;103:5448–53. doi: 10.1073/pnas.0601265103. [DOI] [PMC free article] [PubMed] [Google Scholar]
- 8.Salipante SJ, Horwitz MS. A phylogenetic approach to mapping cell fate. Curr Top Dev Biol. 2007;79:157–84. doi: 10.1016/S0070-2153(06)79006-8. [DOI] [PubMed] [Google Scholar]
- 9.Shibata D, Tavare S. Counting divisions in a human somatic cell tree: how, what and why? Cell Cycle. 2006;5:610–4. doi: 10.4161/cc.5.6.2570. [DOI] [PubMed] [Google Scholar]
- 10.Wasserstrom A, et al. Reconstruction of cell lineage trees in mice. PLoS One. 2008;3:e1939. doi: 10.1371/journal.pone.0001939. [DOI] [PMC free article] [PubMed] [Google Scholar]
- 11.Zhou W, et al. Use of somatic mutations to quantify random contributions to mouse development. BMC Genomics. 2013;14:39. doi: 10.1186/1471-2164-14-39. [DOI] [PMC free article] [PubMed] [Google Scholar]
- 12.Lasken RS. Single-cell sequencing in its prime. Nat Biotechnol. 2013;31:211–2. doi: 10.1038/nbt.2523. [DOI] [PubMed] [Google Scholar]
- 13.Barker N, et al. Lgr5(+ve) stem cells drive self-renewal in the stomach and build long-lived gastric units in vitro. Cell Stem Cell. 2010;6:25–36. doi: 10.1016/j.stem.2009.11.013. [DOI] [PubMed] [Google Scholar]
- 14.Barker N, et al. Identification of stem cells in small intestine and colon by marker gene Lgr5. Nature. 2007;449:1003–7. doi: 10.1038/nature06196. [DOI] [PubMed] [Google Scholar]
- 15.Sato T, et al. Long-term expansion of epithelial organoids from human colon, adenoma, adenocarcinoma, and Barrett’s epithelium. Gastroenterology. 2011;141:1762–72. doi: 10.1053/j.gastro.2011.07.050. [DOI] [PubMed] [Google Scholar]
- 16.Sato T, et al. Single Lgr5 stem cells build crypt-villus structures in vitro without a mesenchymal niche. Nature. 2009;459:262–5. doi: 10.1038/nature07935. [DOI] [PubMed] [Google Scholar]
- 17.Snippert HJ, et al. Intestinal crypt homeostasis results from neutral competition between symmetrically dividing Lgr5 stem cells. Cell. 2010;143:134–44. doi: 10.1016/j.cell.2010.09.016. [DOI] [PubMed] [Google Scholar]
- 18.Plusa B, et al. The first cleavage of the mouse zygote predicts the blastocyst axis. Nature. 2005;434:391–5. doi: 10.1038/nature03388. [DOI] [PubMed] [Google Scholar]
- 19.Bruce AW, Zernicka-Goetz M. Developmental control of the early mammalian embryo: competition among heterogeneous cells that biases cell fate. Curr Opin Genet Dev. 2010;20:485–91. doi: 10.1016/j.gde.2010.05.006. [DOI] [PubMed] [Google Scholar]
- 20.Barker N, et al. Very long-term self-renewal of small intestine, colon, and hair follicles from cycling Lgr5+ve stem cells. Cold Spring Harb Symp Quant Biol. 2008;73:351–6. doi: 10.1101/sqb.2008.72.003. [DOI] [PubMed] [Google Scholar]
- 21.Schepers AG, Vries R, van den Born M, van de Wetering M, Clevers H. Lgr5 intestinal stem cells have high telomerase activity and randomly segregate their chromosomes. EMBO J. 2011;30:1104–9. doi: 10.1038/emboj.2011.26. [DOI] [PMC free article] [PubMed] [Google Scholar]
- 22.Lawrence MS, et al. Mutational heterogeneity in cancer and the search for new cancer-associated genes. Nature. 2013;499:214–8. doi: 10.1038/nature12213. [DOI] [PMC free article] [PubMed] [Google Scholar]
- 23.Schuster-Bockler B, Lehner B. Chromatin organization is a major influence on regional mutation rates in human cancer cells. Nature. 2012;488:504–7. doi: 10.1038/nature11273. [DOI] [PubMed] [Google Scholar]
- 24.Alexandrov LB, Nik-Zainal S, Wedge DC, Campbell PJ, Stratton MR. Deciphering signatures of mutational processes operative in human cancer. Cell Rep. 2013;3:246–59. doi: 10.1016/j.celrep.2012.12.008. [DOI] [PMC free article] [PubMed] [Google Scholar]
- 25.van Loon B, Markkanen E, Hubscher U. Oxygen as a friend and enemy: How to combat the mutational potential of 8-oxo-guanine. DNA Repair (Amst) 2010;9:604–16. doi: 10.1016/j.dnarep.2010.03.004. [DOI] [PubMed] [Google Scholar]
- 26.Nik-Zainal S, et al. The life history of 21 breast cancers. Cell. 2012;149:994–1007. doi: 10.1016/j.cell.2012.04.023. [DOI] [PMC free article] [PubMed] [Google Scholar]
- 27.Leushacke M, Ng A, Galle J, Loeffler M, Barker N. Lgr5 Gastric Stem Cells Divide Symmetrically to Effect Epithelial Homeostasis in the Pylorus. Cell Rep. 2013 doi: 10.1016/j.celrep.2013.09.025. [DOI] [PubMed] [Google Scholar]
- 28.Nik-Zainal S, et al. Mutational processes molding the genomes of 21 breast cancers. Cell. 2012;149:979–93. doi: 10.1016/j.cell.2012.04.024. [DOI] [PMC free article] [PubMed] [Google Scholar]
- 29.Felsenstein J. PHYLIP - Phylogeny Inference Package (Version 3.2) Cladistics. 1989;5:164–166. [Google Scholar]
- 30.Yang Z, Rannala B. Molecular phylogenetics: principles and practice. Nat Rev Genet. 2012;13:303–14. doi: 10.1038/nrg3186. [DOI] [PubMed] [Google Scholar]
Associated Data
This section collects any data citations, data availability statements, or supplementary materials included in this article.


