

Abstract
Members of the 2-aminobenzamide class of histone deacetylase (HDAC) inhibitors show promise as therapeutics for the neurodegenerative diseases Friedreich’s ataxia (FRDA) and Huntington’s disease (HD). While it is clear that HDAC3 is one of the important targets of the 2-aminobenzamide HDAC inhibitors, inhibition of other class I HDACs (HDACs 1 and 2) may also be involved in the beneficial effects of these compounds in FRDA and HD, and other HDAC interacting proteins may be impacted by the compound. To this end, we synthesized activity-based profiling probe (ABPP) versions of one of our HDAC inhibitors (compound 106), and in the present study we used a quantitative proteomic method coupled with multidimensional protein identification technology (MudPIT) to identify the proteins captured by the ABPP 106 probe. Nuclear proteins were extracted from FRDA patient iPSC-derived neural stem cells, and then were reacted with control and ABPP 106 probe. After reaction, the bound proteins were digested on the beads, and the peptides were modified using stable isotope-labeled formaldehyde to form dimethyl amine. The selectively bound proteins determined by mass spectrometry were subjected to functional and pathway analysis. Our findings suggest that the targets of compound 106 are involved not only in transcriptional regulation but also in posttranscriptional processing of mRNA.
Keywords: HDAC inhibitor, dimethyl labeling, MudPIT, FRDA
Introduction
Recent studies have indicated that members of the 2-aminobenzamide class of histone deacetylase inhibitors show promise as therapeutics for the neurodegenerative diseases Friedreich’s ataxia (FRDA) and Huntington’s disease.1−3 In the case of FRDA, this disorder is caused by transcriptional repression of the nuclear FXN gene encoding the essential mitochondrial protein frataxin.4 Expansion of GAA·TTC triplet repeats in pathogenic FXN alleles cause gene silencing and a loss of frataxin protein in affected individuals. Currently there is no effective therapy for FRDA that addresses the cause of the disease. Unlike many triplet-repeat diseases (e.g., the polyglutamine expansion diseases), expanded GAA·TTC triplets in FXN are in an intron and do not alter the amino acid sequence of the frataxin protein; thus, gene activation would be of therapeutic benefit. On the basis of the hypothesis that the acetylation state of the histone proteins is responsible for gene silencing in FRDA, the Gottesfeld lab identified one commercially available HDAC inhibitor (BML-210) that partially relieves repression of the FXN gene in lymphoid cells derived from FRDA patients.5 A library of derivatives of this lead compound has been synthesized, and potent activators of FXN transcription have been identified in cell-based assays.5 Importantly, these compounds consistently increase the level of frataxin mRNA in lymphocytes from FRDA patients to at least the levels found in lymphocytes from unaffected carrier siblings or parents. We find that the HDAC inhibitors act directly on the histones associated with the FXN gene, increasing acetylation at particular lysine residues on histones H3 and H4.5 Biochemical studies, including enzyme inhibition and target identification with affinity-capture probes, provided evidence that HDAC3 is a main preferred enzyme target of the inhibitors.6,7 Importantly, upregulation of the frataxin gene has been observed in two FRDA mouse models when treated with these compounds,8−10 and one member of this drug class has been undergoing preclinical evaluation and has completed a phase Ib clinical trial in FRDA patients, who show increases in FXN mRNA in circulating lymphocytes.11
In the case of Huntington’s disease (HD), a large body of evidence points to transcriptional dysregulation as one of the key features of this disease, and HDAC inhibitors have been the subject of intense investigation to counteract the transcription deficits in HD.12 We find that members of the 2-aminobenzamide class of HDAC inhibitors are beneficial in restoring normal transcriptional activity in both cellular and mouse models for HD and these molecules have beneficial effects on neuromotor function in the R6/2 mouse model.2,3,13
In our previous studies,6,7 we surprisingly found that common HDAC inhibitors, valproic acid, trichostatin A (TSA), and suberoylanilide hydroxamic acid (SAHA), some of which are more potent HDAC inhibitors than BML-210 and our derivatives, do not have a positive effect on activation of the FXN gene in FRDA cells.5 While it is clear that HDAC3 is a cellular target of the 2-aminobenzamide class of HDAC inhibitors7 and is inhibited through a slow, tight-binding mechanism in contrast to the rapid-on/rapid-off inhibition mechanism observed for the hydroxamates TSA and SAHA,6,7 inhibition of other class I HDACs (HDACs 1 and 2) may also be involved in the beneficial effects of these compounds in FRDA and HD, and other HDAC interacting proteins may be important.
To identify the targets of the 106 compound, we synthesized an activity-based profiling probe (ABPP) version of one of our HDAC inhibitors (106) and a control probe, which is a derivative of 106 lacking a 2-amino group in the HDAC inhibitor portion of the molecule.7,14 The control probe is far less active as an HDAC inhibitor as shown in a previous study.7 While our primary interest is identification of targets of 106 that might be involved in regulation of the FXN gene in FRDA, an unbiased proteomic approach should also identify the broader targets of 106 and their interacting proteins. In the present study, we used a dimethyl stable isotope-labeling approach coupled with multidimensional protein identification technology (MudPIT)15 to quantitatively identify the proteins specifically captured by the ABPP 106 probe under nondenaturing conditions compared with the control probe. The ABPP approach allows us to purify the 106 probe-specific targets with vigorous washing to reduce contaminating proteins. Dimethyl labeling and MudPIT provide powerful tools for defining the targets of the HDAC inhibitor 106 probe based on rigorous quantification to the control probe. In total, 4933 proteins were quantified and 1556 proteins were bound to the ABPP 106 probe with statistical significance compared with the control probe. Many of the specific ABPP 106 binders are involved in regulation of gene transcription and posttranscriptional processes, giving insights into FRDA mechanism and clinical therapy.
Materials and Methods
Cell Culture
Human Friedreich’s ataxia iPSC-derived neurospheres were grown in Neurobasal-A medium with 2% B-27 supplement, 1% ITS-A supplement, 1% N-2 supplement, 2 mM glutamine, 1% antibiotic/antimycotic, 10 mM HEPES, 20 ng/mL basic FGF, and 20 ng/mL EGF (R&D Systems) according to a previous procedure.16 Neurospheres were dissociated to single cells with accutase and plated on Matrigel (BDBiosciences) at 50,000 cells/cm2 and passaged every 4–5 days for expansion. Cells were centrifuged, and cell pellets were collected and washed with PBS buffer.
Probe Synthesis
Synthesis of 106-probe and control probe have been described in our previous publication.7 The new control probe (structure shown in Figure 5a) was made by reaction of N-(4-(4-aminobenzoyl)phenyl)hex-5-ynamide with acetic anhydride, and probe 2 (structure is shown in Figure 5a) is obtained by amide reaction of N-(4-(4-aminobenzoyl)phenyl)hex-5-ynamide with 7-((2-((tert-butoxycarbonyl)amino)phenyl)amino)-7-oxoheptanoic acid, followed by BOC deprotection.
Figure 5.

Photoaffinity capture of TCEB2 by the 106 probe. (a) Structures of a second control probe and a second 106 probe (probe 2). (b) Photoaffinity labeling, followed by addition of a biotin-azide by “click” chemistry, streptavidin capture, and Western blotting with antibody to TCEB2 followed the protocol outline in ref (7). Lane 1, nuclear extract input (2% of total, relative to lanes 2–4). Lane 2, 106-probe-bound protein; lane 3, second control probe-bound proteins; lane 4, probe 2-bound proteins. M denotes molecular mass markers.
Nuclear Extract Preparation
Nuclear extracts were prepared by first adding cold 10 mM HEPES (pH 7.9), 10 mM KCl, 1.5 mM MgCl2, 0.5 mM DTT, and 0.2 mM PMSF to washed cell pellets (100 μL/million cells); after incubation on ice for 10 min, the lysed cells were centrifuged at 3000 × g for 15 min, and the soluble fractions were removed. The pellet was resuspended in a 1:1 mixture of low salt buffer (20 mM HEPES [pH 7.9], 25% glycerol, 20 mM KCl, 1.5 mM MgCl2, 0.2 mM EDTA, 0.5 mM DTT, and 0.2 mM PMSF) and high salt buffer (20 mM HEPES [pH 7.9], 25% glycerol, 1.2 M KCl, 1.5 mM MgCl2, 0.2 mM EDTA, 0.5 mM DTT, and 0.2 mM PMSF) and was subjected to homogenization, followed by stirring at 4 °C for 30 min. The lysed nuclear pellet solution was centrifuged at 14,000 × g for 30 min at 4 °C to provide the nuclear fractions (supernatant) and a membrane pellet. All fractions were stored at −80 °C until use. Western blotting with histone antibodies showed enrichment in the nuclear fraction (data not shown).
Streptavidin Bead Enrichment and Western Blotting
ABPP probe enrichment was performed according to a previous procedure.7 Three hundred μL of nuclear extract (3.8 mg/mL protein) in 2100 μL PBS was added to different wells in a 6-well plate. Two hundred and forty μL of trifunctional probe was added to give a final concentration of 4 mM, and incubation was continued on ice for 5 min. Samples were then cross-linked with UV at 365 nm for 1 h on ice; 360 μL of click reagent (a mixture of CuSO4, biotin azide, TCEP, and ligand as with previous procedures7) was added to the wells, and the resulting solutions were rotated at ambient temperature for 1 h. One mL of PBS was added to each well, and the solution was kept at −20 °C overnight. The next day, the solutions from each well were transferred to separate Eppendorf tubes and centrifuged to precipitate proteins, which were then washed with cold methanol (1 mL, twice), dried, resuspended in 1 mL of 0.2% SDS in PBS, and then incubated with 0.8 mL of magnetic streptavidin beads (Invitrogen) for 2 h. The supernatant was removed from the original bead solution, and the beads were washed with PBS (1 mL, twice, prior to use). The supernatant was removed, and the beads were washed with 0.2% SDS in PBS (1 mL, twice), 6 M urea (1 mL, twice), and PBS (1 mL, three times); the resulting beads were eluted with 60 μL SDS loading buffer at 90 °C; 20 μL aliquots were loaded onto three separate SDS polyacrylamide gels, and subjected to Western blotting. Each membrane was immunostained with antibodies to HDAC1, HDAC2, and HDAC3 (all from Abcam), respectively, followed by antirabbit IgG–horseradish peroxidase-conjugated secondary antibody (Cell Signaling, MA).
Dimethyl Labeling
Dimethyl labeling was performed following the published protocol.17 The proteins bound to ABPP 106 probe were enriched using streptavidin beads as described above and then were reduced on beads in 5 mM TCEP/100 mM TEAB. The cysteine residues were alkylated with 10 mM iodoacetamide. Afterward, trypsin digestion was applied at 37 °C overnight. The supernatant containing tryptic peptides were mixed with 4 μL of 4% CH2O or 13CD2O to be labeled with light and heavy formaldehyde, respectively. Four μL of 0.6 M NaBH3CN or NaBD3CN were added to the samples to be light or heavy labeled. After incubation for 1 h at room temperature, the reaction was quenched by adding 16 μL of a 1% ammonia solution. Eight μL of formic acid was added to each sample to acidify the sample for LC–MS analysis.
Mass Spectrometry Analysis
The light and heavy labeled peptides were equally mixed (w/w) and were analyzed by a modified 10-step multidimensional protein identification technology (MudPIT) as described previously.15,18 Briefly, the peptide mixtures were preloaded onto a 250 μm internal diameter (I.D.) silica-fused capillary column packed with strong cation exchange (SCX, Whatman, Clifton, NJ) and reversed phase (Aqua C18, Phenomenex, Torrance, CA). The 100 μm I.D. analytical column packed with reversed phase (Aqua C18) was attached with the SCX end via a union, and the entire column setting (biphasic column–union–analytical column) was placed in line with an Agilent 1200 quaternary HPLC pump (Palo Alto, CA). Eluted peptides were electrosprayed directly into a hybrid LTQ-Orbitrap mass spectrometer (ThermoFisher, San Jose, CA) with the application of a distal 2.4 kV spray voltage. A cycle of one full-scan mass spectrum (400–1600 m/z) followed by seven data-dependent MS/MS spectra at a 35% normalized collision energy was repeated continuously throughout each step of the multidimensional separation.
Data Analysis
The raw data were extracted from the XCalibur data system format into MS1 and MS2 formats using in-house software. The peptides and proteins were identified by the Integrated Proteomics Pipeline - IP2 (Integrated Proteomics Applications, Inc., San Diego, CA. http://www.integratedproteomics.com/) using ProLuCID19 and DTASelect220 with a decoy database strategy. The protein false positive rate was controlled to be less than 1%. The searches were against EBI IPI Human protein database (version 3.87). Cysteine carboxyamidomethylation was set as a static modification. The “light” and “heavy” dimethylation of N-term and K were searched. The quantification was done by Census software written in our laboratory.21 The statistical analysis among replicates was performed in the module “quantification compare” of IP2.
Proteins with an average stable isotope ratio (ABPP 106 versus control probe) greater than 2 or greater than 1.5 with p < 0.05 were subjected to functional analysis in DAVID22 as well as Ingenuity.
Results
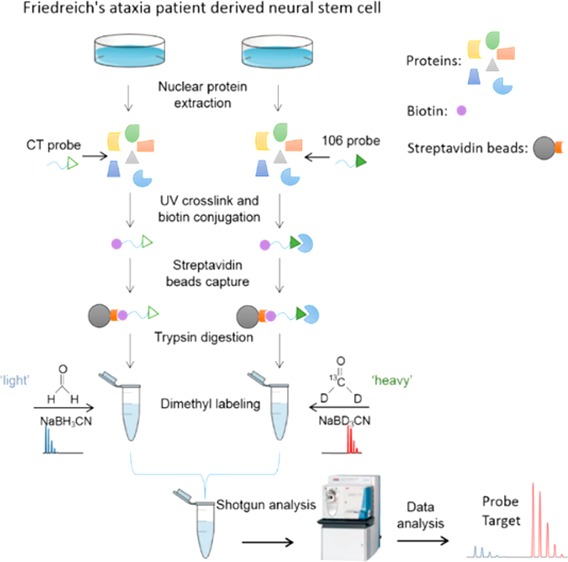
Experiment Strategy
HDACi 106 has been shown to increase FXN mRNA levels in lymphoblast cell lines and in primary lymphocytes from Friedreich’s ataxia patients,9 and a related 2-aminobenzamide has shown similar efficacy in neuronal cells derived from FRDA patient iPSCs.11 The structures of the 106- and control probes are shown in Figure 1a, and the strategy applied in the present study is shown in Figure 1b. Nuclear proteins were extracted from neural stem cells differentiated from Friedreich’s ataxia patient-derived iPS cells. We use neural stem cells as these cells are easily propagated and can give the required number of cells for the experiments. Differentiated neurons, the authentic cells that are affected in FRDA, generally cannot be obtained as a pure population of cells and cannot be propagated to give rise to the required numbers of cells. The ABPP 106 probe and control probe were incubated with nuclear extracted proteins. Afterward, the bound probe was cross-linked to the protein using UV light, conjugated with biotin by using “Click” chemistry, and then captured using streptavidin beads. The captured proteins were subjected to extensive washing using harsh denaturing conditions prior to trypsin digestion and labeling of peptides from different samples with “heavy” or “light” isotopomeric dimethyl labels. Two of four experimental replicates were forward labeled, and the other two were reverse labeled (e.g., label swap). The “heavy” and “light” labeled samples were mixed and analyzed by LC–MS/MS. Searching tandem mass spectra through the sequence database identified peptides. Identified peptides were quantified by calculating the ratio of peptide abundances in the differentially labeled samples, and those changes were then extrapolated to the protein level. This method will identify both direct targets of the 106 probe and proteins that interact with target proteins. For example, in our previous study7 we identified both HDAC3 and its partner protein NCoR1 by Western blot analysis.
Figure 1.

Structures of the 106- and control probes (a) and the experimental strategy in the present study (b). The synthesis procedures of 106- and control probes are shown in the previous study.7
Identification and Quantification of Proteins
A total of 2096 nonredundant proteins at a protein false discovery rate of 1% were identified in all four experimental replicates and a total of 4933 proteins were quantified overall (Table S1 in the Supporting Information [SI]). A total of 2571 proteins were quantified in at least one forward- and reverse-labeled experiment, and the reproducibility of the measurements was determined by plotting this experiment against another. The log base 2 of average ratios of two forward-labeling and two reverse-labeling experiments are shown in Figure 2. The slope of the calculated best fit to the data is 0.9449 (with an R2 of 0.7617), indicating that the ratio for each protein in the forward- and reverse-labeled measurements were largely similar (Figure 2). About 77% of the proteins (1987) have ratios (ABPP 106 versus control probe) greater than 1.
Figure 2.
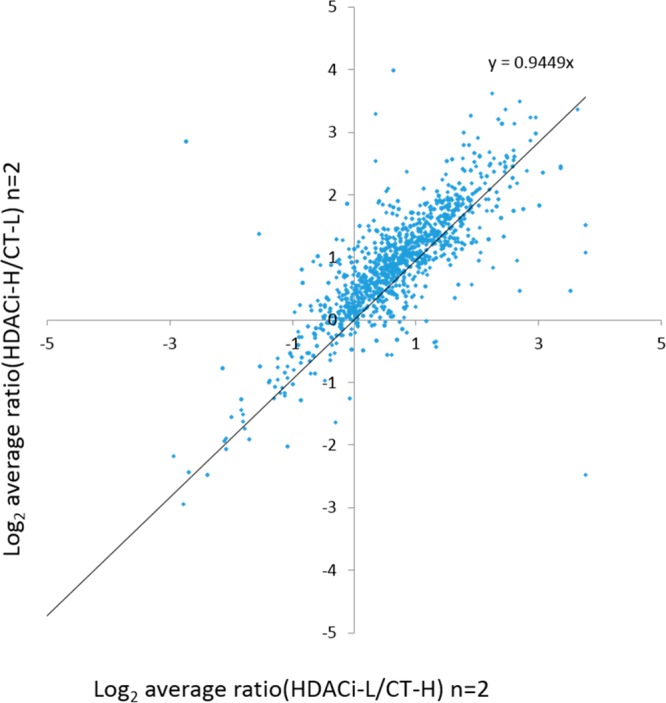
Reproducibility of the four experimental replicates. The protein IDs, which are identified in at least one forward- or reverse-labeled replicate were selected for reproducibility evaluation. The log base 2 of average ratios of two forward labeling and two reverse labeling was plotted against each other. The slope of the calculated best fit to the data is 0.9449 (with an R2 of 0.7617).
A total of four replicates were performed; 3003 proteins were quantified in at least two of the replicates, and this set was used for further analysis. One thousand two hundred and thirty-one proteins have an average ratio (ABPP 106 versus control probe) greater than 1.5 with a p-value <0.05, and among those proteins 883 had an average ratio greater than 2 (Figure 3). HDAC1 and 2 were identified as 106-probe specific binders and were verified by Western blot analysis (Figure 4). HDAC1 and 2 were found to be significantly enriched in the ABPP 106 incubated samples.
Figure 3.

Volcano plot of statistical significance against fold changes between 106- and control probes. Log2 (fold changes) were plotted against −log10 (p-values).
Figure 4.

Photoaffinity labeling of proteins in a nuclear extract from FRDA-iPSC derived neural stem cells with 106 probe followed by addition of a biotin-azide by “click” chemistry, streptavidin capture, and Western blotting with antibody to the indicated HDACs. Lane 1, nuclear extract input (2% of total, relative to lanes 2–3). For HDACs 1 and 3, lane 2, 106-bound proteins; lane 3, control (Ctrl) probe-bound proteins. For HDAC2 western, lane 2, control probe-bound proteins; lane 3, 106 probe bound proteins. See ref (7) for detailed methods.
Functional Analysis
A total of 1556 proteins (10 keratin-contaminating proteins were discarded), which have average ratios (ABPP 106 versus control probe) greater than 2 or greater than 1.5 with p-value <0.05 (we define as ABPP 106 binders), were subjected to functional analysis in DAVID as well as in Ingenuity.
Gene ontology (GO) analysis for cellular components showed that the ABPP 106 binders are significantly enriched in broad GO FAT categories, including ribonucleoprotein complex (p = 1.68 × 10–39), spliceosome (p = 1.84 × 10⁻¹⁰), chromatin remodeling complex (p = 2.30 × 10⁻⁹), transcriptional repressor complex (p = 9.78 × 10⁻⁹), NuRD complex (p = 9.14 × 10⁻⁸), SWI/SNF chromatin remodeling complex (3.22 × 10⁻⁷), histone deacetylase complex (p = 7.62 × 10⁻⁵), and Sin3 complex (p = 0.002). GO analysis for molecular functions showed that ABPP 106 binders are mostly enriched in the GO FAT category of RNA binding (p = 7.93 × 10⁻³⁵). The GO FAT molecular function categories (p < 0.001) in which ABPP 106 binders are significantly enriched are shown in Figure S1a in the SI. GO analysis for biological processes showed that ABPP 106 binders are mostly enriched in the GO FAT category of translation elongation (p = 7.31 × 10⁻²⁷). The top ranking categories (p < 1 × 10⁻⁹) are shown in Figure S1b in the SI.
The SP-PIR keywords mostly enriched (p < 1 × 10⁻⁶) in our ABPP 106 binder set are shown in Figure S2 in the SI; 66.09% of the ABPP 106 binders belong to the category of acetylation, which makes the enrichment most significant (p = 1.25 × 10–194).
The KEGG pathway analysis shows 16 significantly enriched categories (p < 0.05) for ABPP 106 binders (Figure S3a in the SI), including ribosome, proteasome, spliceosome, etc. The Biocarta pathway analysis found 13 significant enrichment categories (Figure S3b in the SI) with the top category of control of gene expression by vitamin D receptor. The role of histone deacetylases in vitamin D-regulated gene expression is well established.23,24 The finding of ribosome-associated pathways is at first surprising since we used a nuclear extract in these experiments; however, it is well documented that ribosomes are assembled in nucleoli and many translation factors localize in the nucleus and participate in nuclear–cytoplasmic transport of mRNAs.25,26
Functional annotation of proteins binding ABPP 106, which combines the gene-term enrichment analysis done by GO, SP-PIR keywords, UP_SEQ_feature, KEGG and Biocarta pathways, Interpro and Smart protein domains, is shown in Table S1 in the SI (top ranking terms which have p < 1 × 10–18). We find that the most significant biological term associated with ABPP 106 binders across those analysis tools is acetylation, as would be expected. Other significant enrichment categories ranking on the top include ribonucleoprotein complex, RNA binding, RNA recognition motif, mRNA metabolic process, RNA splicing, mRNA processing, etc. The role of protein acetylation in these processes is beginning to be appreciated.27
By clustering functional annotation groups with similar annotations together according to shared gene members, the enrichment score reflects the biological significance of each annotation cluster. The top 10 clusters out of 56 clusters (high classification stringency), which have significant group enrichment scores (<0.05, equivalent to 1.3 in minus log scale), are shown in Table S2 in the SI. The most enriched annotation cluster is RNA recognition motif (representative annotation term).
A gene functional classification analysis distributes the ABPP 106 binders into 10 functional related gene clusters (highest classification stringency), which have significant functional enrichment scores (<0.05, equivalent to 1.3 in minus log). The top gene group includes several ribosomal proteins associated with the major biology term of translation/ribosome/RNA binding (Table S3 in the SI, the associated biology terms are manually summarized on the basis of gene terms enriched for each functional group).
We further performed pathway and disease analyses in Ingenuity. The pathway analysis shows that ABPP 106 binders are mostly enriched in the EIF2 signaling pathway (p = 1.26 × 10⁻¹²). The molecules (shown in red), which are enriched in the EIF2 signaling pathway, are illustrated in Figure S4a in the SI. The top ranking categories (p < 1 × 10⁻⁵) are shown in Figure S4b in the SI. Numerous reports have identified EIF2α and related proteins in the nucleus.28 Interestingly, pathogenesis of cardiomyopathy in a mouse model for FRDA correlates with the early and persistent eIF2α phosphorylation, which precedes activation of autophagy and apoptosis.29 The disease analysis shows that the “neurological disease” ranks at the top among the enriched disease categories (Table S4 in the SI).
The functional analysis results are included in SI Table S5.
Target Validation
One of the identified targets of the 106 probe is the transcription elongation factor TCEB2. Interestingly, the gene encoding TCEB2 was found to be up-regulated by HDACi 106 in primary lymphocytes from Friedreich’s ataxia patients.30 TCEB2 is of interest since down regulation of FXN mRNA synthesis is the primary cause of FRDA, and transcription elongation as well as initiation has been shown to be affected by the GAA repeats.31 To validate TCEB2 as a bonafide target or target-interacting protein of the 106-probe, we used Western blotting of the affinity-captured proteins with antibody to TCEB2 (Figure 5b). For this experiment, we validated capture of TCEB2 with a second version of the activity-based probe and a second control probe, whose structures are shown in Figure 5a. Figure 5b clearly shows that TCEB2 is captured by both specific probes, but not by the control probe, providing validation of the proteomic analysis for TCEB2. Validation experiments for other identified targets is beyond the scope of the present study.
Discussion
In the present study, the targets of HDAC inhibitor ABPP 106 probe and interacting proteins have been identified in FRDA patient-derived neural stem cells by dimethyl labeling quantitative mass spectrometry combined with MudPIT. The ABPP approach, which allows the use of harsh protein denaturing conditions after the probes are cross-linked to the protein to remove noncovalently bound proteins, allowed us to purify either direct targets of 106 probe or interactors in close proximity to the direct targets of the native activity.32 The inactive analogue of the 106 probe, which differs from 106 by a simple amino group,7 provides a control for specificity. In our previous study,7 we found that only the 106 probe, but not the control probe, was able to identify HDACs in nuclear lysates. A competition step with excess free compound 106 can also be employed in the experimental design to further confirm the selectivity of the 106 probe. To differentiate the specific targets from nonspecific binding proteins of the 106 probe, quantitative proteome analysis is particularly important. Dimethyl labeling provided a fast and straightforward quantification method17 to exclude the nonspecific binding proteins.
Bantscheff and colleagues revealed HDAC complexes selectivity for 16 HDAC inhibitors by combining affinity capture and quantitative mass spectrometry. They found that the aminobenzamide inhibitors have preferred selectivity for the HDAC3-NCoR complex.33 HDAC3 was found to be a preferred cellular target of the 106 probe.7 However, HDAC3 was not identified in our data set although control Western blotting experiments reproducibly detected HDAC3 in the 106-probe pull-downs. While detectable by Western blotting (Figure 4), HDAC3 may have been too low in abundance in the proteome of neural stem cells differentiated from FRDA patient iPS cells for detection by mass spectrometry, or we were unable to digest the protein effectively off the streptavidin bead. Recombinant HDAC1 and 2 show less affinity for the 106 probe compared to HDAC3, and it is less active in nuclear extracts of lymphoid cell line derived from an FRDA patient.7 In contrast, we found HDAC1 and 2 were selectively bound to the 106 probe, indicating an interaction of HDAC1 and 2 with 106 probe in neural stem cells. We compared the proteins bound to ABPP 106 with the interactome of HDAC1–11 identified by Cristea and colleagues.34 The Venn diagram (Figure 6) shows that 18 proteins are shared among ABPP 106 binders and HDAC1–3 interactome and 27 proteins are shared among ABPP 106 binders and HDAC4–11 interactome. The comparison showed that 106 probe binds a broad range of HDAC1–11 interactors rather than binding to only the interactors of class I HDACs, indicating that the restoration of frataxin gene transcription by 106 probe may be due to the coordination of multiple HDACs. The overlap in the Venn diagram (Figure 6) is quite low as the overlap between the two data sets may be more representative of the interactors of HDAC1–3 rather than HDAC4–11.
Figure 6.

Comparison of ABPP 106 probe binders with HDAC1–11 interactome. Eighteen overlapping proteins between ABPP 106 binders and HDAC1–3 interactome are listed in the box.
On the basis of the functional analyses from DAVID and Ingenuity, the proteins specifically binding the ABPP 106 probe were found to be mainly enriched in the regulation of transcription and post-transcription events, such as RNA splicing and translation. It has been shown that frataxin deficiency in FRDA is caused by transcriptional silencing.1 One mechanism for frataxin gene silencing is the epigenetic gene silencing through heterochromatin formation.1 It has been shown that histones H3 and H4 are hypoacetylated in the first intron of the inactivated frataxin gene, accompanied by trimethylation of lysine 9 of histone H3, which is a hallmark of heterochromatin.1,35 We found ABPP 106 probe specific proteins were mostly enriched in the category of acetylation in SP-PIR keywords across all the selected gene term enrichment analyses done in DAVID, indicating compound 106 may up-regulate frataxin gene transcription by selectively targeting proteins affecting acetylation. The transcription repression complex, the NuRD and Sin3 complexes which contain HDAC1 and HDAC2, were enriched in the ABPP 106 specific protein fraction, suggesting that inhibition of HDAC1 and 2 may play a role in frataxin gene expression restoration. SWI/SNF chromatin remodeling complex is also significantly enriched among the ABPP 106 specific proteins. The Wierzbicki lab proposed that RNA polymerase V-produced long noncoding RNAs guide the SWI/SNF complex and establish positioned nucleosomes on specific genomic loci to mediate transcriptional silencing,36 which supports the hypothesis that compound 106 may reverse frataxin gene silencing by targeting the SWI/SNF complex.
We found targets of ABPP 106 probe are also involved in RNA processing and translation. One study has shown that Drosophila small nuclear ribonucleoprotein SmD1, involved in splicing, is required for assembly and function of the small interfering RISC, suggesting the role of Drosophila SmD1 in RNAi-mediated gene silencing besides its pre-mRNA splicing activity in posttranscriptional gene regulation.37 Proteins involved in the ribonucleoprotein complex and splicesome are enriched in the ABPP 106 probe specific proteins. Surprisingly, we found that the EIF2 signaling pathway and ribosome are also enriched, suggesting that the compound 106 may affect mRNA translation. There exists ample evidence in the literature for localization of many translation factors in the nuclear compartment and their role in mRNA metabolism and transport (refs above). Moreover, the finding of ribosomal proteins in the nucleus is not surprising since ribosomes are assembled in nucleoli. It has been shown that abnormal control of eIF2 and eIF2B leads to CACH (childhood ataxia with central nervous system hypomyelination)/VWM (leukoencephalopathy with vanishing white matter) syndrome in young children, which is a severe autosomal recessive neurodegenerative disease.38 The ribosome binding and translation initiation as well as translation elongation and termination strongly influence mRNA stability in bacteria.39 In eukaryotes, translation is also linked to mRNA stability, suggesting a general model for cotranslational mRNA decay.40−42 It is possible that compound 106 could have a positive effect on translation of frataxin mRNA in addition to its documented effect on transcription of the FXN gene.6 Additionally, HDAC inhibition could have a positive effect on FXN mRNA splicing or stability, and this in turn could also result in the observed increases in frataxin protein on treatment of FRDA cells with 2-aminobenzamide HDAC inhibitors. Future studies will be needed to assess this possibility.
The beneficial effects of HDAC inhibition in Huntington’s disease have been reviewed.12 In particular, HDAC inhibition can have positive effects in restoring global gene expression profiles,3,13 in ameliorating cytoskeletal defects12 and clearance of mutant Htt protein by the ubiquitin–proteosome system.2 Our current findings of diverse targets of the 2-aminobenzamides suggest that there are other potentially beneficial mechanisms of action, such as increased processing or translation of mRNAs that are down-regulated by mutant Htt at the transcriptional level, among other possibilities suggested by the wide range of pathways identified as influenced by the 2-aminobenzamides.
On a final note, the finding of a large number of targets of the 106 probe or interacting proteins could potentially raise concern for the use of 2-aminobenzamides as human therapeutics due to potential undesirable side effects. Similarly, the 2-aminobenzamides induce changes in global gene expression patterns in human lymphocytes treated ex vivo,30 again raising concern for off-target effects. In spite of these findings, a related 2-aminobenzamide, HDACi 109,9 has been subjected to a phase I dose-escalation clinical study in human FRDA patients, with no reported adverse effects, even on exposure to 240 mg drug/day,11 suggesting that potential off-target effects are not of serious concern.
Conclusion
The 2-aminobenzamide class of histone deacetylase inhibitors is of great value for the neurodegenerative diseases, Friedreich’s ataxia and Huntington’s disease. The present study applied dimethyl labeling quantitative mass spectrometry combined with MudPIT to identify the targets of compound 106, and performed functional analyses of the targets. The findings show that the targets of compound 106 are involved not only in transcriptional regulation but also in mRNA translation, indicating the complexity of the mechanisms by which compound 106 may exert its effect in up-regulation of frataxin expression.
Acknowledgments
We wish to thank Elisabetta Soragni and Erica Campau for help with iPSC differentiation. Studies in the Gottesfeld lab were supported by a grant from the National Institutes for Neurological Disorders and Stroke (R01 NS063856). C.X. was supported by a postdoctoral fellowship from the Friedreich’s Ataxia Research Alliance (FARA). The Yates laboratory is supported by R01 MH068770, P41 GM103533, R01MH100175 and HHSN268201000035C Grants from NIH.
Supporting Information Available
Figures S1–4 and Tables S1–5: protein quantification and functional analysis information. This material is available free of charge via the Internet at http://pubs.acs.org.
Author Contributions
# B.S. and C.X. contributed equally
The authors declare no competing financial interest.
Funding Statement
National Institutes of Health, United States
Supplementary Material
References
- Gottesfeld J. M.; Rusche J. R.; Pandolfo M. Increasing frataxin gene expression with histone deacetylase inhibitors as a therapeutic approach for Friedreich’s ataxia. J. Neurochem 2013, 126Suppl 1147–154. [DOI] [PMC free article] [PubMed] [Google Scholar]
- Jia H.; Kast R. J.; Steffan J. S.; Thomas E. A. Selective histone deacetylase (HDAC) inhibition imparts beneficial effects in Huntington’s disease mice: implications for the ubiquitin-proteasomal and autophagy systems. Hum. Mol. Genet. 2012, 21245280–5293. [DOI] [PMC free article] [PubMed] [Google Scholar]
- Jia H.; Pallos J.; Jacques V.; Lau A.; Tang B.; Cooper A.; Syed A.; Purcell J.; Chen Y.; Sharma S.; Sangrey G. R.; Darnell S. B.; Plasterer H.; Sadri-Vakili G.; Gottesfeld J. M.; Thompson L. M.; Rusche J. R.; Marsh J. L.; Thomas E. A. Histone deacetylase (HDAC) inhibitors targeting HDAC3 and HDAC1 ameliorate polyglutamine-elicited phenotypes in model systems of Huntington’s disease. Neurobiol. Dis. 2012, 462351–361. [DOI] [PMC free article] [PubMed] [Google Scholar]
- Pandolfo M. Friedreich ataxia. Semin. Pediatr. Neurol. 2003, 103163–172. [DOI] [PubMed] [Google Scholar]
- Herman D.; Jenssen K.; Burnett R.; Soragni E.; Perlman S. L.; Gottesfeld J. M. Histone deacetylase inhibitors reverse gene silencing in Friedreich’s ataxia. Nat. Chem. Biol. 2006, 210551–558. [DOI] [PubMed] [Google Scholar]
- Chou C. J.; Herman D.; Gottesfeld J. M. Pimelic diphenylamide 106 is a slow, tight-binding inhibitor of class I histone deacetylases. J. Biol. Chem. 2008, 2835135402–35409. [DOI] [PMC free article] [PubMed] [Google Scholar]
- Xu C.; Soragni E.; Chou C. J.; Herman D.; Plasterer H. L.; Rusche J. R.; Gottesfeld J. M. Chemical probes identify a role for histone deacetylase 3 in Friedreich’s ataxia gene silencing. Chem. Biol. 2009, 169980–989. [DOI] [PMC free article] [PubMed] [Google Scholar]
- Rai M.; Soragni E.; Jenssen K.; Burnett R.; Herman D.; Coppola G.; Geschwind D. H.; Gottesfeld J. M.; Pandolfo M. HDAC inhibitors correct frataxin deficiency in a Friedreich ataxia mouse model. PLoS One 2008, 34e1958. [DOI] [PMC free article] [PubMed] [Google Scholar]
- Rai M.; Soragni E.; Chou C. J.; Barnes G.; Jones S.; Rusche J. R.; Gottesfeld J. M.; Pandolfo M. Two new pimelic diphenylamide HDAC inhibitors induce sustained frataxin upregulation in cells from Friedreich’s ataxia patients and in a mouse model. PLoS One 2010, 51e8825. [DOI] [PMC free article] [PubMed] [Google Scholar]
- Sandi C.; Pinto R. M.; Al-Mahdawi S.; Ezzatizadeh V.; Barnes G.; Jones S.; Rusche J. R.; Gottesfeld J. M.; Pook M. A. Prolonged treatment with pimelic o-aminobenzamide HDAC inhibitors ameliorates the disease phenotype of a Friedreich ataxia mouse model. Neurobiol. Dis. 2011, 423496–505. [DOI] [PMC free article] [PubMed] [Google Scholar]
- Soragni E., et al. Epigenetic therapy for Friedreich’s ataxia: Evaluation in patient iPSC-derived neuronal cells and in a Phase I clinical trial. 5th Ataxia Investigators Meeting (AIM), Las Vegas, NV, March 18–21, 2014.
- Kazantsev A. G.; Thompson L. M. Therapeutic application of histone deacetylase inhibitors for central nervous system disorders. Nat. Rev. Drug Discovery 2008, 710854–868. [DOI] [PubMed] [Google Scholar]
- Thomas E. A.; Coppola G.; Desplats P. A.; Tang B.; Soragni E.; Burnett R.; Gao F.; Fitzgerald K. M.; Borok J. F.; Herman D.; Geschwind D. H.; Gottesfeld J. M. The HDAC inhibitor 4b ameliorates the disease phenotype and transcriptional abnormalities in Huntington’s disease transgenic mice. Proc. Natl. Acad. Sci. U.S.A. 2008, 1054015564–15569. [DOI] [PMC free article] [PubMed] [Google Scholar]
- Butler K. V.; Kozikowski A. P. Chemical origins of isoform selectivity in histone deacetylase inhibitors. Curr. Pharm. Des 2008, 146505–528. [DOI] [PubMed] [Google Scholar]
- Washburn M. P.; Wolters D.; Yates J. R. III. Large-scale analysis of the yeast proteome by multidimensional protein identification technology. Nat. Biotechnol. 2001, 193242–247. [DOI] [PubMed] [Google Scholar]
- Du J.; Campau E.; Soragni E.; Ku S.; Puckett J. W.; Dervan P. B.; Gottesfeld J. M. Role of mismatch repair enzymes in GAA.TTC triplet-repeat expansion in Friedreich ataxia induced pluripotent stem cells. J. Biol. Chem. 2012, 2873529861–29872. [DOI] [PMC free article] [PubMed] [Google Scholar]
- Boersema P. J.; Raijmakers R.; Lemeer S.; Mohammed S.; Heck A. J. , Multiplex peptide stable isotope dimethyl labeling for quantitative proteomics. Nat. Protoc 2009, 44484–494. [DOI] [PubMed] [Google Scholar]
- Wong C. C.; Cociorva D.; Miller C. A.; Schmidt A.; Monell C.; Aebersold R.; Yates J. R. III. Proteomics of Pyrococcus furiosus (Pfu): Identification of Extracted Proteins by Three Independent Methods. J. Proteome Res. 2013, 122763–770. [DOI] [PMC free article] [PubMed] [Google Scholar]
- Xu Tao; V J.; Park S. K.; Cociorva D.; Lu B.; Liao L.; Hewel J.; Wong C. C. L.; Han X.; Wohlschlegel J.; Yates J. R. III. ProLuCID: using probability and statistical scores to improve sensitivity and specificity of CID and ETD database search results. Mol. Cell Proteomics 2006, 5, S174. [Google Scholar]
- Tabb D. L.; McDonald W. H.; Yates J. R. III. DTASelect and Contrast: tools for assembling and comparing protein identifications from shotgun proteomics. J. Proteome Res. 2002, 1121–26. [DOI] [PMC free article] [PubMed] [Google Scholar]
- Park S. K.; Venable J. D.; Xu T.; Yates J. R. III. A quantitative analysis software tool for mass spectrometry-based proteomics. Nat. Methods 2008, 54319–322. [DOI] [PMC free article] [PubMed] [Google Scholar]
- Huang da W.; Sherman B. T.; Lempicki R. A. Systematic and integrative analysis of large gene lists using DAVID bioinformatics resources. Nat. Protoc. 2009, 4144–57. [DOI] [PubMed] [Google Scholar]
- Polly P.; Herdick M.; Moehren U.; Baniahmad A.; Heinzel T.; Carlberg C. VDR-Alien: a novel, DNA-selective vitamin D(3) receptor-corepressor partnership. FASEB J. 2000, 14101455–1463. [DOI] [PubMed] [Google Scholar]
- Seuter S.; Heikkinen S.; Carlberg C. Chromatin acetylation at transcription start sites and vitamin D receptor binding regions relates to effects of 1alpha,25-dihydroxyvitamin D3 and histone deacetylase inhibitors on gene expression. Nucleic Acids Res. 2013, 411110–124. [DOI] [PMC free article] [PubMed] [Google Scholar]
- Lejbkowicz F.; Goyer C.; Darveau A.; Neron S.; Lemieux R.; Sonenberg N. A fraction of the mRNA 5′ cap-binding protein, eukaryotic initiation factor 4E, localizes to the nucleus. Proc. Natl. Acad. Sci. U. S. A. 1992, 89209612–9616. [DOI] [PMC free article] [PubMed] [Google Scholar]
- Dostie J.; Ferraiuolo M.; Pause A.; Adam S. A.; Sonenberg N. A novel shuttling protein, 4E-T, mediates the nuclear import of the mRNA 5′ cap-binding protein, eIF4E. EMBO J. 2000, 19123142–56. [DOI] [PMC free article] [PubMed] [Google Scholar]
- Spange S.; Wagner T.; Heinzel T.; Kramer O. H. Acetylation of non-histone proteins modulates cellular signalling at multiple levels. Int. J. Biochem. Cell Biol. 2009, 411185–198. [DOI] [PubMed] [Google Scholar]
- Lobo M. V.; Alonso F. J.; Rodriguez S.; Alcazar A.; Martin E.; Munoz F.; R G. S.; Salinas M.; Fando J. L. Localization of eukaryotic initiation factor 2 in neuron primary cultures and established cell lines. Histochem. J. 1997, 296453–468. [DOI] [PubMed] [Google Scholar]
- Huang M. L.; Sivagurunathan S.; Ting S.; Jansson P. J.; Austin C. J.; Kelly M.; Semsarian C.; Zhang D.; Richardson D. R. Molecular and functional alterations in a mouse cardiac model of Friedreich ataxia: activation of the integrated stress response, eIF2alpha phosphorylation, and the induction of downstream targets. Am. J. Pathol. 2013, 1833745–757. [DOI] [PubMed] [Google Scholar]
- Coppola G.; Burnett R.; Perlman S.; Versano R.; Gao F.; Plasterer H.; Rai M.; Sacca F.; Filla A.; Lynch D. R.; Rusche J. R.; Gottesfeld J. M.; Pandolfo M.; Geschwind D. H. A gene expression phenotype in lymphocytes from Friedreich ataxia patients. Ann. Neurol. 2011, 705790–804. [DOI] [PMC free article] [PubMed] [Google Scholar]
- Yandim C.; Natisvili T.; Festenstein R. Gene regulation and epigenetics in Friedreich’s ataxia. J. Neurochem. 2013, 126Suppl 121–42. [DOI] [PubMed] [Google Scholar]
- Salisbury C. M.; Cravatt B. F. Activity-based probes for proteomic profiling of histone deacetylase complexes. Proc. Natl. Acad. Sci. U.S.A. 2007, 10441171–1176. [DOI] [PMC free article] [PubMed] [Google Scholar]
- Bantscheff M.; Hopf C.; Savitski M. M.; Dittmann A.; Grandi P.; Michon A. M.; Schlegl J.; Abraham Y.; Becher I.; Bergamini G.; Boesche M.; Delling M.; Dumpelfeld B.; Eberhard D.; Huthmacher C.; Mathieson T.; Poeckel D.; Reader V.; Strunk K.; Sweetman G.; Kruse U.; Neubauer G.; Ramsden N. G.; Drewes G. Chemoproteomics profiling of HDAC inhibitors reveals selective targeting of HDAC complexes. Nat. Biotechnol. 2011, 293255–65. [DOI] [PubMed] [Google Scholar]
- Joshi P.; Greco T. M.; Guise A. J.; Luo Y.; Yu F.; Nesvizhskii A. I.; Cristea I. M. The functional interactome landscape of the human histone deacetylase family. Mol. Syst. Biol. 2013, 9, 672. [DOI] [PMC free article] [PubMed] [Google Scholar]
- Saveliev A.; Everett C.; Sharpe T.; Webster Z.; Festenstein R. DNA triplet repeats mediate heterochromatin-protein-1-sensitive variegated gene silencing. Nature 2003, 4226934909–913. [DOI] [PubMed] [Google Scholar]
- Zhu Y.; Rowley M. J.; Bohmdorfer G.; Wierzbicki A. T. A SWI/SNF chromatin-remodeling complex acts in noncoding RNA-mediated transcriptional silencing. Mol. Cell 2013, 492298–309. [DOI] [PMC free article] [PubMed] [Google Scholar]
- Xiong X. P.; Kurthkoti K.; Chang K. Y.; Lichinchi G.; De N.; Schneemann A.; MacRae I. J.; Rana T. M.; Perrimon N.; Zhou R. Core small nuclear ribonucleoprotein particle splicing factor SmD1 modulates RNA interference in Drosophila. Proc. Natl. Acad. Sci. U.S.A. 2013, 1104116520–16525. [DOI] [PMC free article] [PubMed] [Google Scholar]
- Fogli A.; Boespflug-Tanguy O. The large spectrum of eIF2B-related diseases. Biochem. Soc. Trans. 2006, 34Pt 122–29. [DOI] [PubMed] [Google Scholar]
- Deana A.; Belasco J. G. Lost in translation: the influence of ribosomes on bacterial mRNA decay. Genes Dev. 2005, 19212526–2533. [DOI] [PubMed] [Google Scholar]
- Ross J. mRNA stability in mammalian cells. Microbiol. Rev. 1995, 593423–50. [DOI] [PMC free article] [PubMed] [Google Scholar]
- Gay D. A.; Sisodia S. S.; Cleveland D. W. Autoregulatory control of beta-tubulin mRNA stability is linked to translation elongation. Proc. Natl. Acad. Sci. U.S.A. 1989, 86155763–5767. [DOI] [PMC free article] [PubMed] [Google Scholar]
- Oliveira C. C.; McCarthy J. E. The relationship between eukaryotic translation and mRNA stability. A short upstream open reading frame strongly inhibits translational initiation and greatly accelerates mRNA degradation in the yeast Saccharomyces cerevisiae. J. Biol. Chem. 1995, 270158936–8943. [DOI] [PubMed] [Google Scholar]
Associated Data
This section collects any data citations, data availability statements, or supplementary materials included in this article.