

Abstract
Fuchs’ endothelial corneal dystrophy (FECD) is a major corneal disorder affecting the innermost part of the cornea, leading to visual impairment. As the morphological changes in FECD are mainly observed in the extracellular matrix of the Descemet’s membrane/endothelial layer, we determined the protein profiles of diseased and control tissues using two relative quantitation MS methods. The first quantitation method, based on the areas of the extracted ion chromatograms, quantified the 51 and 48 most abundant proteins of the Descemet’s membrane/endothelial layer in patient and control tissues, respectively, of which 10 were significantly regulated. The results indicated that the level of type VIII collagen was unaltered even though the protein previously has been shown to be implicated in familial early-onset forms of the disease. Using the second relative quantitation method, iTRAQ, we identified 22 differentially regulated proteins, many of which are extracellular proteins known to be involved in proper assembly of the basement membrane in other tissues. In total, 26 differentially regulated proteins were identified, of which 6 proteins were regulated in both methods. These results support that the morphological changes observed in FECD are caused in part by an aberrant assembly of the extracellular matrix within the Descemet’s membrane/endothelial layer.
Keywords: Fuchs’ endothelial corneal dystrophy, cornea, Descemet’s membrane, extracted ion chromatogram, iTRAQ
Introduction
Fuchs’ endothelial corneal dystrophy (FECD) is a frequently observed corneal disease and is generally regarded as an inherited disorder.1 The prevalence of corneal dystrophies in the U.S. was estimated in 2011 to affect approximately 278,000 people. Approximately 60% of the incidences were associated with the endothelium, of which FECD is a major contributor.1,2 FECD manifests in the innermost layer of the cornea, affecting Descemet’s membrane and the endothelium. Morphological changes in FECD include abnormal loss of endothelial cells, thickening of Descemet’s membrane, and protein accumulation between cells of the endothelium, known as guttae.1 As FECD progresses, there is an abnormal loss of endothelial cells, which leads to corneal edema ultimately affecting the stroma and epithelium and causing visual impairment.3
FECD occurs as a rare early-onset variant and a more common late-onset variant. The early-onset variant is normally detectable within the third or fourth decade of life and has been associated with mutations within the COL8A2 gene encoding the collagen alpha-2 (VIII) chain.4,5 Late-onset FECD is detectable during the fourth or fifth decade of life, constitutes the vast majority of FECD cases, and occurs with higher frequency in women than in men.6 Regions on chromosomes 5 (5q33.1-q35.2), 9 (9p24.1-22.1), 13 (13pTel-3q12.13), and 18 (18q21.2-q21.32) have been suggested to contain genes encoding proteins involved in late-onset FECD.7−10 Even though no direct link has been found, the TCF4 and TCF8 genes encoding the transcription factors 4 and 8 have been associated with the disease.11,12 In addition, mutations within the SLC4A11 gene encoding sodium bicarbonate transporter-like protein 11 have also been linked to late-onset FECD.13 Thus, late-onset FECD may have multiple genetic contributors rather than being caused by a single gene alteration.
Besides genetic alterations, environmental factors such as oxidative stress and accumulation of advanced glycation end-products have also been associated with FECD.14−17 Protein accumulation is an additional aspect of FECD, which is observed as a thickening of Descemet’s membrane. The thickening has been suggested to involve an increased secretion of type VIII collagen by endothelial cells.18,19 Furthermore, studies of FECD have shown an increased amount of TGFBIp within the Descemet’s membrane/endothelial layer, and more specifically TGFBIp together with clusterin has been shown to be present in the deposits forming the guttae.20,21
We have previously performed a quantitative label-free MS analysis of the Descemets’s membrane/endothelial layer of the healthy human cornea.22 In the present study, we use a similar label-free quantitative MS analysis as well as an isotope tag-based quantitative MS analysis of FECD tissue to gain insight into the pathophysiology of the disease. Human tissue from five females and five males affected by late-onset FECD were compared to four age-matched control samples. In total, we identified 26 significantly regulated proteins, of which the majority are related to the extracellular scaffold arrangement in the basement membrane of the endothelium.
Experimental Procedures
FECD and Control Tissue
Tissue samples were obtained from late-onset FECD patients undergoing endothelial keratoplasty with transplantation of a donor Descemet’s membrane with endothelium. Upon surgical removal of the diseased Descemet’s membrane/endothelial layer, the tissue was immediately stored at −80 °C until further processing. A total of 10 FECD tissue samples were collected comprising five females and five males with an average age of 72.5 years (min 56 years, max 83 years). As controls, complementary non-FECD tissue (secondary bullous keratopathy) isolated by the same technique as for the FECD tissue from four female patients with an average age of 69 years (min 51 years, max 88 years) were included. The tissue was obtained and used for scientific purpose, and ethical issues have been handled according to Danish healthcare law, and after guidance from the local ethical committee and national health authorities, and in accordance with the Declaration of Helsinki.
Sample Preparation for LC–MS/MS: In-Solution Digest
Patient and control tissues were lyophilized for 10 h using a speedvac concentrator before subjection to 0.66 M CNBr in 70% trifluoroacetic acid at 23 °C. The next day, the tissues were lyophilized and resuspended in 8 M urea in 0.2 M Tris-HCl, pH 8.3, reduced in 15 mM dithiothreitol for 1 h, and alkylated in 30 mM iodoacetamide for 1 h. The samples were diluted 5 times in 0.1 M Tris-HCl, pH 8.3, and digested overnight with 1:50 w/w sequencing grade modified trypsin (Promega, Madison, WI, USA) at 37 °C for 16 h at room temperature in a final volume of 0.5 mL. The samples were desalted using POROS 50 R2 RP column material (Applied Biosystems, Foster City, CA, USA) packed in GELoader Tips (Eppendorf, Hamburg, Germany).
Amino Acid Analysis
Concentrations of the in-solution digested samples were determined by amino acid analysis: 5 μL of each sample was dried in 500-μL polypropylene vials that were placed in 22-mL glass vials (Wheaton, Millville, NJ, USA). A total of 200 μL of hydrolysis buffer (6 N HCl, 0.1% phenol, 0.1% thioglycolic acid) was placed at the bottom of the glass vial, which was subsequently purged with argon, closed with a MiniInert valve (Pierce, Rockford, IL, USA), and evacuated to <5 mbar. The samples were then heated to 110 °C for 20 h, dried and redissolved in loading buffer pH 2.20 containing 1 nmol NorLeu, and injected on a BioChrom 31 amino acid analyzer. The resulting data were analyzed by an in-house program AAA ver. 1.03, which calculates protein composition and total protein amount and corrects for intensity changes of ninhydrin.
iTRAQ Labeling and Strong Cation-Exchange Fractionation
Isobaric tags for relative and absolute quantification (iTRAQ) analysis was performed using 10 μg of in-solution digested sample from each patient and control. Samples were labeled with iTRAQ 4plex (AB SCIEX, Framingham, MA, USA) according to the manufacturer’s protocol, resulting in a total of five sets of 4plex experiments (Figure 1). A mixed sample containing 5 μg of sample from each of the patients and controls was labeled with the iTRAQ 114-tag in all five experiments and used to normalize between experiments. Each 4plex experiment was diluted 10 times in buffer A (0.5% formic acid and 5% acetonitrile) and separated on a Higgins Analytical strong cation exchange (SCX) column (PL-SCX 1000 Å 5 μm 20 × 2.1 mm column, Higgins Analytical, Rengstorff, CA, USA) equilibrated in buffer A and connected to an Ettan LC system (GE Healthcare, Wauwatosa, WI, USA). The peptides were eluted using a 100 μL/min flow rate and a 1% B/min linear gradient from buffer A to buffer B (buffer B containing 1 M NaCl). The 15 collected fractions were lyophilized, redissolved in 100 μL 0.1% formic acid, and desalted using POROS 50 R2 material packed in GELoader tips. The desalted samples were lyophilized and resuspended in 12 μL 0.1% formic acid and stored at −20 °C.
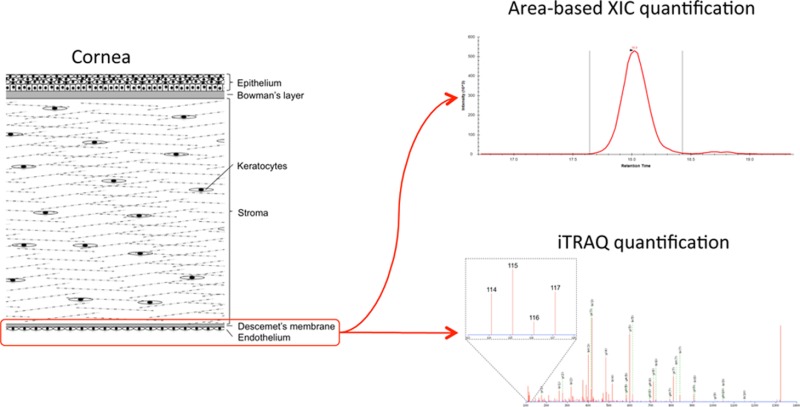
Figure 1.

Experimental setup. The Descemet’s membrane/endothelial layer from 10 FECD patients and 4 controls were subjected to two different quantitative LC–MS/MS analyses: area-based extracted ion chromatogram (XIC) and isobaric tags for relative and absolute quantification (iTRAQ). Skyline was used to perform area-based XIC quantification on all 56 LC–MS/MS analyses to provide the relative protein abundances in individual tissue samples (left). The iTRAQ-based quantification was used to find protein regulations between patients and controls (right). Five sets of iTRAQ labeling were performed to cover all tissue samples. Each iTRAQ set contained a Mix sample constituting tissue from all FECD and control samples (Mix). The Mix sample was used to normalize between the five iTRAQ sets (SCX 1–5). Labeling was done according to the schema and fractionated using SCX (brackets indicate labeling tag in the iTRAQ 4plex). Five SCX runs were performed (SCX 1–5), and the collected fractions from each run were analyzed by LC–MS/MS and searched against all human sequences in the Swiss-Prot database using the Mascot search engine. Finally, iTRAQ data were parsed using MS Data Miner (MDM). All raw data were deposited to the ProteomeXchange consortium.
LC–MS/MS Analysis
LC–MS/MS analyses were performed on an EASY-nLC II system (Thermo Fisher Scientific, Waltham, MA, USA) connected to a TripleTOF 5600 mass spectrometer (AB SCIEX, Framingham, MA, USA) equipped with a NanoSpray III source (AB SCIEX, Framingham, MA, USA) and operated under Analyst TF 1.6.0 control. The CNBr and trypsin cleaved samples were dissolved in 0.1% formic acid, injected and trapped on a Biosphere C18 column (5 μm, 2 cm × 100 μm i.d.; Nano Separations, Nieuwkoop, Netherlands). Next, the peptides were eluted from the trap column and separated on a 15 cm analytical column (75 μm i.d.) packed in-house in a fritted silica tip (New Objectives, Woburn, MA, USA) with RP ReproSil-Pur C18-AQ 3 μm resin (Dr. Maisch GmbH, Ammerbuch-Entringen, Germany) connected in-line to the mass spectrometer. Peptides were eluted at a flow rate of 250 nL/min using a 50 min gradient from 5% to 35% phase B (0.1% formic acid and 90% acetonitrile). The acquisition method used for the area-based extracted ion chromatogram (XIC) quantification methods was set up as an information-dependent acquisition (IDA) experiment collecting up to 25 MS/MS spectra in each 1.6 s cycle using an exclusion window of 6 s. For iTRAQ experiments, the IDA settings were changed to 50 MS/MS per cycle and a 2.8 s cycle time. Two iTRAQ experiments were performed on each 4plex with iTRAQ collision energy adjustment either enabled or disabled.
Quantitation Based on Areas of the Extracted Ion Chromatograms (XIC)
All MS files were processed using Skyline v. 2.1.0.4936 (MacCoss Lab, University of Washington).23 The MS files were converted to Mascot generic format (MGF) using the AB SCIEX MS Data Converter beta 1.3 (AB SCIEX) and the “proteinpilot MGF” parameters. The peak lists were used to interrogate the Swiss-Prot (v. 2013_11, 541,762 sequences) Homo sapiens (20,279 sequences) database using Mascot 2.3.0224 (Matrix science, London, U.K.). Trypsin was selected as the digestion enzyme allowing one missed cleavage. Carbamidomethyl was entered as a fixed modification, whereas hydroxylation of proline residues was allowed as variable modification. The data were searched with a mass tolerance of the precursor and product ions of 10 ppm and 0.2 Da using ESI-QUAD-TOF as the instrument setting. The significance threshold (p) was set at 0.01, and the ion score expect cutoff at 0.005. Mascot dat result files were used to generate a spectral library in Skyline using the human sequences from Swiss-Prot as background proteome. Employing the same parameters as for the Mascot search, the three most abundant peptides for each protein were manually chosen from all peptides available in the spectral library except methionine-containing peptides. Proteins identified with less than 3 peptides were not included in XIC. In addition, only peptides quantified with an idotp value of ≥90 were included for area-based XIC quantification. This label-free quantification protocol relied on the average MS signal (area) response for the three most intense tryptic peptides in each protein.25 The relative abundance and standard deviation of proteins quantified in a minimum of three of the technical replicates was calculated as the average MS intensity (area) for the three peptides for each protein divided by the sum of the average signal (area) for all quantified proteins in the sample. A Student’s t test (p = 0.05) was applied to test the area-based XIC data for significantly regulated proteins between the FECD and control groups. The Student’s t test and average protein amounts were calculated only on proteins quantified in a minimum of six patients in the FECD group and a minimum of three individuals in the control group.
iTRAQ Quantification
The collected iTRAQ MS files were converted to Mascot generic format (MGF) using the AB SCIEX MS Data Converter beta 1.3 (AB SCIEX, Framingham, MA, USA) and the “proteinpilot MGF” parameters. Each peak list for the two iTRAQ experiments with different collision settings were merged and searched against the Swiss-Prot (version 2013_11) Homo sapiens (20,279 sequences) database using Mascot 2.3.02 (Matrix Science, London, UK). Trypsin was employed as digestion enzyme allowing one missed cleavage. Carbamidomethyl was entered as a fixed modification, hydroxylation of proline was entered as a variable modification, and all methionine-containing peptides were ignored. The mass tolerance of the precursor and product ions were 10 ppm and 0.2 Da, the instrument setting was specified as ESI-QUAD-TOF, and the iTRAQ 4plex protocol was selected as quantitation method. The significance threshold (p) was set at 0.01, the ion score expect cutoff at 0.005, and all iTRAQ ratios were normalized based on summed intensities. Mascot iTRAQ results were parsed using MS Data Miner v. 1.2.2,26 and only proteins quantified with a minimum of 3 unique peptides were used for further analysis. To find significantly regulated proteins, a Student’s t test with a significant threshold of 0.05 was performed for all proteins quantified in more than half of the biological replicates from each group (FECD and Controls) (Supplementary Table 2).
Results
Relative Protein Abundances
Area-based XIC label-free quantification was used to obtain information about the relative protein abundances in the patient and control samples. The area-based XIC label-free quantification method relies on the average XIC area of the three most intense peptides from a given protein identified in a given MS analysis.25 For the area-based XIC quantification, we used direct LC–MS/MS analysis of in-solution digests of all biological replicates. For each biological replicate, four technical MS replicates were performed to account for technical variance. In total, 56 LC–MS/MS analyses were performed in the area-based XIC part of the present study. The relative protein abundance of the individual proteins in the individual LC–MS/MS analysis was calculated as the average intensity (area) of the three most intense peptides representing the protein, relative to the total sum of the average signal (area) for all quantified proteins in the sample. Protein averages across all biological replicates within the FECD group and control group were calculated from proteins quantified in at least six of FECD samples and three control samples. This resulted in 51 area-based XIC quantified proteins derived from the FECD group and 48 proteins from the control group (Table 1 and Supplementary Table 1). The quantified proteins in the two groups were similar in composition, and only 7 proteins were unique to the FECD group and 4 proteins were unique to the control group (Table 1). However, except for periostin in the control group and olfactomedin-like protein 1 in the FECD group, all remaining proteins quantified only either in the FECD group (6 proteins) or in the control group (3 proteins) were identified in the majority of the biological replicates (>2/4) of their respective counter group. Therefore, all quantified proteins unique to one of the tissues most likely do not represent an on/off regulation.
Table 1. Relative Protein Abundances in Control and FECD Tissuea.
| control tissue | % | FECD tissue | % | ||
|---|---|---|---|---|---|
| 1 | Transforming growth factor-beta-induced protein ig-h3 | 38.6 ± 10.0 | 1 | Transforming growth factor-beta-induced protein ig-h3 | 49.5 ± 8.8 |
| 2 | Collagen alpha-3(IV) chain | 9.9 ± 1.8 | 2 | Collagen alpha-2(VIII) chain | 10.7 ± 5.0 |
| 3 | Collagen alpha-2(VIII) chain | 9.1 ± 3.6 | 3 | Collagen alpha-3(IV) chain | 9.3 ± 2.7 |
| 4 | Collagen alpha-2(I) chain | 8.1 ± 11.7 | 4 | Collagen alpha-1(VIII) chain | 2.7 ± 1.1 |
| 5 | Collagen alpha-1(VIII) chain | 2.6 ± 0.9 | 5 | Clusterin | 2.6 ± 0.6 |
| 6 | Collagen alpha-4(IV) chain | 2.5 ± 2.1 | 6 | Ig kappa chain C region | 1.5 ± 0.4 |
| 7 | Collagen alpha-1(II) chain | 1.9 ± 1.6 | 7 | Fibulin-5 | 1.5 ± 0.2 |
| 8 | Keratin, type II cytoskeletal 1 | 1.8 ± 0.8 | 8 | Prolactin-inducible protein | 1.4 ± 1.7 |
| 9 | Clusterin | 1.7 ± 0.6 | 9 | Apolipoprotein D | 1.3 ± 0.2 |
| 10 | Hemoglobin subunit beta | 1.7 ± 1.5 | 10 | Serine protease HTRA1 | 1.3 ± 0.6 |
| 11 | Fibrillin-1 | 1.6 ± 0.9 | 11 | Collagen alpha-2(I) chain | 1.3 ± 0.7 |
| 12 | Collagen alpha-5(IV) chain | 1.5 ± 0.6 | 12 | Collagen alpha-5(IV) chain | 1.2 ± 0.2 |
| 13 | Metalloproteinase inhibitor 3 | 1.5 ± 2.1 | 13 | Sushi repeat-containing protein SRPX2 | 1.2 ± 0.8 |
| 14 | Fibulin-5 | 1.3 ± 0.7 | 14 | Metalloproteinase inhibitor 3 | 1.2 ± 1.0 |
| 15 | Keratin, type I cytoskeletal 9 | 1.3 ± 0.8 | 15 | Collagen alpha-4(IV) chain | 1.1 ± 0.3 |
| 16 | Sushi repeat-containing protein SRPX2 | 1.2 ± 1.0 | 16 | Keratocan | 1.0 ± 0.6 |
| 17 | Thrombospondin-1 | 1.2 ± 0.1 | 17 | C-type lectin domain family 11 member A | 0.9 ± 0.1 |
| 18 | Serine protease HTRA1 | 1.1 ± 0.5 | 18 | Laminin subunit beta-1 | 0.9 ± 0.1 |
| 19 | Apolipoprotein E | 1.0 ± 1.0 | 19 | Thrombospondin-1 | 0.8 ± 0.4 |
| 20 | Laminin subunit beta-1 | 1.0 ± 0.6 | 20 | Keratin, type II cytoskeletal 2 epidermal | 0.8 ± 0.2 |
| 21 | Prolactin-inducible protein | 1.0 ± 1.2 | 21 | Collagen alpha-1(XII) chain | 0.7 ± 0.3 |
| 22 | Apolipoprotein D | 1.0 ± 0.2 | 22 | Collagen alpha-2(IV) chain | 0.7 ± 0.4 |
| 23 | Biglycan | 0.9 ± 1.0 | 23 | Keratin, type II cytoskeletal 1 | 0.6 ± 0.3 |
| 24 | Collagen alpha-1(XII) chain | 0.9 ± 0.5 | 24 | Apolipoprotein E | 0.6 ± 0.3 |
| 25 | Keratin, type II cytoskeletal 2 epidermal | 0.9 ± 0.5 | 25 | Basement membrane-specific heparan sulfate proteoglycan core protein | 0.6 ± 0.2 |
| 26 | C-type lectin domain family 11 member A | 0.8 ± 0.3 | 26 | Collagen alpha-6(IV) chain | 0.6 ± 0.2 |
| 27 | Collagen alpha-2(V) chain | 0.8 ± 0.8 | 27 | Thrombospondin-4 | 0.6 ± 0.2 |
| 28 | Thrombospondin-4 | 0.8 ± 0.5 | 28 | Fibrillin-1 | 0.6 ± 0.2 |
| 29 | Collagen alpha-1(IV) chain | 0.7 ± 0.1 | 29 | Serum albumin | 0.6 ± 0.2 |
| 30 | Collagen alpha-2(IV) chain | 0.7 ± 0.2 | 30 | Prostaglandin-H2 d-isomerase | 0.6 ± 0.1 |
| 31 | Keratin, type I cytoskeletal 10 | 0.7 ± 0.5 | 31 | Collagen alpha-1(IV) chain | 0.6 ± 0.3 |
| 32 | Myocilin | 0.7 ± 0.8 | 32 | Serum amyloid P-component | 0.6 ± 0.2 |
| 33 | Collagen alpha-6(IV) chain | 0.7 ± 0.3 | 33 | Keratin, type I cytoskeletal 9 | 0.5 ± 0.2 |
| 34 | Collagen alpha-1(III) chain | 0.7 ± 0.2 | 34 | Collagen alpha-1(II) chain | 0.4 ± 0.2 |
| 35 | Basement membrane-specific heparan sulfate proteoglycan core protein | 0.6 ± 0.2 | 35 | Myocilin | 0.4 ± 0.2 |
| 36 | Prostaglandin-H2 d-isomerase | 0.6 ± 0.4 | 36 | EGF-containing fibulin-like extracellular matrix protein 1 | 0.3 ± 0.2 |
| 37 | Serum amyloid P-component | 0.5 ± 0.2 | 37 | Histone H4 | 0.3 ± 0.1 |
| 38 | Keratocan | 0.4 ± 0.2 | 38 | Fibronectin | 0.3 ± 0.1 |
| 39 | Periostin | 0.3 ± 0.3 | 39 | Laminin subunit alpha-5 | 0.3 ± 0.04 |
| 40 | Laminin subunit alpha-5 | 0.3 ± 0.1 | 40 | Keratin, type I cytoskeletal 10 | 0.3 ± 0.1 |
| 41 | Lysyl oxidase homologue 4 | 0.3 ± 0.1 | 41 | Collagen alpha-2(V) chain | 0.3 ± 0.1 |
| 42 | EGF-containing fibulin-like extracellular matrix protein 1 | 0.3 ± 0.1 | 42 | Agrin | 0.2 ± 0.1 |
| 43 | Collagen alpha-3(VI) chain | 0.3 ± 0.1 | 43 | Alpha-1-antitrypsin | 0.2 ± 0.1 |
| 44 | EMILIN-1 | 0.3 ± 0.1 | 44 | Collagen alpha-3(VI) chain | 0.2 ± 0.1 |
| 45 | Nidogen-1 | 0.2 ± 0.03 | 45 | EMILIN-1 | 0.2 ± 0.1 |
| 46 | Laminin subunit gamma-1 | 0.2 ± 0.02 | 46 | Laminin subunit gamma-1 | 0.2 ± 0.1 |
| 47 | Alpha-1-antitrypsin | 0.2 ± 0.03 | 47 | Nidogen-1 | 0.2 ± 0.1 |
| 48 | Agrin | 0.2 ± 0.03 | 48 | Keratin, type I cytoskeletal 12 | 0.2 ± 0.1 |
| 49 | Collagen alpha-1(III) chain | 0.2 ± 0.2 | |||
| 50 | Cadherin-1 | 0.2 ± 0.1 | |||
| 51 | Olfactomedin-like protein 1 | 0.1 ± 0.04 |
The relative abundance of the proteins was calculated as the average MS intensity (area) for the three most intense peptides from each protein divided by the total sum of the average signal (area) for all quantified proteins. Average ratios and standard deviations were calculated based on the biological replicates, and only proteins quantified in a minimum of half of the biological replicates are reported.
Furthermore, 10 of the quantified proteins were significantly regulated (p < 0.05): agrin, apoliprotein D, and keratocan were up-regulated, and the collagen alpha-1(II) chain, collagen alpha-1 (III) chain, collagen alpha-4(IV) chain, and fibrillin-1 were down-regulated in FECD tissue. In addition, although cytokeratin data must be interpreted with caution, the keratins type II cytoskeletal 1, keratin type I cytoskeletal 9 and 10 were significantly down-regulated in FECD tissue. Identification of endogenous cytokeratins by the area-based XIC analysis, such as cytokeratins 1, 9, and 10 (Table 1) and cytokeratin 10 found to be regulated in the iTRAQ analysis (Table 2), are often difficult to differentiate from exogenous contaminating keratins in MS analyses. According to our previous study of the human cornea, cytokeratin 1 is most likely a confident endogenous cytokeratin, whereas it is uncertain whether cytokeratins 9 and 10 are endogenous.22
Table 2. Protein Regulations in FECD Tissuea.
| accession no. | nameb | GOc | p-value | method | |
|---|---|---|---|---|---|
| Up-regulated Proteins | |||||
| 1 | O00468 | Agrin | E | 0.047, 0.001 | XIC, iTRAQ |
| 2 | P05090 | Apolipoprotein D | E | 0.045, 0.001 | XIC, iTRAQ |
| 3 | Q9Y240 | C-type lectin domain family 11 member A | E/I | 0.001 | iTRAQ |
| 4 | Q9NQ79 | Cartilage acidic protein 1 | E | 0.001 | iTRAQ |
| 5 | P10909 | Clusterin | E/I | 0.000 | iTRAQ |
| 6 | P12111 | Collagen alpha-3(VI) chain | E | 0.001 | iTRAQ |
| 7 | P01024 | Complement C3 | E | 0.016 | iTRAQ |
| 8 | P07585 | Decorin | E | 0.027 | iTRAQ |
| 9 | O95967 | EGF-containing fibulin-like extracellular matrix protein 2 | E | 0.044 | iTRAQ |
| 10 | Q9Y6C2 | EMILIN-1 | E | 0.022 | iTRAQ |
| 11 | P01876 | Ig alpha-1 chain C region | E | 0.010 | iTRAQ |
| 12 | O60938 | Keratocan | E | 0.027, 0.048 | XIC, iTRAQ |
| 13 | O15232 | Matrilin-3 | E | 0.011 | iTRAQ |
| 14 | Q15582 | Transforming growth factor-beta-induced protein ig-h3 | E | 0.015 | iTRAQ |
| Down-regulated Proteins | |||||
| 1 | P02452 | Collagen alpha-1(I) chain | E | 0.003 | iTRAQ |
| 2 | P08123 | Collagen alpha-2(I) chain | E | 0.039 | iTRAQ |
| 3 | P02458 | Collagen alpha-1(II) chain | E | 0.009 | XIC |
| 4 | P02461 | Collagen alpha-1(III) chain | E | 0.02, 0.003 | XIC, iTRAQ |
| 5 | P53420 | Collagen alpha-4(IV) chain | E | 0.035 | XIC |
| 6 | P05997 | Collagen alpha-2(V) chain | E | 0.032 | iTRAQ |
| 7 | P35555 | Fibrillin-1 | E | 0.005, 0.021 | XIC, iTRAQ |
| 8 | P04264 | Keratin, type II cytoskeletal 1 | I | 0.006 | XIC |
| 9 | P35527 | Keratin, type I cytoskeletal 9 | I | 0.024 | XIC |
| 10 | P13645 | Keratin, type I cytoskeletal 10 | I | 0.031, 0.002 | XIC, iTRAQ |
| 11 | P14555 | Phospholipase A2, membrane associated | I | 0.004 | iTRAQ |
| 12 | P24821 | Tenascin | E | 0.047 | iTRAQ |
Proteins regulated with a p-value below 0.05 and quantified based on a minimum of 3 unique peptides.
Proteins in bold are within the most abundant proteins listed in Table 1.
Gene Ontology terms (GO) indicate whether the proteins are extracellularly (E) or intracellularly (I).
Protein Regulations
The level of protein regulation was subsequently interrogated further by the sensitive and complementary iTRAQ approach (Figure 1). Using this method, we identified 421 proteins of which 14 were up-regulated and 8 were down-regulated (Table 2 and Supplementary 2). Noteworthy, 13 of the regulated proteins in the iTRAQ analysis were among the most abundant proteins in the Descemet’s membrane/endothelial layer in the area-based XIC analysis, showing similar trends in regulation as in the iTRAQ analysis (Table 2, marked in bold). In total, the area-based XIC and iTRAQ analyses resulted in 26 significant protein regulations (p < 0.05) in FECD tissue of which 6 proteins were regulated in both analyses with similar trends. A subsequent MS Data Miner Gene Ontology (GO) term analysis of the 26 regulated proteins revealed that 22 of the proteins were associated with the extracellular matrix (ECM) and 6 were located intracellularly (2 proteins were found in both locations). Thus, both the area-based XIC and the iTRAQ-based analyses strongly support that the ECM is compromised in late-onset FECD.
Discussion
Several genes have been associated with FECD; however, the molecular pathology leading to this disease remains unclear. FECD is characterized by pronounced morphological changes of the ECM including thickening of Descemet’s membrane as well as guttae formation. Furthermore, mutations in the collagen-alpha-2 (VIII) encoding gene (COL8A2) are implicated in the early onset variant of FECD, altogether suggesting that the ECM homeostasis of Descemet’s membrane is being compromised. To investigate these pronounced morphological changes at the protein level, we performed two quantitative MS-based analyses using an area-based XIC quantification method primarily to obtain the amount of the most abundant proteins in the Descemet’s membrane/endothelial layer of healthy and diseased tissue, followed by an iTRAQ-based method to gain information about the relative protein regulations between FECD and control samples (Figure 1).
Level of Type VIII Collagen Remains Unchanged in the Common Late-Onset Form of FECD
The Descemet’s membrane is morphologically characterized by an anterior banded layer (ABL) lining the corneal stroma followed by a posterior nonbanded layer (PNBL) lining the endothelium.27 In late-onset FECD, a posterior banded layer (PBL) between the PNBL and the endothelium appears. This results in thickening of Descemet’s membrane and has been suggested to arise from increased type VIII collagen synthesis by the endothelium.18,19 The area-based XIC quantification of the Descemet’s membrane/endothelial layer revealed that collagen accounted for approximately 40% in the control tissue and approximately 30% in FECD tissue of the total protein content (Table 1). Type VIII collagen, the major collagen type present in the Descemet’s membrane/endothelial layer, constituted approximately 12% and 13% (both alpha chains) in controls and FECD, respectively. The abundance of type VIII collagen emphasizes that a mutation in this protein is likely to influence the integrity of the Descemet’s membrane as seen for early-onset FECD.27 However, contrary to previous assumptions our data do not support an increased level of type VIII collagen as the area-based XIC quantitative data showed close to equal relative amounts in the FECD and control tissues. This was supported by the iTRAQ data in which no significant difference in type VIII collagen levels were observed between FECD and control samples (Table 2). Thus, our data suggest that factors other than the type VIII collagen amount are responsible for the morphological changes observed in FECD.
TGFBIp Accumulates in FECD
The formation of projections of Descemet’s membrane is not unique for FECD as guttae-like projections also are observed with aging and in other diseases of the endothelium. Contrary to guttae formation in FECD that is normally located in the central cornea, age-related guttae-like projections are a phenomenon often associated with the peripheral cornea and do not interfere with endothelial function causing corneal cloudiness.1 Accumulation of transforming growth factor beta-induced protein (TGFBIp) and clusterin has previously been associated with FECD guttae.20 The area-based XIC data showed a trend toward higher TGFBIp levels in FECD patients when compared to controls (Table 1), and both TGFBIp and clusterin were significantly up-regulated according to the iTRAQ data (Table 2). Mutations in TGFBIp are the leading cause of granular and lattice corneal dystrophies,1 affecting the corneal stroma by pronounced protein accumulations. However, to date no genetic link has been made between TGFBIp and FECD. Nevertheless, co-localization of the multifunctional protein clusterin, which is known for its chaperone property,28 may indicate that a TGFBIp-related misfolding event occurs in guttae and that these microstructures serve as an “extracellular protein junkyard” in times of ECM stress.
Compromised Organization of the Laminin/Type IV Collagen Network in FECD
Of the 26 significantly regulated proteins (Table 2), 17 are within the most abundant proteins quantified by the area-based XIC analysis, of which 14 are ECM proteins (Table 1). The regulation of many abundant ECM proteins strongly suggests that FECD influences ECM homeostasis. Among the significantly regulated proteins (Table 2) is a group of proteins that is of particular interest, since they all are related to basement membrane assembly and/or ECM organization. The group includes agrin, a heparan sulfate proteoglycan found in the basal lamina that is up-regulated in our study. It mediates binding of the laminin network to the type IV collagen network in the basement membrane.29 During the area-based XIC analysis we quantified the laminin subunits beta-1, alpha-5, and gamma-1 and the collagen type IV alpha-1, -2, -3, -4, -5, and -6 chains of which the alpha-4 (IV) chain was significantly down-regulated in the FECD group. In addition, we also found collagen alpha-3 (VI) to be up-regulated in FECD tissue (Table 2). Type VI collagen is found in many tissues and is believed to be important for anchoring the type IV collagen network to epithelial cells.30,31 Consequently, the regulation of agrin and type VI collagen may influence the organization of the laminin network/type IV collagen networks in Descemet’s membrane.
Proteins Associated with ECM Collagen Organization Are Regulated in FECD
Matrilin-3 was likewise up-regulated in FECD tissue. Members of the matrilin family are involved in formation of fibrillar structures and mediate the interaction between collagen fibrils and other ECM components.32 In cartilage, matrilins modulate collagen fibrillogenesis, which in turn affects the ECM cartilage ultrastructure.33 Furthermore, several mutations in matrilin-3 affect ECM assembly, thereby compromising ECM ultrastructure.34 Hence, regulation of matrilin-3 may disturb collagen fibrillogenesis in Descement’s membrane leading to a change in ECM arrangement. Decorin, a small leucine-rich proteoglycan found to be up-regulated in our data, mediates contact between matrillin-3 and type VI collagen microfibrils in cartilage.35 Moreover, decorin has been shown to interacts with type XII collagen,36 which we also quantified as one of the most abundant proteins in Descemet’s membrane (Table 1). Type I collagen, which is down-regulated in the iTRAQ analysis, likewise interact with type XII collagen. In addition, we have previously shown that a significant fraction of corneal TGFBIp is covalently associated with type XII collagen.37 Thus, both decorin, type I collagen, and TGFBIp may cause structural changes of the collagen scaffold in the FECD Descemet’s membrane by interacting with type XII collagen. Two other small leucine-rich proteoglycans were identified in this study, keratocan and biglycan, of which keratocan was up-regulated, and both proteins are among the most abundant proteins in Descemet’s membrane according to our area-based XIC quantification (biglycan was only quantified in the control group). As for decorin, both keratocan and biglycan are important for proper ECM arrangement.38 This is evident in that keratocan knockout mice display an altered ultrastructure of the corneal stroma compared to WT mice.39
Of the proteins found to be down-regulated in the iTRAQ analysis, fibrillin-1 and collagen alpha 1 and 2(I) have been suggested to affect central corneal thickness,40 and it is likely that they are implicated in ECM modulation of Descemet’s membrane in FECD.
Conclusion
In the present study, we compared the protein profiles of the Descemet’s membrane/endothelial layer from FECD patients and non-FECD individuals. Of the identified 26 significantly regulated proteins 17 were among the most abundant proteins of the Descemet’s membrane/endothelial layer. Levels of type VIII collagen were unaltered, whereas proteins involved in ECM organization and cell anchoring were affected. We did not identify the presumed intracellular suspects including TCF-4, TCF-8, and SLC4A11 or certain gene products suggested to be associated with late-onset FECD.11−13 This does not rule out the hypothesis that these proteins may play a role during the pathological progression of FECD as the dynamic range of the protein expression in Descemet’s membrane is likely to prevent the identification of low-abundance proteins by MS analysis. Taken together, since the regulated proteins are associated with ECM organization and cell adhesion, our data support that ECM homeostasis is compromised and that organization of the ECM collagen fibrils is affected in FECD.
The mass spectrometry proteomics data have been deposited to the ProteomeXchange Consortium (http://proteomecentral.proteomexchange.org) via the PRIDE partner repository41 with the data set identifier PXD000746.
Acknowledgments
This study was supported by the Danish Agency for Science, Technology and Innovation, Fight for Sight, Denmark, and the National Eye Institute (R01 EY012712). Lastly, we would like to thank the PRIDE team for assistance in data management in the ProteomeXchange Consortium.
Glossary
Abbreviations
- ECM
extracellular matrix
- FECD
Fuchs’ endothelial corneal dystrophy
- GO
gene ontology
- iTRAQ
isobaric tag for relative and absolute quantification
- SCX
strong cation exchange chromatography
- TGFBIp
transforming growth factor beta induced protein
- XIC
extracted ion chromatogram
Supporting Information Available
Extended list of proteins quantified using area-based XIC quantitation, extended list of proteins quantified using iTRAQ, and Mascot search information on the area-based XIC data. This material is available free of charge via the Internet at http://pubs.acs.org.
The authors declare no competing financial interest.
Funding Statement
National Institutes of Health, United States
Supplementary Material
References
- Klintworth G. K. Corneal dystrophies. Orphanet J. Rare Dis. 2009, 4, 7. [DOI] [PMC free article] [PubMed] [Google Scholar]
- Musch D. C.; Niziol L. M.; Stein J. D.; Kamyar R. M.; Sugar A. Prevalence of corneal dystrophies in the United States: estimates from claims data. Invest. Ophthalmol. Visual Sci. 2011, 52, 6959–6963. [DOI] [PMC free article] [PubMed] [Google Scholar]
- Yuen H. K. L.; Rassier C. E.; Jardeleza M. S. R.; Green W. R.; de la Cruz Z.; Stark W. J.; Gottsch J. D. A morphologic study of Fuchs dystrophy and bullous keratopathy. Cornea 2005, 24, 319–327. [DOI] [PubMed] [Google Scholar]
- Biswas S.; Munier F. L.; Yardley J.; Hart-Holden N.; Perveen R.; Cousin P.; Sutphin J. E.; Noble B.; Batterbury M.; Kielty C.; et al. Missense mutations in COL8A2, the gene encoding the alpha2 chain of type VIII collagen, cause two forms of corneal endothelial dystrophy. Hum. Mol. Genet. 2001, 10, 2415–2423. [DOI] [PubMed] [Google Scholar]
- Gottsch J. D.; Sundin O. H.; Liu S. H.; Jun A. S.; Broman K. W.; Stark W. J.; Vito E. C. L.; Narang A. K.; Thompson J. M.; Magovern M. Inheritance of a novel COL8A2 mutation defines a distinct early-onset subtype of fuchs corneal dystrophy. Invest. Ophthalmol. Visual Sci. 2005, 46, 1934–1939. [DOI] [PubMed] [Google Scholar]
- Krachmer J. H.; Purcell J. J.; Young C. W.; Bucher K. D. Corneal endothelial dystrophy. A study of 64 families. Arch. Ophthalmol. 1978, 96, 2036–2039. [DOI] [PubMed] [Google Scholar]
- Riazuddin S. A.; Zaghloul N. A.; Al-Saif A.; Davey L.; Diplas B. H.; Meadows D. N.; Eghrari A. O.; Minear M. A.; Li Y.-J.; Klintworth G. K.; et al. Missense mutations in TCF8 cause late-onset Fuchs corneal dystrophy and interact with FCD4 on chromosome 9p. Am. J. Hum. Genet. 2010, 86, 45–53. [DOI] [PMC free article] [PubMed] [Google Scholar]
- Sundin O. H.; Jun A. S.; Broman K. W.; Liu S. H.; Sheehan S. E.; Vito E. C. L.; Stark W. J.; Gottsch J. D. Linkage of late-onset Fuchs corneal dystrophy to a novel locus at 13pTel-13q12.13. Invest. Ophthalmol. Visual Sci. 2006, 47, 140–145. [DOI] [PubMed] [Google Scholar]
- Sundin O. H.; Broman K. W.; Chang H. H.; Vito E. C. L.; Stark W. J.; Gottsch J. D. A common locus for late-onset Fuchs corneal dystrophy maps to 18q21.2-q21.32. Invest. Ophthalmol. Visual Sci. 2006, 47, 3919–3926. [DOI] [PubMed] [Google Scholar]
- Riazuddin S. A.; Eghrari A. O.; Al-Saif A.; Davey L.; Meadows D. N.; Katsanis N.; Gottsch J. D. Linkage of a mild late-onset phenotype of Fuchs corneal dystrophy to a novel locus at 5q33.1-q35.2. Invest. Ophthalmol. Visual Sci. 2009, 50, 5667–5671. [DOI] [PubMed] [Google Scholar]
- Baratz K. H.; Tosakulwong N.; Ryu E.; Brown W. L.; Branham K.; Chen W.; Tran K. D.; Schmid-Kubista K. E.; Heckenlively J. R.; Swaroop A.; et al. E2-2 protein and Fuchs’s corneal dystrophy. N. Engl. J. Med. 2010, 363, 1016–1024. [DOI] [PubMed] [Google Scholar]
- Igo R. P.; Kopplin L. J.; Joseph P.; Truitt B.; Fondran J.; Bardenstein D.; Aldave A. J.; Croasdale C. R.; Price M. O.; Rosenwasser M.; et al. Differing roles for TCF4 and COL8A2 in central corneal thickness and Fuchs endothelial corneal dystrophy. PLoS One 2012, 7, e46742. [DOI] [PMC free article] [PubMed] [Google Scholar]
- Vithana E. N.; Morgan P. E.; Ramprasad V.; Tan D. T. H.; Yong V. H. K.; Venkataraman D.; Venkatraman A.; Yam G. H. F.; Nagasamy S.; Law R. W. K.; et al. SLC4A11 mutations in Fuchs endothelial corneal dystrophy. Hum. Mol. Genet. 2008, 17, 656–666. [DOI] [PubMed] [Google Scholar]
- Jurkunas U. V.; Rawe I.; Bitar M. S.; Zhu C.; Harris D. L.; Colby K.; Joyce N. C. Decreased expression of peroxiredoxins in Fuchs’ endothelial dystrophy. Invest. Ophthalmol. Visual Sci. 2008, 49, 2956–2963. [DOI] [PMC free article] [PubMed] [Google Scholar]
- Jurkunas U. V.; Bitar M. S.; Funaki T.; Azizi B. Evidence of oxidative stress in the pathogenesis of fuchs endothelial corneal dystrophy. Am. J. Pathol. 2010, 177, 2278–2289. [DOI] [PMC free article] [PubMed] [Google Scholar]
- Kaji Y.; Amano S.; Usui T.; Oshika T.; Yamashiro K.; Ishida S.; Suzuki K.; Tanaka S.; Adamis A. P.; Nagai R.; et al. Expression and function of receptors for advanced glycation end products in bovine corneal endothelial cells. Invest. Ophthalmol. Visual Sci. 2003, 44, 521–528. [DOI] [PubMed] [Google Scholar]
- Wang Z.; Handa J. T.; Green W. R.; Stark W. J.; Weinberg R. S.; Jun A. S. Advanced glycation end products and receptors in Fuchs’ dystrophy corneas undergoing Descemet’s stripping with endothelial keratoplasty. Ophthalmology 2007, 114, 1453–1460. [DOI] [PubMed] [Google Scholar]
- Levy S. G.; Moss J.; Sawada H.; Dopping-Hepenstal P. J.; McCartney A. C. The composition of wide-spaced collagen in normal and diseased Descemet’s membrane. Curr. Eye Res. 1996, 15, 45–52. [DOI] [PubMed] [Google Scholar]
- Elhalis H.; Azizi B.; Jurkunas U. V. Fuchs endothelial corneal dystrophy. Ocul. Surf. 2010, 8, 173–184. [DOI] [PMC free article] [PubMed] [Google Scholar]
- Jurkunas U. V.; Bitar M.; Rawe I. Colocalization of increased transforming growth factor-induced protein (TGFBIp) and clusterin in Fuchs endothelial corneal dystrophy. Invest. Ophthalmol. Visual Sci. 2008, 50, 1129–1136. [DOI] [PMC free article] [PubMed] [Google Scholar]
- Kuot A.; Hewitt A. W.; Griggs K.; Klebe S.; Mills R.; Jhanji V.; Craig J. E.; Sharma S.; Burdon K. P. Association of TCF4 and CLU polymorphisms with Fuchs’ endothelial dystrophy and implication of CLU and TGFBI proteins in the disease process. Eur. J. Hum. Genet. 2012, 20, 632–638. [DOI] [PMC free article] [PubMed] [Google Scholar]
- Dyrlund T. F.; Poulsen E. T.; Scavenius C.; Nikolajsen C. L.; Thøgersen I. B.; Vorum H.; Enghild J. J. Human cornea proteome: identification and quantitation of the proteins of the three main layers including epithelium, stroma, and endothelium. J. Proteome Res. 2012, 11, 4231–4239. [DOI] [PMC free article] [PubMed] [Google Scholar]
- MacLean B.; Tomazela D. M.; Shulman N.; Chambers M.; Finney G. L.; Frewen B.; Kern R.; Tabb D. L.; Liebler D. C.; MacCoss M. J. Skyline: an open source document editor for creating and analyzing targeted proteomics experiments. Bioinformatics 2010, 26, 966–968. [DOI] [PMC free article] [PubMed] [Google Scholar]
- Perkins D. N.; Pappin D. J.; Creasy D. M.; Cottrell J. S. Probability-based protein identification by searching sequence databases using mass spectrometry data. Electrophoresis 1999, 20, 3551–3567. [DOI] [PubMed] [Google Scholar]
- Silva J. C.; Gorenstein M. V.; Li G.-Z.; Vissers J. P. C.; Geromanos S. J. Absolute quantification of proteins by LCMSE: a virtue of parallel MS acquisition. Mol. Cell Proteomics 2006, 5, 144–156. [DOI] [PubMed] [Google Scholar]
- Dyrlund T. F.; Poulsen E. T.; Scavenius C.; Sanggaard K. W.; Enghild J. J. MS Data Miner: a web-based software tool to analyze, compare, and share mass spectrometry protein identifications. Proteomics 2012, 12, 2792–2796. [DOI] [PubMed] [Google Scholar]
- Gottsch J. D.; Zhang C.; Sundin O. H.; Bell W. R.; Stark W. J.; Green W. R. Fuchs corneal dystrophy: aberrant collagen distribution in an L450W mutant of the COL8A2 gene. Invest. Ophthalmol. Visual Sci. 2005, 46, 4504–4511. [DOI] [PubMed] [Google Scholar]
- Wyatt A.; Yerbury J.; Poon S.; Dabbs R.; Wilson M. Chapter 6: The chaperone action of Clusterin and its putative role in quality control of extracellular protein folding. Adv. Cancer Res. 2009, 104, 89–114. [DOI] [PubMed] [Google Scholar]
- Hohenester E.; Yurchenco P. D. Laminins in basement membrane assembly. Cell Adhes. Migr. 2013, 7, 56–63. [DOI] [PMC free article] [PubMed] [Google Scholar]
- Kuo H. J.; Maslen C. L.; Keene D. R.; Glanville R. W. Type VI collagen anchors endothelial basement membranes by interacting with type IV collagen. J. Biol. Chem. 1997, 272, 26522–26529. [DOI] [PubMed] [Google Scholar]
- Groulx J.-F.; Gagné D.; Benoit Y. D.; Martel D.; Basora N.; Beaulieu J.-F. Collagen VI is a basement membrane component that regulates epithelial cell-fibronectin interactions. Matrix Biol. 2011, 30, 195–206. [DOI] [PubMed] [Google Scholar]
- Klatt A. R.; Becker A.-K. A.; Neacsu C. D.; Paulsson M.; Wagener R. The matrilins: modulators of extracellular matrix assembly. Int. J. Biochem. Cell Biol. 2011, 43, 320–330. [DOI] [PubMed] [Google Scholar]
- Nicolae C.; Ko Y.-P.; Miosge N.; Niehoff A.; Studer D.; Enggist L.; Hunziker E. B.; Paulsson M.; Wagener R.; Aszodi A. Abnormal collagen fibrils in cartilage of matrilin-1/matrilin-3-deficient mice. J. Biol. Chem. 2007, 282, 22163–22175. [DOI] [PubMed] [Google Scholar]
- Otten C.; Hansen U.; Talke A.; Wagener R.; Paulsson M.; Zaucke F. A matrilin-3 mutation associated with osteoarthritis does not affect collagen affinity but promotes the formation of wider cartilage collagen fibrils. Hum. Mutat. 2010, 31, 254–263. [DOI] [PubMed] [Google Scholar]
- Bidanset D. J.; Guidry C.; Rosenberg L. C.; Choi H. U.; Timpl R.; Hook M. Binding of the proteoglycan decorin to collagen type VI. J. Biol. Chem. 1992, 267, 5250–5256. [PubMed] [Google Scholar]
- Font B.; Eichenberger D.; Rosenberg L. M.; van der Rest M. Characterization of the interactions of type XII collagen with two small proteoglycans from fetal bovine tendon, decorin and fibromodulin. Matrix Biol. 1996, 15, 341–348. [DOI] [PubMed] [Google Scholar]
- Runager K.; Klintworth G. K.; Karring H.; Enghild J. J. The insoluble TGFBIp fraction of the cornea is covalently linked via a disulfide bond to type XII collagen. Biochemistry 2013, 52, 2821–2827. [DOI] [PMC free article] [PubMed] [Google Scholar]
- Chen S.; Birk D. E. The regulatory roles of small leucine-rich proteoglycans in extracellular matrix assembly. FEBS J. 2013, 280, 2120–2137. [DOI] [PMC free article] [PubMed] [Google Scholar]
- Liu C.-Y.; Birk D. E.; Hassell J. R.; Kane B.; Kao W. W.-Y. Keratocan-deficient mice display alterations in corneal structure. J. Biol. Chem. 2003, 278, 21672–21677. [DOI] [PubMed] [Google Scholar]
- Dimasi D. P.; Burdon K. P.; Hewitt A. W.; Savarirayan R.; Healey P. R.; Mitchell P.; Mackey D. A.; Craig J. E. Candidate gene study to investigate the genetic determinants of normal variation in central corneal thickness. Mol. Vis. 2010, 16, 562–569. [PMC free article] [PubMed] [Google Scholar]
- Vizcaíno J. A.; Côté R. G.; Csordas A.; Dianes J. A.; Fabregat A.; Foster J. M.; Griss J.; Alpi E.; Birim M.; Contell J.; et al. The PRoteomics IDEntifications (PRIDE) database and associated tools: status in 2013. Nucleic Acids Res. 2013, 41, D1063–D1069. [DOI] [PMC free article] [PubMed] [Google Scholar]
Associated Data
This section collects any data citations, data availability statements, or supplementary materials included in this article.