Abstract
Background
Diabetic foot ulceration has a complex and multi-factorial etiology and can involve changes in the pathophysiology of the plantar soft tissue. In the current study, histomorphological analyses of diabetic and non-diabetic plantar tissue were performed. It was hypothesized that the diabetic tissue would have thicker skin (epidermis and dermis), less interdigitation between the dermis and epidermis, thicker elastic septa and decreased adipose cell size.
Materials and Methods
Two locations of the foot (the heel and the first metatarsal) were examined, both of which have been reported to be locations with a high incidence of ulceration. Stereological methods and quantitative morphological techniques were used to evaluate the skin thickness, interdigitation index, elastic septae thickness and adipocyte cell size.
Results
The diabetic donors had a greater body mass index (BMI) than the non-diabetic donors. The diabetic tissue had significantly thicker elastic septae and dermis. However, no significant difference was observed in the interdigitation index or adipocyte size.
Conclusion
These findings demonstrate that morphological changes can be evaluated histologically to give a better understanding of the pathological changes in the plantar soft tissue with diabetes. These evaluations can then be associated with biomechanical changes that occur in diabetes to provide new insight into how microstructural changes can alter macroscopic properties.
Clinical Relevance
An understanding of the histomorphological changes in the soft tissue in relationship to the location on the foot could help to explain the biomechanical changes that occur in diabetes and the subsequent increase in susceptibility to breakdown.
Keywords: Plantar Soft Tissue, Diabetes, Skin, Elastic Septae, Adipocyte
INTRODUCTION
The plantar soft tissue is subjected to repeated shear and compressive stresses, particularly in the regions of the heel, metatarsal heads and hallux.20,30,44 The complex anatomic configuration of this tissue enables such forces to be endured. However, the plantar soft tissue of people with systemic pathologies, such as diabetes and peripheral neuropathy, has histomorphological8 and mechanical35 changes, and is often unable to adapt to and withstand these loading regimes in the same manner as non-diabetic tissue, which can result in breakdown (i.e., ulceration). As a result, they have a general tendency to have a lower threshold for injury.
Diabetes is a major health care problem that often results in significant impairment of the feet; diabetic foot problems account for more hospital inpatient days than any other diabetic issue.37,42 Approximately 15% of diabetic individuals will develop a foot ulcer during their lifetime.2 The expenses associated with treating these diabetic complications have been reported to account for approximately 25% of the hospital costs of diabetes care.1
Foot ulceration in diabetes results from a combination of effects5 including, but not limited to changes in the pathophysiology. It has been suggested that persistent hyperglycemia and the accelerated accumulation of advanced glycation end-products (AGEs) are major causes of the detrimental changes in the pathophysiology of the diabetic foot which includes alterations to the soft and hard tissue, nerve function, vascular structure, immunology, wound healing and plantar pressure.4,9,36
There have been several mechanical testing21,22,28,45 and magnetic resonance imaging (MRI)6,10,26 studies that have examined the changes in the characteristics of the plantar soft tissue due to diabetes. However, there have been limited histomorphometric studies on impaired plantar soft tissue.8,24,41 Of these, most have focused on the heel or a non-specified location, despite the variations in the incidence of ulceration in different locations of the foot.12,23 Earlier studies reported thicker, fragmented septal walls and a decrease in adipocyte area and diameter;8,24 however, all diabetic tissue from these studies came from limbs that were amputated due to vascular compromise. More recently, Waldecker and Lehr41 examined biopsied metatarsal fat pad tissue but found no difference in adipocyte size between diabetic and non-diabetic tissue. Others have found that skin (on the dorsum of the foot and elsewhere) is thicker in people with diabetes.17,19 These observations demonstrate that diabetes can affect the histomorphology of the plantar soft tissue. It is already well accepted that the biomechanical properties of tissue can change with systemic pathologies.35 Pairing an evaluation of both the histolomorphological and biomechanical changes that occur in systemic pathologies such as diabetes could therefore give a more thorough understanding of why diseased tissue is so more susceptible to breakdown and in the establishment of preventative measures. To date, there has not been a systematic study of the histomorphological changes in diabetic plantar soft tissue versus non-diabetic, age-matched tissue in more than one location of the foot.
The purpose of this study was to perform a histomorphological study of diabetic and non-diabetic plantar tissue using a combination of stereological methods and quantitative morphology. It was expected that the diabetic tissue would have thicker elastic septa, decreased adipose cell size and thicker skin (dermis and epidermis). An understanding of the histomorphological changes in the soft tissue in relationship to the location on the foot can be used to understand the biomechanical changes that occur in diabetes and the subsequent increase in susceptibility to breakdown.
MATERIALS AND METHODS
Specimen procurement
Plantar soft tissue samples were taken from fresh cadaveric feet of older diabetic (n = 4; age range, 63 to 79 years; diabetes duration, 9 to 27 years) and older non-diabetic donors (n = 9; age range, 61 to 79 years; Table 1). The diabetic donors also had a larger BMI (32.9 ± 5.1 versus 22.1 ± 4.2; p = 0.013). All donors were Caucasian. Note that diabetic specimens were not obtained from amputated limbs, but rather from donors without ulcers. Only one of the diabetic donors died from a condition that has been closely linked with diabetes (congestive heart failure). Two locations on the foot (the heel and the first metatarsal) were examined, both of which have been reported to be locations with high incidence of ulceration.12 The specimens (1 cm × 1 cm), containing epidermis, dermis and subcutaneous fat (hypodermis), were obtained from the subcalcaneal and first submetatarsal regions and immediately placed in 10% neutral buffered formalin for fixation. Institutional Review Board approval was obtained for this study from the Human Subjects Division at the University of Washington. All samples were procured and dissected by National Disease Research Interchange (NDRI, Philadelphia, PA).
Table 1.
Donor Information
| Diabetic | Non-diabetic | p value | |
|---|---|---|---|
| n | 4 | 9 | |
| Age (years) | 70.5 ± 6.6 | 72.1 ± 6.4 | 0.7 |
| Sex (male/female) | 2/2 | 4/5 | 1.0 |
| Weight (kg) | 94.0 ± 25.3 | 64.7 ± 15.4 | 0.098 |
| BMI (kg/m2) | 32.9 ± 5.1 | 22.1 ± 4.2 | 0.013 |
Tissue processing
Vertical uniform random (VUR) sampling of the specimens3 was used to obtain unbiased, isotropic sections when combined with stereological sampling probes. In brief, the axis perpendicular to the cutaneous skin surface was selected as the vertical direction. The specimen was rotated randomly and cut exhaustively at a thickness of approximately 1 mm. Each tissue slab was embedded in paraffin and six serial tissue sections were taken from each block. Alternate sections were stained with hematoxylin and eosin (H&E), picro sirius red for collagen and modified Hart’s for elastin, according to standard protocols.
Image analysis
Analysis was performed on the histological sections observed using a Nikon microscope (Eclipse 80i, Melville, NY) and digitized with a 12.6 Megapixel digital camera (DXM-1200C, Nikon, Melville, NY). Images were taken using 2x, 4x, and 10x magnification lenses and imported to ImageJ 1.42 (National Institutes of Health, Bethesda, MD) for analysis. Images were analyzed in a blind fashion. The total observed variation in the data can be partitioned into sampling variance (sampling error) and biological variance.18 Therefore, preliminary analysis was performed to determine the minimum number of images and measurements required so that only a negligible amount of the total variation was due to sampling error.
Elastic Septae Thickness
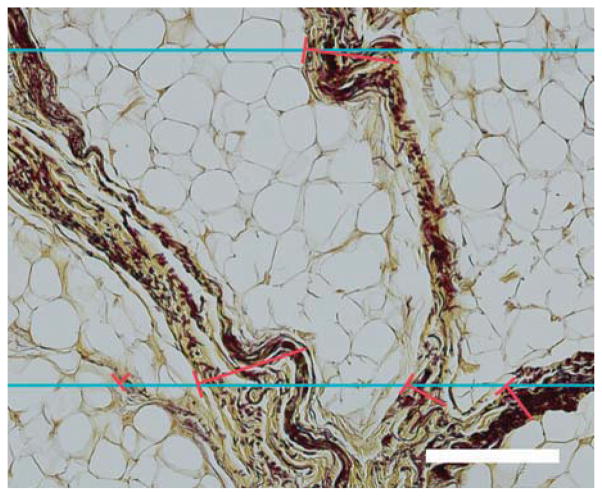
The thickness of the septal walls was measured in sections stained with modified Hart’s and imaged at 4x. This stain results in black elastic fibers with a yellow background (tartrazine counterstain), which gives a good visualization of the septal walls (Figure 1). Due to the variation in sectioning angle, the thickness measured in a random slice can give an over-estimation of the true thickness. This overestimation can be overcome by using a stereological approach.14–16,32 Parallel lines, with an interline distance of 500 μm, were randomly overlaid on randomly rotated 4x images and orthogonal lines to the left aspect of the septal walls were drawn across from the intersections giving measurements of the intercept length (L). From these measurements, the arithmetic thickness (Ta) and harmonic thickness (TH) can be calculated (Equations 1 and 2) as:
| Equation 1 |
| Equation 2 |
Fig. 1.
Orthogonal intercept method for measurement of elastic septa thickness in a section stained with modified Hart’s. Blue lines represent the horizontal lines of the probe; the red lines represent the orthogonal thicknesses starting at the intercept of the probe and left aspect of the septal walls. Scale bar represents 200 μm.
In summary, due to the random orientation of the septae in relation to the slices, their thickness was determined using a combination of orthogonal line interception measurements and arithmetic and harmonic thickness calculations.
Skin thickness
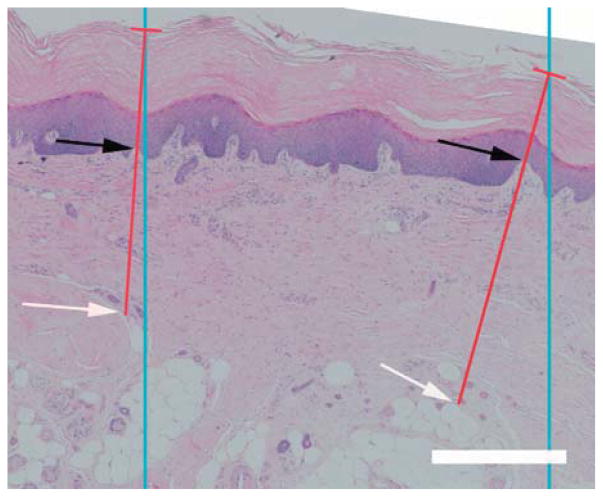
Skin thickness was measured in sections stained with H&E, which gave good visualization of the separation of the dermis and epidermis (Figure 2). Similar to the method used to measure septal wall thickness, parallel lines, with an interline distance of 1500 μm, were randomly overlaid on randomly rotated 2x images and orthogonal lines to the surface of the epidermis were drawn from these intersections to the deepest depths of the reticular dermis (until adipose tissue or muscle was reached). Along this line, the length thicknesses of the dermis and epidermis were measured giving the intercept length for each (Ld, Le). From these measurements, the arithmetic thickness (Ta) and harmonic thickness (TH) were calculated (Equations 1 and 2). Skin thickness was defined as the combined thickness of the dermis and epidermis.
Fig. 2.
Epidermal and dermal thickness measurements. Blue lines represent the lines of the probe; the red lines represent the orthogonal thicknesses of the skin starting at the intercept of the probe and epidermal surface. The epidermal thickness was measured between the epidermal surface to the dermal-epidermal junction (DEJ) (black arrows). The dermal thickness was measured between DEJ and the depths of the reticular dermis (white arrow). Scale bar represents 500 μm.
Interdigitation index
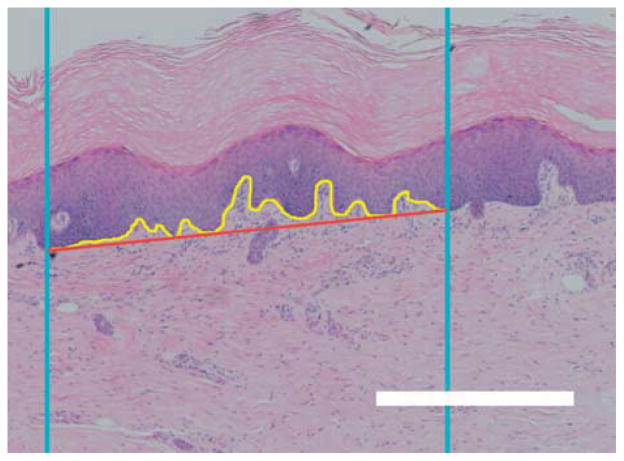
The interdigitation index was calculated with modifications to a method described by Timar et al.40 Briefly, two vertical lines with an interline distance of 1000 μm were randomly generated and overlaid on randomly rotated 2x images of the H&E stained sections. A line tracing the dermal-epidermal junction (DEJ) border was made from where the first random line intercepted to where the second random line intercepted. The length of this trace and the distance between the starting point and the end point was determined (Figure 3). The interdigitation index was the ratio of the length of the trace to the distance between the starting and ending point.
Fig. 3.
Interdigitation index. Blue lines represent the lines of the probe; the yellow line represents the length of the dermal-epidermal border; and the red line represents the distance between the intercept of the probe and the dermal-epidermal border. Scale bar represents 500 μm.
Adipocyte size
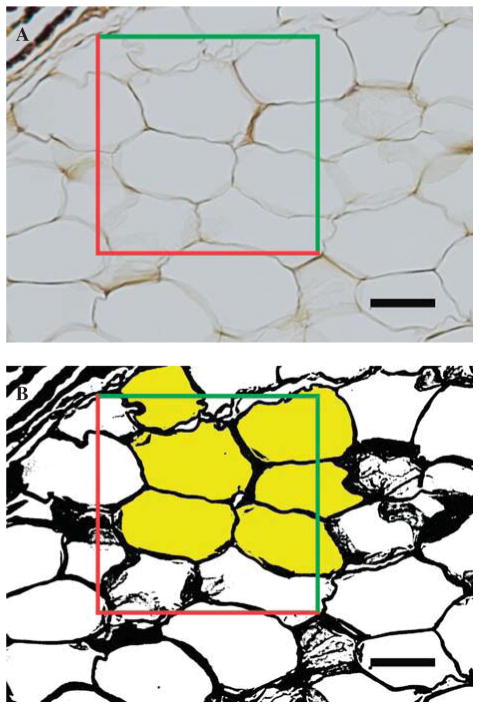
An optical-dissector probe (area of 25,000 μm2) was randomly placed over 10x images using systematic random sampling rules.13,33 Images were converted to 8-bit binary images prior to thresholding (Figure 4). The adipocytes lying within the dissector and touching the top and right planes were selected using the ‘magic wand’ tool in ImageJ and the area, minimum Feret and Feret diameter were generated for each cell. Adipocytes that were damaged or overly distorted due to processing were not included in the measurements.
Fig. 4.
Adipose cell size. A, An optical-dissector probe (red and green lines) was placed over the images. B, After thresholding, adipocytes located in the frame or touched by the green inclusion lines were sampled (selected yellow). Adipocytes that crossed red exclusion lines were not sampled. Scale bar represents 50 μm.
Area fraction
A point probe (a series of equally spaced crosses, with an area per point of 500,000 μm2) was randomly placed over 2x images of the adipose layer stained with modified Hart’s. Structures that touched the top right corner of the probe were counted using systematic random sampling rules. Structures counted included adipocytes, and elastic septa. Area fractions were calculated for the adipocytes and elastic septa. Structures such as vasculature and muscle were not included in the calculations.
Statistics
To determine differences in demographic measures by condition, two sample T-tests or Fisher’s exact test (for sex) were used. Differences in histology by condition accounting for repeated measures within foot for each location were assessed using linear mixed effects regression. Histology measure was the dependent variable, condition was the independent fixed effect, and foot was the random effect. Significance was set at p < 0.05. Analyses were conducted using R 2.9.0 (R Foundation for Statistical Computing, Vienna, Austria).
RESULTS
None of the feet displayed any indication of ulceration or breakdown at the time of tissue harvest, i.e., all tissue was taken from visually healthy feet. In addition, no evidence of breakdown (lesions, vacuoles, necrosis, hematoma or large inflammatory response) was observed in the skin or underlying fat layer during general histological evaluation. In all samples, the various layers of the tissue (epidermis, dermis and hypodermis) appeared to be firmly anchored to one another and did not display evidence of separation.
The soft tissue taken from both the subcalcaneal and first submetatarsal regions revealed four major layers: epidermis, dermis, hypodermis and muscle (panniculus carnosus). No obvious qualitative differences were observed between locations. However, histological analysis revealed a number of histomorphological differences between tissue taken from the diabetic and non-diabetic donors.
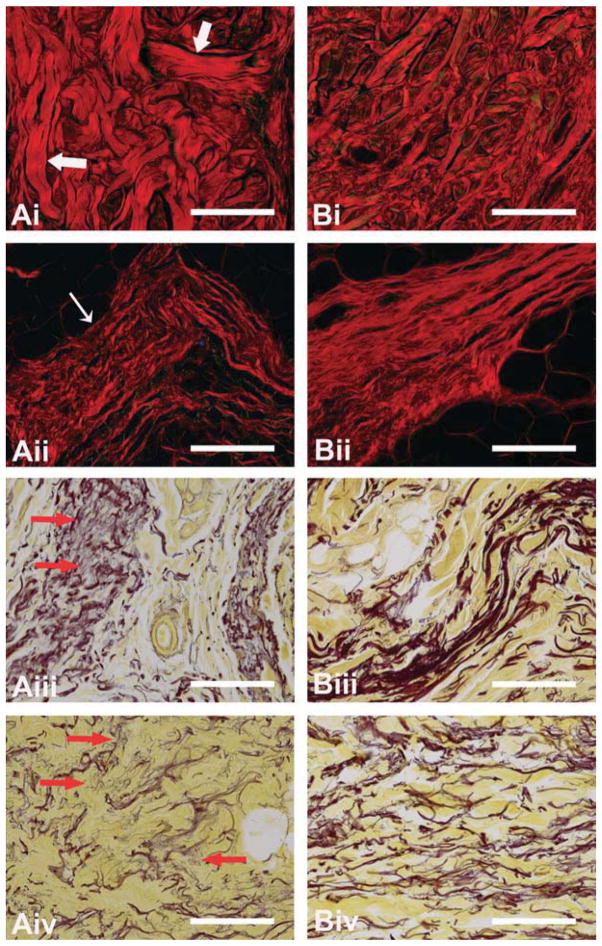
Although the overall mean skin thickness (epidermis and dermis) was greater for diabetic compared to non-diabetic tissue (Table 2), this difference was not statistically significant for the numbers available in this study. When measurements were split into epidermal and dermal components, it was found that the dermis of diabetic tissue was significantly thicker (p = 0.011) than non-diabetic tissue (Table 2). No statistical difference was observed in the epidermal thickness, although diabetic tissue had a lower mean value (Table 2). In a number of the diabetic tissues, the collagen bundles in the dermis were observed qualitatively to be thicker (Figure 5). The interdigitation index was not found to be significantly different in the diabetic compared to control tissue despite the mean value being smaller for the diabetic tissue.
Table 2.
Histological Measures by Diabetes Status (means ± SD)
| Diabetic | Non-Diabetic | p | |
|---|---|---|---|
| Skin Thickness [Arithmetic, Harmonic] (μm) | 2056 ± 662 [1614 ± 520, 1722 ± 553] | 1815 ± 668 [1425 ± 524, 1530 ± 542] | 0.4 |
| Dermis Thickness [Arithmetic, Harmonic] (μm) | 1103 ± 255 [866 ± 200, 872 ± 198] | 688 ± 321 [540 ± 252, 529 ± 271] | 0.011 |
| Epidermis Thickness [Arithmetic, Harmonic] (μm) | 953 ± 486 [748 ± 381, 797 ± 418] | 1127 ± 611 [885 ± 480, 935 ± 499] | 0.5 |
| Interdigitation Index | 1.90 ± 0.35 | 2.09 ± 0.30 | 0.3 |
| Area Fraction of Elastic Septae [Adipose] (%) | 67 ± 7 [33 ± 7] | 46 ± 16 [54 ± 15] | 0.0035 |
| Elastic Septae Thickness [Arithmetic, Harmonic] (μm) | 270 ± 61 [212 ± 48, 96 ± 31] | 151 ± 56 [120 ± 43, 62 ± 20] | 0.0003 |
| Adipose Area (μm2) | 2160 ± 451 | 1812 ± 492 | 0.2 |
| Minimum Adipocyte Diameter (μm) | 45.0 ± 4.9 | 40.7 ± 5.6 | 0.13 |
Fig. 5.
Diabetic (A) and non-diabetic (B) dermis (i), and elastic septae (ii–iv) sections stained with picro sirius red (i and ii) or modified Hart’s stain (iii and iv). Larger collagen bundles (large white arrows) can be observed in the dermis of diabetic tissue (Ai). The collagen in the diabetic elastic septae (Aii) are fragmented and lack periodicity (thin white arrow). The elastic fibers in elastic septae of diabetic tissue (Aiii and iv) are fragmented and frayed (red arrows). Scale = 200 μm.
Stereological evaluation of the hypodermis revealed a statistically significant increase in the area fraction of elastic septae in diabetic tissue versus non-diabetic tissue (Table 2), with a corresponding decrease in area fraction of adipose tissue. Indeed, measurements of the septal wall thickness (p = 0.0003) verified that the elastic septa were quantitatively thicker (Table 2) in the diabetic tissue. These increases were accompanied by observations of fragmentation/fraying of the elastin fibers within the septal walls of the diabetic tissue (Figure 5). In addition, the septal walls of the diabetic tissue contained collagen bundles that were thicker in sections, frayed on others, more disordered and without distinct band periodicity (Figure 5).
Although mean adipocyte cell areas and minimum diameters were not found to be statistically different for diabetic compared to non-diabetic tissue (Table 2), the mean values tended to larger values in the diabetic tissue (area, 2160 ± 451 μm2 versus 1812 ± 492 μm2; min. diameter, 45 ± 4.9 μm versus 40.7 ± 5.6 μm). This tendency was visually apparent in a few samples (data not shown). No obvious differences in the adipose tissue compartments were observed. Atrophy of the adipocytes was not observed in any of the tissue specimens, although in some specimens, the adipocytes in the diabetic tissue appeared to be less uniform in shape.
No remarkable differences were noted in the panniculus carnosus muscle layer. No quantitative evaluation was made of this tissue layer.
DISCUSSION
Diabetes is known to cause detrimental changes in the pathophysiology of the diabetic foot, which can lead to a greater susceptibility to ulceration. Evaluation of the pathophysiological differences in tissue structure is therefore important in the establishment of preventative measures in that it might provide a basic understanding of the morphological changes that occur in diabetic plantar soft tissue. Relating these changes to the biochemical and mechanical changes in the tissue will provide insight into the complicated relationship between histological, biochemical and mechanical properties. From these basic relationships, new treatment options may be developed.
We performed a histomorphological study of diabetic and non-diabetic, age-matched plantar tissue at two locations (the heel and first metatarsal) using a combination of stereological methods and quantitative morphology. We found that the diabetic tissue had a thicker dermis, thicker elastic septae as well as abnormal collagen and elastin fibers, but there were no differences in the adipocyte size or the interdigitation of the DEJ. Evaluations of the vasculature and nerves were not included in the study as this study focused on the structural components of the tissue.
A strength of this study was the adjustment of the thickness data to make random non-biased measurements in the histological sections. Estimation of true thickness requires knowledge of section orientation; the measured thickness on random sections tends to overestimate the true thickness. However, it is generally accepted that this effect is random, and that the true thickness can be obtained by applying a correction factor to the measured thicknesses.14,25 Traditionally, these stereological methods used to measure and calculate the true thickness were developed for membranous structures, but more recently these methods have been adapted to determine thicknesses for other biomedical applications.16,31,38
It is realized that the current study contains a number of potential limitations. The small sample size for the diabetic group means that it was more difficult to identify differences smaller than the true-effect size. Additionally, the variation in adipocyte area and size is much greater in our analysis than in actuality, given that in any one tissue section, the adipocytes are not all sectioned coplanar with the largest cross-sectional area. Although only one of the donors died from a disease related to diabetes (congestive heart failure), detailed knowledge of the health condition of the donors at the time of death is unknown. That is, it is not known if any of the diabetic patients had presented with other conditions related to diabetes such as peripheral neuropathy. However, no necrosis of the tissue (including muscle and nerves) was observed during histological analysis. Furthermore, it is possible that tissue in the non-diabetic group was actually taken from subjects that had undiagnosed diabetes. However, given none of the non-diabetic group displayed histomorphological characteristics similar to the diabetic tissue, we do not think that this was the case. Finally, the difference in BMI between the groups (the diabetic subjects were much larger) may have confounded the results. Due to the small number of specimens and the lack of much overlap between the groups, it was difficult to statistically account for differences in BMI. Therefore, we can not say for certain if any of the changes seen were due to diabetes status or due to differences in BMI.
The samples obtained displayed the characteristic structure of plantar soft tissue (Figure 6). The skin was a distinct layer with a mean thickness within the expected range.39 A muscle band (panniculus carnosus) lies in the subcutaneous tissue and, in sections, dives into the adipose tissue.11 The underlying fat layer is connected to the reticular dermis by thick fibrous strands that merge with a horizontal fibrous septum. This divides the subcutis into what is termed the “microchamber” or “superficial subcutaneous layer” or “superficial stratum” and the “macrochamber” or “deeper subcutaneous layer” or “deep stratum.”8,21,27 The deep macrochamber layer is thicker than the superficial microchamber layer and contains large compartments of adipocytes separated by elastic septae. The superficial microchamber contains smaller adipocyte compartments. In the ultrasound images of human subcalcaneal tissue taken by Hsu et al.,21 the deep macrochamber can be clearly identified as being distinct from the superficial microchamber layer. However, contrary to the reports in Hsu et al.’s study, it can be difficult to differentiate the superficial microchamber layer from the dermis with ultrasound. Inclusion of the dermal and epidermal layers into the superficial layer, as was done in their paper, could introduce errors in analysis and be misleading in interpretation of results.
Fig. 6.
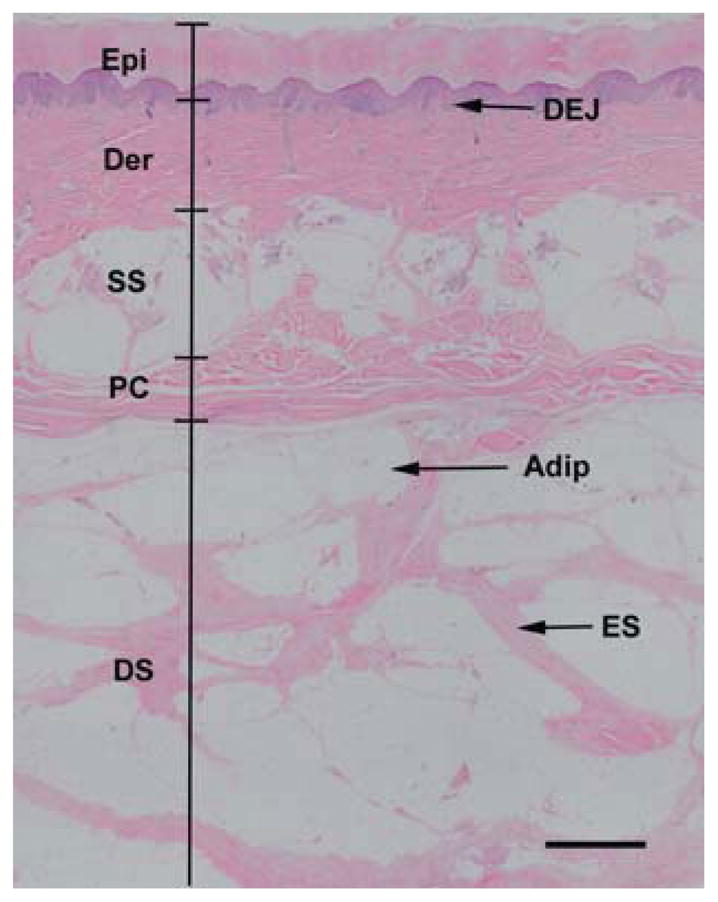
Normal skin structure. The epidermis (Epi) and dermis (Der) are separated by the dermal-epidermal junction (DEJ). Beneath the dermis lies the superficial subcutaneous layer (SS), which is separated from the deep subcutaneous layer (DS) by the panniculus carnosus (PC). The deep subcutaneous layer contains chambers of adipocytes (Adip) surrounded by elastic septae (ES). Scale, 1 mm.
Histomorphological studies of the skin can provide great insight into alterations due to changes in metabolic status. Although no differences were observed in the overall thickness of the skin, the dermis of diabetic tissue was found to be significantly thicker compared to non-diabetic tissue. Skin thickening is a well-known characteristic of diabetes and results from thickening of the collagen bundles and vessel walls, and fraying of the elastic fibers.17,19 Indeed, thickening of the collagen was observed in the diabetic dermis (Figure 5), but no differences in epidermal thickness were observed. However, this is not surprising given confounding reasons (e.g., callus formation) for variability in thickness independent of the presence of diabetes. The DEJ is a highly specialized structure that lies between the epidermis and dermis; it is important in the overall structural integrity of the skin7 as it provides an anchoring interface between the two layers. Detrimental changes to this structure, as quantified by the interdigitation index,40 would potentially make the tissue more susceptible to damage by shear forces experienced in walking. Retraction of the epidermal papillae has been reported to occur with age29 and this would result in a decreased interdigitation index. Diabetes and aging are known to result in similar biochemical modifications of skin, which can result in similar changes in the extracellular matrix structure.34,43 In the current study, no difference in the interdigitation index was observed between the diabetic and non-diabetic tissue. However, given both groups were from older populations, it is not surprising that differences were not found to be significant. It is expected that if comparing young non-diabetic tissue, the differences in this parameter might be apparent.
The panniculus carnosus muscle, observed in the subcutaneous tissue of both foot locations evaluated, has been suggested to be the primary site of injury in ulceration.11 In our study, no obvious signs of damage in this layer were noted nor were any obvious morphometric differences observed between diabetic and non-diabetic tissue. However, it is likely that there are other structural or component differences that were not evident by general histological evaluation alone. For example, no evaluation of vascularization or muscle bundle size was performed. An impaired blood supply to such a highly metabolically active structure would lead to greater susceptibility to ischemic insults.
With diabetes, elastic septae thickness has been reported to increase, elastin fibers have been shown to be fragmented and irregular collagen deposition has been observed.8,24,39 These observations were also made in the current study with the mean arithmetic thickness of elastic septae being 76% greater in the diabetic tissue and with aberrant extra cellular matrix characteristics (Figure 5). This finding was in contrast to that of Waldeker et al. who did not observe any qualitative difference in collagen or elastin fiber characteristics;41 however, that study examined biopsied metatarsal fat rather than the entire tissue cross section (e.g., skin, elastic septae, adipocytes, etc.).
Although the mean adipocyte cell area and minimum diameter were slightly larger in the diabetic tissue, this difference was not found to be statistically significant. This agreed with Waldeker et al.,41 who found no difference in adipocyte size between diabetic and non-diabetic specimens, but is in contrast with Buschmann et al.,8 who reported a 30% decrease in adipocyte mean area and a 16% decrease in mean adipocyte diameter in diabetic plantar soft tissue. However, the later study used samples from limbs that were amputated due to various complications associated with diabetes. It is possible that the adipocytes in these samples were reduced in size due to atrophy of the tissue resulting from the complications rather than diabetes itself. All tissue used in the current study was taken from intact diabetic donor cadavers.
CONCLUSION
A histomorphological study of diabetic and non-diabetic plantar tissue taken from two locations was carried out using a combination of stereological methods and quantitative morphology. A number of significant differences were observed, including an increase in mean elastic septae thickness and increase in dermal thickness. In addition, qualitative differences in the extracellular matrix were observed in the form of fraying of the elastic fibers and thickening of the collagen bundles in the diabetic tissue. Some of these changes can explain the detrimental changes to the mechanical properties of the plantar soft tissue and the resulting susceptibility to breakdown. For example, thickening of the elastic septae and of the collagen bundles within the septae may explain the increase in stiffness of the plantar tissue.35 Increase in stiffness can result in a decreased ability to dissipate applied pressure, which may increase the risk of ulceration. This study demonstrated that there are histomorphological differences in non-diabetic and diabetic tissue, although the increase in BMI may also be causative. This may have implications when considering the ability of plantar soft tissue to accommodate the large stresses and strains that occur during ambulation. Future work will involve relating these cellular/matrix level changes to the mechanical properties of the plantar soft tissue to quantify how the histomorphological changes are manifested in the macroscopic tissue behavior.
Acknowledgments
This study was supported by NIH grant 1R01 DK75633-03, the Department of Veterans Affairs, RR&D Service grant A4843C, and in part by NIDDK grant P30DK017047.
Footnotes
For information on pricings and availability of reprints, call 410-494-4994, x232.
References
- 1.Abouaesha F, van Schie CH, Griffths GD, Young RJ, Boulton AJ. Plantar tissue thickness is related to peak plantar pressure in the high-risk diabetic foot. Diabetes Care. 2001;24:1270–1274. doi: 10.2337/diacare.24.7.1270. http://dx.doi.org/10.2337/diacare.24.7.1270. [DOI] [PubMed] [Google Scholar]
- 2.American Diabetes Association. Consensus development conference on diabetic foot wound care. Boston, MA: American Diabetes Association; Apr 7–8, 1999. [Google Scholar]; Adv Wound Care. 1999;12:353–361. [PubMed] [Google Scholar]
- 3.Baddeley AJ, Gundersen HJ, Cruz-Orive LM. Estimation of surface area from vertical sections. J Microsc. 1986;142:259–276. doi: 10.1111/j.1365-2818.1986.tb04282.x. [DOI] [PubMed] [Google Scholar]
- 4.Boucek P. Advanced Diabetic Neuropathy: A Point of no Return? Rev Diabet Stud. 2006;3:143–150. doi: 10.1900/RDS.2006.3.143. http://dx.doi.org/10.1900/RDS.2006.3.143. [DOI] [PMC free article] [PubMed] [Google Scholar]
- 5.Boyko EJ, Ahroni JH, Stensel V, et al. A prospective study of risk factors for diabetic foot ulcer. The Seattle Diabetic Foot Study. Diabetes Care. 1999;22:1036–1042. doi: 10.2337/diacare.22.7.1036. http://dx.doi.org/10.2337/diacare.22.7.1036. [DOI] [PubMed] [Google Scholar]
- 6.Brash PD, Foster J, Vennart W, Anthony P, Tooke JE. Magnetic resonance imaging techniques demonstrate soft tissue damage in the diabetic foot. Diabet Med. 1999;16:55–61. doi: 10.1046/j.1464-5491.1999.00005.x. http://dx.doi.org/10.1046/j.1464-5491.1999.00005.x. [DOI] [PubMed] [Google Scholar]
- 7.Burgeson RE, Christiano AM. The dermal-epidermal junction. Curr Opin Cell Biol. 1997;9:651–658. doi: 10.1016/s0955-0674(97)80118-4. http://dx.doi.org/10.1016/S0955-0674(97)80118-4. [DOI] [PubMed] [Google Scholar]
- 8.Buschmann WR, Jahss MH, Kummer F, et al. Histology and histomorphometric analysis of the normal and atrophic heel fat pad. Foot & Ankle International. 1995;16:254–258. doi: 10.1177/107110079501600502. [DOI] [PubMed] [Google Scholar]
- 9.Cavanagh PR, Simoneau GG, Ulbrecht JS. Ulceration, unsteadiness, and uncertainty: the biomechanical consequences of diabetes mellitus. J Biomech. 1993;26:23–40. doi: 10.1016/0021-9290(93)90077-r. http://dx.doi.org/10.1016/0021-9290(93)90077-R. [DOI] [PubMed] [Google Scholar]
- 10.Cheung YY, Doyley M, Miller TB, et al. Magnetic resonance elastography of the plantar fat pads: Preliminary study in diabetic patients and asymptomatic volunteers. J Comput Assist Tomogr. 2006;30:321–326. doi: 10.1097/00004728-200603000-00031. http://dx.doi.org/10.1097/00004728-200603000-00031. [DOI] [PubMed] [Google Scholar]
- 11.Cichowitz A, Pan WR, Ashton M. The heel: anatomy, blood supply, and the pathophysiology of pressure ulcers. Ann Plast Surg. 2009;62:423–429. doi: 10.1097/SAP.0b013e3181851b55. http://dx.doi.org/10.1097/SAP.0b013e3181851b55. [DOI] [PubMed] [Google Scholar]
- 12.Cowley MS, Boyko EJ, Shofer JB, Ahroni JH, Ledoux WR. Foot ulcer risk and location in relation to prospective clinical assessment of foot shape and mobility among persons with diabetes. Diabetes Research and Clinical Practice. 2008;82:226–232. doi: 10.1016/j.diabres.2008.07.025. http://dx.doi.org/10.1016/j.diabres.2008.07.025. [DOI] [PubMed] [Google Scholar]
- 13.Cruz-Orive LM, Weibel ER. Recent stereological methods for cell biology: a brief survey. Am J Physiol. 1990;258:L148–156. doi: 10.1152/ajplung.1990.258.4.L148. [DOI] [PubMed] [Google Scholar]
- 14.Da Costa OT, Pedretti AC, Schmitz A, Perry SF, Fernandes MN. Stereological estimation of surface area and barrier thickness of fish gills in vertical sections. J Microsc. 2007;225:1–9. doi: 10.1111/j.1365-2818.2007.01710.x. http://dx.doi.org/10.1111/j.1365-2818.2007.01710.x. [DOI] [PubMed] [Google Scholar]
- 15.Ferrando RE, Nyengaard JR, Hays SR, Fahy JV, Woodruff PG. Applying stereology to measure thickness of the basement membrane zone in bronchial biopsy specimens. J Allergy Clin Immunol. 2003;112:1243–1245. doi: 10.1016/j.jaci.2003.09.038. http://dx.doi.org/10.1016/j.jaci.2003.09.038. [DOI] [PubMed] [Google Scholar]
- 16.Garcia Y, Breen A, Burugapalli K, Dockery P, Pandit A. Stereological methods to assess tissue response for tissue-engineered scaffolds. Biomaterials. 2007;28:175–186. doi: 10.1016/j.biomaterials.2006.08.037. http://dx.doi.org/10.1016/j.biomaterials.2006.08.037. [DOI] [PubMed] [Google Scholar]
- 17.Goodfield MJ, Millard LG. The skin in diabetes mellitus. Diabetologia. 1988;31:567–575. doi: 10.1007/BF00264762. http://dx.doi.org/10.1007/BF00264762. [DOI] [PubMed] [Google Scholar]
- 18.Gundersen HJ, Osterby R. Optimizing sampling efficiency of stereological studies in biology: or ‘do more less well!’. J Microsc. 1981;121:65–73. doi: 10.1111/j.1365-2818.1981.tb01199.x. [DOI] [PubMed] [Google Scholar]
- 19.Hanna W, Friesen D, Bombardier C, Gladman D, Hanna A. Pathologic features of diabetic thick skin. J Am Acad Dermatol. 1987;16:546–553. doi: 10.1016/s0190-9622(87)70072-3. http://dx.doi.org/10.1016/S0190-9622(87)70072-3. [DOI] [PubMed] [Google Scholar]
- 20.Hosein R, Lord M. A study of in-shoe plantar shear in normals. Clin Biomech. 2000;15:46–53. doi: 10.1016/s0268-0033(98)00059-x. http://dx.doi.org/10.1016/S0268-0033(98)00059-X. [DOI] [PubMed] [Google Scholar]
- 21.Hsu CC, Tsai WC, Hsiao TY, et al. Diabetic effects on microchambers and macrochambers tissue properties in human heel pads. Clin Biomech (Bristol, Avon) 2009;24:682–686. doi: 10.1016/j.clinbiomech.2009.06.005. http://dx.doi.org/10.1016/j.clinbiomech.2009.06.005. [DOI] [PubMed] [Google Scholar]
- 22.Hsu CC, Tsai WC, Shau YW, Lee KL, Hu CF. Altered energy dissipation ratio of the plantar soft tissues under the metatarsal heads in patients with type 2 diabetes mellitus: a pilot study. Clin Biomech (Bristol, Avon) 2007;22:67–73. doi: 10.1016/j.clinbiomech.2006.06.009. http://dx.doi.org/10.1016/j.clinbiomech.2006.06.009. [DOI] [PubMed] [Google Scholar]
- 23.Isakov E, Budoragin N, Shenhav S, et al. Anatomic sites of foot lesions resulting in amputation among diabetics and non-diabetics. Am J Phys Med Rehabil. 1995;74:130–133. http://dx.doi.org/10.1097/00002060-199503000-00008. [PubMed] [Google Scholar]
- 24.Jahss MH, Michelson JD, Desai P, et al. Investigations into the fat pads of the sole of the foot: Anatomy and histology. Foot & Ankle. 1992;13:233–242. doi: 10.1177/107110079201300502. [DOI] [PubMed] [Google Scholar]
- 25.Jensen EB, Gundersen HJ, Osterby R. Determination of membrane thickness distribution from orthogonal intercepts. J Microsc. 1979;115:19–33. doi: 10.1111/j.1365-2818.1979.tb00149.x. [DOI] [PubMed] [Google Scholar]
- 26.Kao PF, Davis BL, Hardy PA. Characterization of the calcaneal fat pad in diabetic and non-diabetic patients using magnetic resonance imaging. Magn Reson Imaging. 1999;17:851–857. doi: 10.1016/s0730-725x(99)00019-3. http://dx.doi.org/10.1016/S0730-725X(99)00019-3. [DOI] [PubMed] [Google Scholar]
- 27.Kimani JK. The structural and functional organization of the connective tissue in the human foot with reference to the histomorphology of the elastic fibre system. Acta Morphologica Neerlando-Scandinavica. 1984;22:313–323. [PubMed] [Google Scholar]
- 28.Klaesner JW, Hastings MK, Zou DQ, Lewis C, Mueller MJ. Plantar tissue stiffness in patients with diabetes mellitus and peripheral neuropathy. Archives of Physical Medicine and Rehabilitation. 2002;83:1796–1801. doi: 10.1053/apmr.2002.35661. http://dx.doi.org/10.1053/apmr.2002.35661. [DOI] [PubMed] [Google Scholar]
- 29.Lavker RM, Zheng PS, Dong G. Morphology of aged skin. Dermatol Clin. 1986;4:379–389. [PubMed] [Google Scholar]
- 30.Ledoux WR, Hillstrom HJ. The distributed plantar vertical force of neutrally aligned and pes planus feet. Gait Posture. 2002;15:1–9. doi: 10.1016/s0966-6362(01)00165-5. http://dx.doi.org/10.1016/S0966-6362(01)00165-5. [DOI] [PubMed] [Google Scholar]
- 31.Macleod TM, Williams G, Sanders R, Green CJ. Histological evaluation of Permacol as a subcutaneous implant over a 20-week period in the rat model. Br J Plast Surg. 2005;58:518–532. doi: 10.1016/j.bjps.2004.12.012. http://dx.doi.org/10.1016/j.bjps.2004.12.012. [DOI] [PubMed] [Google Scholar]
- 32.Mayhew TM. The new stereological methods for interpreting functional morphology from slices of cells and organs. Exp Physiol. 1991;76:639–665. doi: 10.1113/expphysiol.1991.sp003533. [DOI] [PubMed] [Google Scholar]
- 33.Nyengaard JR, Gundersen HJ. Sampling for Stereology in Lungs. Eur Respir Rev. 2006;15:107–114. http://dx.doi.org/10.1183/09059180.00010101. [Google Scholar]
- 34.Pageon H. Reaction of glycation and human skin: The effects on the skin and its components, reconstructed skin as a model. Pathol Biol (Paris) 2009 doi: 10.1016/j.patbio.2009.09.009. [DOI] [PubMed]
- 35.Pai S, Ledoux WR. The compressive mechanical properties of diabetic and non-diabetic plantar soft tissue. J Biomech. 2010;43:1754–1760. doi: 10.1016/j.jbiomech.2010.02.021. http://dx.doi.org/10.1016/j.jbiomech.2010.02.021. [DOI] [PMC free article] [PubMed] [Google Scholar]
- 36.Reiber GE, Lipsky BA, Gibbons GW. The burden of diabetic foot ulcers. American Journal of surgery. 1998;176:5S–10S. doi: 10.1016/s0002-9610(98)00181-0. http://dx.doi.rg/10.1016/S0002-9610(98)00181-0. [DOI] [PubMed] [Google Scholar]
- 37.Shaw JE, Boulton AJ. The pathogenesis of diabetic foot problems: an overview. Diabetes. 1997;46 (Suppl 2):S58–61. doi: 10.2337/diab.46.2.s58. [DOI] [PubMed] [Google Scholar]
- 38.Shishatskaya EI, Volova TG, Puzyr AP, Mogilnaya OA, Efremov SN. Tissue response to the implantation of biodegradable polyhydroxyalkanoate sutures. J Mater Sci Mater Med. 2004;15:719–728. doi: 10.1023/b:jmsm.0000030215.49991.0d. http://dx.doi.org/10.1023/B:JMSM.0000030215.49991.0d. [DOI] [PubMed] [Google Scholar]
- 39.Snyder WS, Cook MJ, Nasset LR, et al. Report of the Task Group on Reference Man. Amsterdam: Elsevier; 1975. [Google Scholar]
- 40.Timar F, Soos G, Szende B, Horvath A. Interdigitation index – a parameter for differentiating between young and older skin specimens. Skin Res Technol. 2000;6:17–20. doi: 10.1034/j.1600-0846.2000.006001017.x. http://dx.doi.org/10.1034/j.1600-0846.2000.006001017.x. [DOI] [PubMed] [Google Scholar]
- 41.Waldecker U, Lehr HA. Is there histomorphological evidence of plantar metatarsal fat pad atrophy in patients with diabetes? J Foot Ankle Surg. 2009;48:648–652. doi: 10.1053/j.jfas.2009.07.008. http://dx.doi.org/10.1053/j.jfas.2009.07.008. [DOI] [PubMed] [Google Scholar]
- 42.Williams DR. Hospital admissions of diabetic patients: information from hospital activity analysis. Diabet Med. 1985;2:27–32. doi: 10.1111/j.1464-5491.1985.tb00588.x. http://dx.doi.org/10.1111/j.1464-5491.1985.tb00588.x. [DOI] [PubMed] [Google Scholar]
- 43.Wulf HC, Sandby-Moller J, Kobayasi T, Gniadecki R. Skin aging and natural photoprotection. Micron. 2004;35:185–191. doi: 10.1016/j.micron.2003.11.005. http://dx.doi.org/10.1016/j.micron.2003.11.005. [DOI] [PubMed] [Google Scholar]
- 44.Yavuz M, Botek G, Davis BL. Plantar shear stress distributions: Comparing actual and predicted frictional forces at the foot-ground interface. J Biomech. 2007;40:3045–3049. doi: 10.1016/j.jbiomech.2007.02.006. http://dx.doi.org/10.1016/j.jbiomech.2007.02.006. [DOI] [PMC free article] [PubMed] [Google Scholar]
- 45.Zheng YP, Choi YK, Wong K, Chan S, Mak AF. Biomechanical assessment of plantar foot tissue in diabetic patients using an ultrasound indentation system. Ultrasound Med Biol. 2000;26:451–456. doi: 10.1016/s0301-5629(99)00163-5. http://dx.doi.org/10.1016/S0301-5629(99)00163-5. [DOI] [PubMed] [Google Scholar]


