

Abstract
Formaldehyde has long been the fixative of choice for histological examination of tissue. The use of alternatives to formaldehyde has grown, however, owing to the serious hazards associated with its use. Companies have striven to maintain the morphological characteristics of formaldehyde-fixed tissue when developing alternatives. Glyoxal-based fixatives now are among the most popular formaldehyde alternatives. Although there are many studies that compare staining quality and immunoreactivity, there have been no studies that quantify possible structural differences. Histomorphometric analysis commonly is used to evaluate diseased tissue. We compared fixation with formaldehyde and glyoxal with regard to the histomorphological properties of plantar foot tissue using a combination of stereological methods and quantitative morphology. We measured skin thickness, interdigitation index, elastic septa thickness, and adipocyte area and diameter. No significant differences were observed between formaldehyde and glyoxal fixation for any feature measured. The glyoxal-based fixative used therefore is a suitable fixative for structural evaluation of plantar soft tissue. Measurements obtained from the glyoxal-fixed tissue can be combined with data obtained from formalin-fixed for analysis.
Keywords: formaldehyde, glyoxal, heel pad, plantar soft tissue, stereology, structural properties
The use of formaldehyde as a fixative has long been the gold standard for the histopathological examination of tissue. In a health and environmentally conscientious age, however, formaldehyde has lost some appeal owing to the serious hazards associated with its use (Buesa 2008). In addition, the increase in the number of molecular biological techniques also has highlighted limitations of formaldehyde fixation; extraction of DNA and RNA can preclude the use of formaldehyde (Vincek et al. 2003). Although the desire to find a replacement has become more urgent in recent years, there has been considerable resistance to change. A large part of this resistance stems from the fact that the morphology resulting from formaldehyde fixation is the standard that pathologists everywhere use for making diagnoses (Buesa 2008). As a result, many companies have striven to develop a technically superior formalin alternative that produces similar morphology.
During the past two decades, glyoxal fixatives have become the most popular alternatives to formaldehyde fixatives in North America (Dapson 2007). Prefer™ (Anatech Ltd., Battle Creek, MI) was one of the first commercially successful glyoxal fixatives available for biologists. Compared to formaldehyde, glycoxal fixatives have a better safety profile, faster reaction rate and improved immunoreactivity (Dapson 2007). There are a number of reports comparing staining and immunohistochemical labeling results between formaldehyde and glyoxal-fixed tissues (Atkins et al. 2004, Umlas et al. 2004, Dapson 2007). Quantification of structural differences, i.e., size of biological structures, has not been performed.
Histomorphometric analysis commonly is used to investigate the effects on tissue of disease and its treatment. Diabetes is an example of a disease that leads to detrimental changes in the physiology of tissue. These changes are particularly important with regard to ulceration of plantar foot tissues. One documented pathological change is increased thickness of the elastic septa (Jahss et al. 1992, Buschmann et al. 1995, Wang et al. 2010). Although ideally all tissue used in a given study would be fixed in the same way, sometimes this is not possible. For example, studies in which rare tissues are evaluated, e.g., diseased cadaver tissue, often require obtaining tissue from a number of different sources, possibly after different fixations.
The purpose of our study was to compare fixation with formaldehyde and glyoxal with regard to the histomorphological properties of plantar tissue using a combination of stereological methods and quantitative morphology. All diabetic tissue was taken from cadaver limbs that were not amputated because of vascular issues.
Materials and methods
Specimen procurement and tissue processing
Soft tissue samples (1 × 1 cm) of the plantar foot containing epidermis, dermis and subcutaneous fat (hypodermis), were obtained from the subcal-caneal, first submetatarsal and lateral submidfoot regions of fresh frozen cadaver feet. Two donors were used for this study and a total of five samples were taken. All specimens were bisected in cross-section. One half was placed in 10% neutral buffered formalin for 7 days and the other in a glyoxal fixative (Prefer™, Anatech Ltd., Battle Creek, MI) for 5 days with at least one change of fresh solution. All samples were procured by National Disease Research Interchange (NDRI, Philadelphia, PA).
Vertical uniform random (VUR) sampling of the specimens (Baddeley et al. 1986) was used to obtain unbiased, isotropic sections when combined with stereological sampling probes. Briefly, the axis perpendicular to the skin surface was selected as the vertical direction. The fixed specimen was rotated randomly and cut into approximately 1 mm slabs. Each tissue slab was embedded in paraffin and six 10 μm thick serial tissue sections were cut from each block. Successive sections were stained with hematoxylin and eosin (H & E), picrosirius red for collagen and a modified Hart’s procedure for elastin. H & E staining was performed using standard techniques.
Picrosirius red staining was performed using methods based on those published earlier (Junqueira et al. 1979, Kiernan 1999). Briefly, after dewaxing and hydrating, nuclei were stained with Weigert’s hematoxylin for 20 min and washed. Sections then were stained in picrosirius red solution (direct red 80, CI 35780; Sigma, St. Louis, MO) for 1 h before washing in acidified water, dehydrating, clearing and mounting. Sections were visualized under polarized light.
The modified Hart’s protocol for elastin staining was kindly provided by Dr. Barry Starcher, UTH-SCT, Texas (Starcher 2005). After dewaxing and hydrating, sections were stained in resorcin fuchsin (Electron Microscopy Sciences, Hatfield, PA) for 4 h. The staining time in resorcin fuchsin was determined earlier, because incubation time decreases with the age of the solution. After rinsing, sections were counterstained with 2% tartrazine (acid yellow 23, CI 19140) in 0.5% acetic acid for 1 min, washed, dehydrated, cleared and mounted.
Image analysis
Image analysis of the histological sections was performed using a Nikon microscope (Eclipse 80i, Melville, NY) and digitized with a 12.6 megapixel digital camera (DXM-1200C, Nikon, Melville, NY). Images were taken using 2, 4 and 10 × magnification and imported to ImageJ 1.42 (National Institutes of Health, Bethesda, MD) for analysis. Images were analyzed in a blind fashion. The total observed variation of the data can be partitioned into sampling variance (sampling error) and biological variance (Gundersen et al. 1981). Therefore, preliminary analysis was performed to determine the minimum number of images and measurements required so that only a negligible amount of the total variation was due to sampling error.
Elastic septa thickness
The thickness of the septal walls was measured in sections stained with modified Hart’s protocol and imaged at 4 ×. This stain results in black elastic fibers with a yellow background (tartrazine counterstain), which gives good visualization of the septal walls (Fig. 1). Estimation of true thickness requires knowledge of section orientation, which is impossible for histological evaluation of many biological structures. The measured thickness of random sections tends to overestimate the true thickness and varies with variations in the sectioning plane. It is generally accepted, however, that this effect is random and the true thickness can be obtained by applying a correction factor of π/4 to the measured thicknesses (Jensen et al. 1979, Da Costa et al. 2007). The harmonic mean estimation has been suggested to be statistically more efficient than the arithmetic mean thickness, because it minimizes the influence of large values on the mean. The overestimation can therefore be overcome by using a stereological approach (Mayhew 1991, Ferrando et al. 2003, Da Costa et al. 2007, Garcia et al. 2007). Parallel lines with an inter-line distance of 500 μm were overlaid randomly on randomly rotated 4 × images and lines orthogonal to the left aspect of the septal walls were drawn across from the intersections to give measurements of the intercept length (L). From these measurements, the arithmetic thickness (Ta) and harmonic thickness (TH) can be calculated (Equations 1 and 2) (Da Costa et al. 2007, Garcia et al. 2007) as:
| 1 |
| 2 |
where LH is the mean reciprocal of the length.
Fig. 1.

Orthogonal intercept method for measurement of elastic septa thickness in a section stained using a modified Hart’s protocol. Blue lines represent the horizontal lines of the probe; the red lines represent the orthogonal thicknesses starting at the intercept of the probe and left aspect of the septal walls. Scale bar = 250 μm.
Skin thickness
Skin thickness was measured in sections stained with H & E, which gives good visualization of the boundary of the dermis and epidermis (Fig. 2). Like the method used to measure septal wall thickness, parallel lines with an inter-line distance of 1500 μm were overlaid randomly on randomly rotated 2 × images and lines orthogonal to the surface of the epidermis were drawn from these intersections to the deepest portions of the reticular dermis (until adipose tissue or muscle was reached). The thickness of the dermis and epidermis was measured along this line to give measurements of the intercept length for each (Ld, Le). The arithmetic thickness (Ta) and harmonic thickness (TH) were calculated from these measurements (Equations 1 and 2).
Fig. 2.

Epidermal and dermal thickness measurements. Blue lines represent the lines of the probe; the red lines represent the orthogonal thicknesses of the skin starting at the intercept of the probe and epidermal surface. The epidermal thickness was measured from the epidermal surface to the dermal-epidermal junction (black arrows). The dermal thickness was measured between the dermal-epidermal junction and the depths of the reticular dermis (white arrow). Scale bar = 500 μm.
Interdigitation index
The interdigitation index was calculated using modifications of a method described by Timar et al. (2000). Briefly, two vertical lines with an interline distance of 1000 μm were generated randomly and overlayed on randomly rotated 2 × images of the H & E stained sections. A line tracing the dermal-epidermal junction was made from the where the first random line intercepted to where the second random line intercepted. The length of this trace and the distance between the starting point and the end point were determined (Fig. 3). The interdigitation index is the ratio of the length of the trace to the distance between the starting and ending points.
Fig. 3.

Interdigitation index. Blue lines represent the lines of the probe, the yellow line represents the length of the dermal-epidermal border and the red line represents the distance between the intercept of the probe and the dermal-epidermal border. Scale bar = 500 μm.
Adipocyte size
An optical-dissector probe (25,000 μm2 area) was placed randomly over 10 × images using systematic random sampling rules (Cruz-Orive et al. 1990, Nyengaard et al. 2006). Images were converted to 8 bit binary images prior to thresholding (Fig. 4). Thresholding is a method of image segmentation in which a grayscale image is converted to a binary image (black and white). Pixels of the image over a certain threshold are denoted black and pixels under a certain threshold are denoted white (Fig. 4). The adipocytes lying within the dissector and touching the top and right planes were selected using the “magic wand” tool in ImageJ, and the area, minimum Feret and Feret diameters were generated for each cell. A stereological dissector is a probe, in this case a square frame, used to allow unbiased sampling and to prevent overestimation of particle counting. The minimum and maximum Feret diameters are the shortest and longest distances between two tangents on opposite sides of the particle being measured. Adipocytes that were damaged or overly distorted owing to processing were not included in the measurements.
Fig. 4.
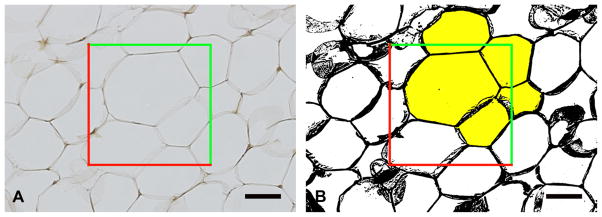
Adipose cell size. A) An optical-dissector probe (red and green lines) was placed over the images. B) After thresholding, adipocytes located in the frame or touched by the green inclusion lines were sampled (selected yellow). Adipocytes that crossed red exclusion lines were not sampled. Scale bar = 50 μm.
Area fraction
A point probe (a series of equally spaced crosses with an area per point of 500000 μm2) was placed randomly over 2 × images of the adipose layer stained with the modified Hart’s procedure. Structures that touched the top right corner of the probe were counted using systematic random sampling rules. Structures counted included adipocytes and elastic septa. Area fractions were calculated for the adipocytes and elastic septa; vasculature and muscle were not included in the calculations.
Statistical methods
Linear mixed effects regression was used to determine whether there were differences in histological outcome by fixative type by combining all five samples for each fixative. The sample and the interaction between sample and fixative were modeled as random effects. Random effects models for each fixative were carried out separately to determine the standard deviation within the sample for each fixative to assess whether results were more variable for one fixative than another. Summary results with samples combined are presented as model estimated means, standard errors (SE) and standard deviations (SD), which account for differences in the number of individual data points across the fixative and sample combination. The mean and SD model estimates are somewhat equivalent to computing means and SD for each sample separately, then averaging them. Analyses were carried out using R 2.9.1 (R Foundation for Statistical Computing, Vienna, Austria).
Results
No significant difference was observed in the sectioning of tissues fixed with glyoxal or with formaldehyde. No obvious differences between the two fixatives were observed in the sections stained with H & E, modified Hart’s protocol or picrosirius red (Fig. 5). The extracellular matrix stained well with H & E and the nuclear chromatin patterns were well defined in both the formaldehyde and glyoxal-fixed tissue. The epidermal and dermal layers of the skin were easily identifiable and the dermal-epidermal junction was well defined using both fixatives (Fig. 5A, B). The elastin fibers within the elastic septal walls were crisp and individual fibers can be seen clearly (Fig. 5C, D). When viewed under cross polarizers, the collagen in the septal walls shows similar birefringence (Fig. 5E, F). The crimping of the collagen fibers also was apparent in tissue fixed with either fixative.
Fig. 5.

Plantar skin (A and B) and fat (C–F) tissue fixed in formaldehyde (A, C, E) or glyoxal (B, D, F) fixatives and stained with H & E (A and B), modified Hart’s protocol (C and D) and picrosirius red (E and F). Black scale bars = 100 μm; white scale bars = 500 μm.
Seven measurements were made from the samples fixed with either the formaldehyde or the glyoxal-based fixative. There was no statistically significant difference between the two fixatives for any of the measurements made (Table 1). For most measurements, formaldehyde-fixed tissue exhibited a slightly greater variation compared to the glyoxal-fixed tissue; however, this was not statistically significant.
Table 1.
Histological measures by fixative status*
| Formaldehyde | Glyoxal | p | |
|---|---|---|---|
| Skin thickness (μm) | 1277 [148] ± 224 | 1162 [119] ± 170 | 0.096 |
| Dermis thickness (μm) | 1058 [133] ± 220 | 941 [109] ± 168 | 0.070 |
| Epidermis thickness (μm) | 219 [41] ± 49 | 221 [45] ± 39 | 0.9 |
| Interdigitation index | 1.86 [0.17] ± 0.36 | 1.81 [0.16] ± 0.28 | .3 |
| Elastic septa thickness (μm) | 134 [19] ± 151 | 135 [20] ± 133 | .9 |
| Adipose area (μm2) | 2807 [388] ± 1509 | 2800 [384] ± 1364 | .9 |
| Minimum adipocyte diameter (μm) | 51.4 [3.4] ± 15.3 | 51.5 [3.7] ± 14.1 | .9 |
Means [SE] ± SD.
Discussion
For hard to obtain tissue, e.g., diseased human cadaver tissue, it sometimes is difficult to acquire tissue that is fixed in a specific manner. This is due primarily to the health hazards of formaldehyde that have caused labs to move toward a formaldehyde-free working environment. Glyoxal-based fixatives are the most popular formaldehyde-free fixatives used in North America (Dapson 2007). Although the literature contains reports that compare the morphology and immunoreactivity of glyoxal-fixed tissue to formaldehyde-fixed tissue, there have been no studies quantifying structural differences.
Histomorphological measurements often are required to quantify tissue changes caused by disease. For example, histomorphological studies of diabetic tissue can provide insight into alterations due to changes in metabolic status. We evaluated seven structural parameters of the plantar foot soft tissue including, skin thickness, epidermal thickness, dermal thickness, interdigitation index, elastic septa thickness, adipocyte area and adipocyte minimum diameter (Jahss et al. 1992, Buschmann et al. 1995, Wang et al. 2010). Several areas of the foot were evaluated. All measurements were made easily in the glyoxal-fixed specimens, because the morphology and staining of the tissue appeared very similar to formaldehyde-fixed tissue. For all measurements, no statistically significant differences were found between the formaldehyde and glyoxal-fixed tissues. Tissues fixed with glyoxal-based fixatives can be used to measure structural properties and the data can be combined with data collected from samples fixed with formaldehyde.
Acknowledgments
This study was supported by NIH grants R01DK75633-03 and P30DK017047 and the Department of Veterans Affairs, RR&D Service grant A4843C.
Footnotes
Declaration of interest: The authors report no conflicts of interest. The authors alone are responsible for the content and writing of the paper.
References
- Atkins D, Reiffen KA, Tegtmeier CL, Winther H, Bonato MS, Storkel S. Immunohistochemical detection of EGFR in paraffin-embedded tumor tissues: variation in staining intensity due to choice of fixative and storage time of tissue sections. J Histochem Cytochem. 2004;52:893–893. doi: 10.1369/jhc.3A6195.2004. [DOI] [PubMed] [Google Scholar]
- Baddeley AJ, Gundersen HJ, Cruz-Orive LM. Estimation of surface area from vertical sections. J Microsc. 1986;142:259–259. doi: 10.1111/j.1365-2818.1986.tb04282.x. [DOI] [PubMed] [Google Scholar]
- Buesa RJ. Histology without formalin? Ann Diagn Pathol. 2008;12:387–387. doi: 10.1016/j.anndiagpath.2008.07.004. [DOI] [PubMed] [Google Scholar]
- Buschmann WR, Jahss MH, Kummer F, Desai P, Gee RO, Ricci JL. Histology and histomorphometric analysis of the normal and atrophic heel fat pad. Foot Ankle Int. 1995;16:254–258. doi: 10.1177/107110079501600502. [DOI] [PubMed] [Google Scholar]
- Cruz-Orive LM, Weibel ER. Recent stereological methods for cell biology: a brief survey. Am J Physiol. 1990;258:L148–156. doi: 10.1152/ajplung.1990.258.4.L148. [DOI] [PubMed] [Google Scholar]
- Da Costa OT, Pedretti AC, Schmitz A, Perry SF, Fernandes MN. Stereological estimation of surface area and barrier thickness of fish gills in vertical sections. J Microsc. 2007;225:1–1. doi: 10.1111/j.1365-2818.2007.01710.x. [DOI] [PubMed] [Google Scholar]
- Dapson RW. Glyoxal fixation: how it works and why it only occasionally needs antigen retrieval. Biotech & Histochem. 2007;82:161–161. doi: 10.1080/10520290701488113. [DOI] [PubMed] [Google Scholar]
- Ferrando RE, Nyengaard JR, Hays SR, Fahy JV, Woodruff PG. Applying stereology to measure thickness of the basement membrane zone in bronchial biopsy specimens. J Aller Clin Immunol. 2003;112:1243–1245. doi: 10.1016/j.jaci.2003.09.038. [DOI] [PubMed] [Google Scholar]
- Garcia Y, Breen A, Burugapalli K, Dockery P, Pandit A. Stereological methods to assess tissue response for tissue-engineered scaffolds. Biomaterials. 2007;28:175–186. doi: 10.1016/j.biomaterials.2006.08.037. [DOI] [PubMed] [Google Scholar]
- Gundersen HJ, Osterby R. Optimizing sampling efficiency of stereological studies in biology: or ‘do more less well!’. J Microsc. 1981;121:65–65. doi: 10.1111/j.1365-2818.1981.tb01199.x. [DOI] [PubMed] [Google Scholar]
- Jahss MH, Michelson JD, Desai P, Kaye R, Kummer F, Buschman W, Watkins F, Reich S. Investigations into the fat pads of the sole of the foot: anatomy and histology. Foot & Ankle. 1992;13:233–242. doi: 10.1177/107110079201300502. [DOI] [PubMed] [Google Scholar]
- Jensen EB, Gundersen HJ, Osterby R. Determination of membrane thickness distribution from orthogonal intercepts. J Microsc. 1979;115:19–33. doi: 10.1111/j.1365-2818.1979.tb00149.x. [DOI] [PubMed] [Google Scholar]
- Junqueira LCU, Bignolas G, Brentani RR. Picrosirius staining plus polarization microscopy, a specific method for collagen detection in tissue sections. Histochem J. 1979;11:447–455. doi: 10.1007/BF01002772. [DOI] [PubMed] [Google Scholar]
- Kiernan JA. Histological and Histochemical Methods: Theory and Practice. 3. Butterworth Heinemann; Oxford, UK: 1999. pp. 191–209. [Google Scholar]
- Mayhew TM. The new stereological methods for interpreting functional morphology from slices of cells and organs. Exp Physiol. 1991;76:639–639. doi: 10.1113/expphysiol.1991.sp003533. [DOI] [PubMed] [Google Scholar]
- Nyengaard JR, Gundersen HJ. Sampling for stereology in lungs. Eur Respir Rev. 2006;15:107–107. [Google Scholar]
- Starcher B, Aycock RL, Hill CH. Multiple roles for elastic fibers in the skin. J Histochem Cytochem. 2005;53:431–431. doi: 10.1369/jhc.4A6484.2005. [DOI] [PubMed] [Google Scholar]
- Timar F, Soos G, Szende B, Horvath A. Interdigitation index - a parameter for differentiating between young and older skin specimens. Skin Res Technol. 2000;6:17–17. doi: 10.1034/j.1600-0846.2000.006001017.x. [DOI] [PubMed] [Google Scholar]
- Umlas J, Tulecke M. The effects of glyoxal fixation on the histological evaluation of breast specimens. Hum Pathol. 2004;35:1058–1058. doi: 10.1016/j.humpath.2004.04.013. [DOI] [PubMed] [Google Scholar]
- Vincek V, Nassiri M, Nadji M, Morales AR. A tissue fixative that protects macromolecules (DNA, RNA, and protein) and histomorphology in clinical samples. Lab Invest. 2003;83:1427–1427. doi: 10.1097/01.lab.0000090154.55436.d1. [DOI] [PubMed] [Google Scholar]
- Wang Y-N, Lee K, Ledoux WR. Histomorphological evaluation of diabetic and non-diabetic plantar soft tissue. Foot Ankle Internat. 2010 doi: 10.3113/FAI.2011.0802. Submitted. [DOI] [PMC free article] [PubMed] [Google Scholar]