


Abstract
Eukaryotic chromatin is composed of nucleosomes, which contain nearly two coils of DNA wrapped around a central histone octamer. The octamer contains an H3-H4 tetramer and two H2A-H2B dimers. Gene activation is associated with chromatin disruption: a wider nucleosome-depleted region (NDR) at the promoter and reduced nucleosome occupancy over the coding region. Here, we examine the nature of disrupted chromatin after induction, using MNase-seq to map nucleosomes and subnucleosomes, and a refined high-resolution ChIP-seq method to map H4, H2B and RNA polymerase II (Pol II) genome-wide. Over coding regions, induced genes show a differential loss of H2B relative to H4, which correlates with Pol II density and the appearance of subnucleosomes. After induction, Pol II is surprisingly low at the promoter, but accumulates on the gene and downstream of the termination site, implying that dissociation is very slow. Thus, induction-dependent chromatin disruption reflects both eviction of H2A-H2B dimers and the presence of queued Pol II elongation complexes. We propose that slow Pol II dissociation after transcription is a major factor in chromatin disruption and that it may be of critical importance in gene regulation.
INTRODUCTION
The basic subunit of chromatin is the nucleosome core, which contains ∼147 bp of DNA wrapped in ∼1.7 negative superhelical turns around a central core histone octamer (1). The octamer is composed of two molecules each of H3, H4, H2A and H2B. In vitro, nucleosome assembly on DNA by salt-gradient dialysis is a two-step process, involving the initial binding of an (H3-H4)2 tetramer to the DNA, followed by the binding of two H2A-H2B dimers, one on each side of the tetramer, to complete the nucleosome (1,2). The high stability and compact structure of the nucleosome, together with limited DNA accessibility due to steric hindrance by histones, result in inhibition of DNA-dependent processes such as transcription, replication and repair.
The question of how RNA polymerase II (Pol II) negotiates the nucleosome is of particular interest. In vitro, Pol II transcribes through a nucleosome causing the loss of a single H2A-H2B dimer, leaving behind an (H3-H4)2/H2A-H2B hexamer (3). Thus, the passage of polymerase causes partial disassembly of the nucleosome. This effect is exacerbated at high Pol II density, where multiple passages by Pol II result in loss of the entire nucleosome (4). In vivo, various elongation factors remove and replace histones during transcription, resulting in dynamic histone exchange from coding regions and accelerating transit of Pol II through nucleosomes (5–14). Single-gene studies suggest that complete nucleosomes are displaced from highly transcribed genes (11,12). More generally, heavy transcription in vivo correlates with chromatin disruption, both at the promoter and on the gene (15–21). At the promoter, the nucleosome-depleted region (NDR) is wider and deeper, partly due to depletion of upstream nucleosomes. On the coding region, nucleosome occupancy decreases, nucleosomes tend to pack closer together and phasing is disrupted (15–21).
Previously, we have identified a set of genes in budding yeast which exhibit a major change in chromatin structure after induction, involving a loss of nucleosome occupancy across the coding region that can extend into flanking genes (19). These genes represent a subset of the genes that are induced by 3-aminotriazole (3AT), an inhibitor of the enzyme encoded by HIS3, which elicits the starvation response mediated by translational control of the Gcn4 transcriptional activator: GCN4 mRNA is rapidly translated in response to amino acid starvation (22,23). Specific binding of Gcn4 to the promoters of many genes results in activation mediated by various cofactors, including the SWI/SNF chromatin remodeling complex and the SRB/mediator (24). Here, we examine the structural basis of this chromatin disruption by comparing genome-wide maps of nucleosomes and subnucleosomes (defined as histone-containing particles smaller than the core particle) prepared using MNase, with maps of histones and Pol II (prepared using sonication) in untreated and 3AT-induced cells. We show that chromatin disruption reflects a differential loss of H2A-H2B dimers relative to (H3-H4)2 tetramers that correlates with the appearance of subnucleosomes on the coding region and is proportional to Pol II density. Remarkably, the distribution of Pol II is such that it is lowest at the transcription start site (TSS) and highest on the distal coding region and at the 3’-end, where it overshoots the transcript end site (TES) and accumulates, sometimes invading the gene downstream. Thus, Pol II elongation complexes appear to queue up on the gene, waiting to complete transcription and dissociate.
MATERIALS AND METHODS
Yeast strains
The HIS3 gene is required for 3AT induction. YDC111 (MATa ade2–1 can1-100 leu2-3,112 trp1-1 ura3-1) (25) was used for MNase digestion and Pol II experiments. For H4 experiments, YDC439 (W303 MATa ade2–1 leu2-3,112 trp1-1 ura3-1 hht1-hhf1Δ::LEU2 URA3::HHT2-HA-HHF2) was constructed by transformation of BUY815 (a strain carrying a single HA tag at the N-terminus of H4; the gift of Namrita Dhillon and Rohinton Kamakaka) with an EcoRI fragment containing HIS3, as described (25). For H2B experiments, YDC443 (W303 MATa can1-100 his3-11 leu2-3,112 lys2Δ trp1-1 ura3-1 hta2-htb2Δ::TRP1 HA-6His-HTB1::HIS3) was constructed in two steps. Firstly, wild-type strain JRY4012 (26) was transformed with a polymerase chain reaction (PCR) fragment to delete the HTA2-HTB2 locus by replacing it with TRP1, to obtain YDC417. Secondly, YDC417 was transformed with a PacI-EcoRI digest of p676 to integrate a 6-His tag followed by a single HA tag at the N-terminus of H2B, at the HTB1 locus. p676 was obtained by insertion of a 6-His and an HA tag (VSHHHHHHGSMYPYDVPDYAGSM) between the first and second codons of HTB1 in p592 (27). All inserts and tags were verified by PCR analysis and sequencing.
Paired-end sequencing of chromatin immunoprecipitates
YDC111, YDC439 and YDC443 were grown to log-phase either in synthetic complete (SC) medium (untreated) or in SC-histidine followed by induction with 10 mM 3AT (Sigma 61-82-5) for 20 min. Cells were fixed with 1% formaldehyde (15 min at room temperature) and glycine was added to 0.5 M for 5 min. Cells were collected by filter, washed with 20 mM Tris–HCl pH 8.0, 0.15 M NaCl, aliquoted in batches of ∼70 OD600 units and stored at −80°C. The frozen cell pellet was resuspended in 0.5 ml 0.1 M Tris–HCl pH 8.0, 20% (v/v) glycerol with protease inhibitors (Roche 05 056 489 001). An equal volume of glass beads (0.5 mm soda-lime BioSpec 11079105) was added and the cells were vortexed for 40 min at 4°C. The beads were removed, 1 ml FA buffer (50 mM HEPES-K pH 7.5, 0.15 M NaCl, 1 mM NaEDTA, 1% Triton X100, 0.1% Na deoxycholate, with protease inhibitors as above) was added and the lysate was spun for 10 min at 14 000 rpm and 4°C. The pellet was resuspended in 1 ml FA buffer and spun again. The final pellet was resuspended in 0.5 ml FA buffer and sonicated using a Diagenode Bioruptor 300 at 4°C with 40 cycles of 30 s high power and 30 s rest, with a 15-min cooling period after 20 cycles. Debris was removed by spinning for 20 min at 14 000 rpm and 4°C. The supernatant was aliquoted and stored at −80°C. DNA was quantified using the Hoechst assay. For IP, 2.5 μg DNA was adjusted to 250 μl with FA buffer, any insoluble material was removed with a brief spin and the supernatant was added to 30 μl anti-HA agarose (Sigma A2095) that had been washed three times with PBS. Binding was performed in an Eppendorf Thermomixer for 2 h at 1000 rpm and 4°C. The supernatant was removed. The HA-agarose was washed twice with FA buffer and three times with S-RIPA buffer (10 mM Tris–HCl pH 8.0, 0.14 M NaCl, 1% Na-deoxycholate, 1% Triton X100, 0.1% sodium dodecyl sulphate (SDS)) in the Thermomixer (5 min, 1000 rpm, 4°C). Bound DNA was eluted with 50 μl HA-peptide (Roche 11666975001) at 0.1 mg/ml S-RIPA buffer in the Thermomixer (30 min, 1000 rpm, 4°C). The eluate was removed, the elution was repeated, the eluates were pooled and adjusted to 150 μl and ethylenediaminetetraacetic acid (EDTA) was added to 5 mM. Cross-links were reversed by incubation at 65°C overnight, followed by proteinase K digestion (0.25 mg/ml, 5 h, 55°C). The digest was cooled, SDS was added to 1% and mixed, one-fifth volume of 5 M potassium acetate was added, and extracted twice with an equal volume of chloroform. DNA was precipitated with 0.7 volume of isopropanol in the presence of 5 μg glycogen, washed once with 70% ethanol and dissolved in 45 μl TE (10 mM Tris–HCl pH 8.0, 0.1 mM NaEDTA). IP-DNA was repaired as described (28), purified using a Qiagen PCR column and eluted with 50 μl TE. A 5’-phosphate and a 3’-dA were added, followed by the Illumina paired-end adaptor (#1005711) (28). Purified IP-DNA (4 μl) was subjected to PCR (21 cycles) in 50 μl with Illumina paired-end primers (InPE1.0 and InPE2.0) and an index primer at the recommended concentrations (Illumina). DNA was purified using a Qiagen PCR column and its concentration measured by A260 (10–30 μg/ml was in the linear range). Input DNA (∼10 μg) was adjusted to 200 μl with FA buffer and then to 20 mM Tris–HCl pH 8.0 and 5 mM EDTA. Cross-links were reversed as described above. The purified DNA was incubated in 15 μl TE with 0.1 mg RNase/ml for 2 h at 37°C. The volume was adjusted to 50 μl with 0.2 M NaCl in TE. The DNA was eluted from a Qiagen PCR column with 50 μl TE and quantified by A260. Input DNA (0.8 μg) was prepared for paired-end sequencing as above; PCR (17 cycles) was performed according to Illumina, using ∼20 ng input DNA. DNA was purified by Qiagen PCR column and its concentration measured by A260. IP-DNA from YDC111 (no tag control) was prepared for sequencing in parallel, but little final product was obtained (not sequenced). Pol II paired-end sequencing of chromatin immunoprecipitate (PESCI) was performed as described for histones, except that an Rpb3 monoclonal antibody (Neoclone WP012) was bound to Protein A Sepharose beads (GE Healthcare 17-5280-01). For IP, 4 μg anti-Rpb3 was mixed with 30 μl beads (1:1 slurry) for 1 h at room temperature and washed three times with phosphate buffered saline (PBS) containing IgG-free BSA at 5 mg/ml before adding 2.5 (Experiment 1) or 6.25 μg (Experiment 2) DNA, adjusted to 250 μl with FA buffer. Controls without antibody were also done. The IP was performed as above, except for the elution, for which the beads were resuspended in 150 μl 0.14 M NaCl, 50 mM Tris–HCl pH 8, 5 mM Na-EDTA, 0.5% SDS. PCR amplification required ∼30 cycles.
Nucleosome sequencing and data analysis
MNase experiments were carried out as described (28). DNA was prepared for Illumina paired-end sequencing (50 nt reads) and mapped as described (28,29). Occupancy maps were constructed using raw data smoothed using a 21-bp window moving average filter and normalized to the total number of read pairs in the untreated sample. Phasing analysis was performed using custom Perl programs (available on request (30)) combined with TSS and TES data (31). PESCI data were normalized to the genome average of the sample; the IP value at each chromosomal position was then divided by the input value at the same position. Plots of PESCI data for individual genes represent average values for each gene from two biological replicate experiments. Paired-end data are summarized in Supplementary Table S1.
RESULTS
Previously, we mapped nucleosomes genome-wide in yeast cells by digesting nuclei with MNase and subjecting purified core particle DNA to paired-end sequencing, which provides the lengths of all the DNA fragments, after alignment to the yeast genome. Induction by 3AT results in a major loss of nucleosome occupancy from 49 genes, including the well-studied ARG1 gene (19) (Figure 1A). This loss of occupancy occurs over the entire coding region and, in some cases, spreads a significant distance into a flanking gene. We sought to distinguish between three possible explanations: (i) Simple nucleosome loss. In this model, induction results in the complete removal of a large fraction of the nucleosomes on these genes, resulting in stretches of protein-free DNA that are highly accessible to MNase. (ii) Eviction of H2A-H2B dimers from nucleosomes. In this model, (H3-H4)2 tetramers and/or (H3-H4)2/H2A-H2B hexamers remain on the gene after induction, protecting significantly shorter lengths of DNA than the intact nucleosome. (iii) Nucleosomes are conformationally altered after induction, such that their DNA is more accessible and digested faster by MNase. The three models differ in their predictions concerning the effect of induction on the sizes of DNA fragments protected from MNase digestion and which histones are retained or lost. Here we test these predictions, using ARG1 as a specific example and a set of strongly induced genes to obtain a general perspective.
Figure 1.
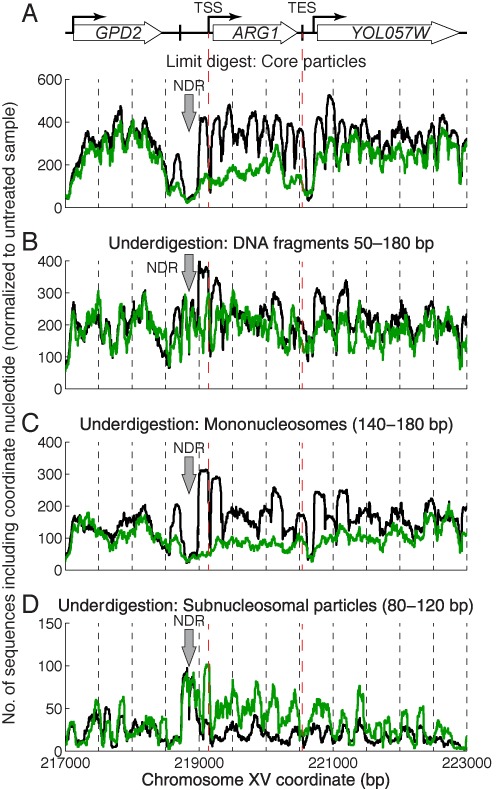
Induction with 3AT correlates with increased levels of subnucleosome-sized particles on the ARG1 coding region. Occupancy maps for untreated (black line) and induced cells (green line). (A) Core particles (limit digest). (B) Underdigested chromatin (50–180 bp fragments). (C) Mononucleosomes (140–180 bp) from underdigested chromatin. (D) Subnucleosomal particles (80–120 bp) from underdigested chromatin. Dashed lines: TSS and TES. Block arrow: NDR.
Increased levels of subnucleosomal particles on induced ARG1
Our nucleosome occupancy maps indicate the distribution and relative levels of canonical nucleosomes, as defined by protection of ∼147 bp from MNase. If other particles are present, protecting different lengths of DNA, they would not be included, because the nucleosomal DNA was gel-purified prior to mapping. The models predict different degrees of MNase sensitivity: nucleosome loss would result in stretches of protein-free DNA and rapid digestion. Loss of H2A-H2B dimers would result in tetrasomes and/or hexasomes, which confer relatively weak protection of ∼80 and ∼110 bp, respectively (2,32). The conformational change model predicts rapid destruction of nucleosomes due to a more accessible structure.
To address this question, we subjected significantly underdigested chromatin from untreated and induced cells to paired-end sequencing without gel purification. These samples displayed a typical nucleosome ladder, with bands corresponding to mono, di and trinucleosomes (Figure 2A). For comparison, we also mapped gel-purified core particle DNA from the same digestion series. The length distributions of the core particle samples showed a major peak at 148 or 149 bp, corresponding to core particles, and a minor peak at 128 bp, corresponding to digestion within the nucleosome (Figure 2B). The underdigested samples gave a strong mononucleosome peak composed of subpeaks at 150, 159 and 166 bp, corresponding to core particles and mononucleosomes with some protruding linker DNA, still present because the relatively slow exonuclease activity of MNase did not have time to remove it. In addition, there were significant amounts of DNA shorter than the core particle, although there were no clearly defined peaks at ∼80 or ∼110 bp perhaps because, like mononucleosomes, tetrasomes and hexasomes have variable amounts of protruding DNA. Given the rapid rate at which MNase digests protein-free DNA relative to chromatin, it is unlikely that these short DNA fragments represent partially digested protein-free DNA.
Figure 2.
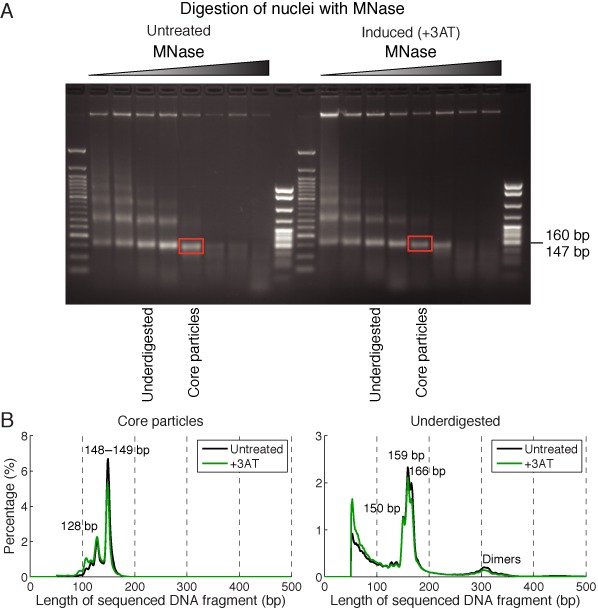
Length distributions of MNase-digested DNA from untreated and 3AT-induced cells. (A) Analysis of DNA extracted from nuclei digested with different amounts of MNase in an agarose gel stained with ethidium bromide. The underdigested samples chosen for analysis represent a compromise between the requirements for preservation of MNase-sensitive particles (short digestion times) and for identifying the particles by their lengths, which is improved by removing protruding linker DNA (longer digestion times). The red box shows where the gel was cut to obtain core particle DNA (MNase limit digest). (B) Lengths of DNA fragments derived from the gel in (A), as determined by paired-end sequencing. The length cut-off at 50 bp reflects the sequence read length of 50 bp.
Nucleosome maps of ARG1 constructed using the core particle data confirmed our previous observations (19): induction resulted in a major loss of occupancy over the entire ARG1 locus, extending both upstream of the NDR at the ARG1 promoter, such that the -1 nucleosome peak was strongly reduced, and downstream of ARG1, into YOL057W, which has no known functional connection to ARG1 (Figure 1A). However, the equivalent occupancy map for underdigested ARG1 obtained using DNA molecules of 50–180 bp showed little loss of occupancy in induced cells (Figure 1B), indicating that the DNA fragments missing from the induced core particle map (Figure 1A) were present in the underdigested sample (Figure 1B). To identify these DNA fragments, we sorted the underdigested samples into mononucleosomes (140–180 bp) and subnucleosomes (80–120 bp, reflecting the expected size range for tetrasomes and hexasomes) in silico. Mononucleosomes gave the same result as core particles (Figure 1C). However, subnucleosomes increased over the ARG1 coding region after induction (Figure 1D). Thus, the loss of canonical nucleosomes from ARG1 after induction can be accounted for by an increase in subnucleosome-sized particles, which might derive from hexasomes and tetrasomes, or from partially digested conformationally altered nucleosomes. It is important to note that particles containing 80–120 bp DNA could be subnucleosomes (tetrasomes and hexasomes), or large non-histone complexes (see below).
The maps also revealed that the NDRs at the ARG1 and YOL057W promoters were occupied in the underdigested samples (Figure 1B). Both NDRs were apparent when only mononucleosomes were considered (Figure 1C), but there were peaks in subnucleosomal DNA fragments (Figure 1D), indicating that particles of subnucleosome size are present at the NDRs, as observed previously (33,34).
Differential loss of H2B relative to H4 from induced genes
The three models make different predictions concerning the histones bound to induced genes: nucleosome removal would result in loss of all four histones, dimer loss predicts loss of H2A and H2B but not of H3 and H4, whereas a conformational change in the nucleosome predicts retention of all four histones. To determine which histones are bound, we performed a modified ChIP-seq (‘Paired-end sequencing of chromatin immunoprecipitates (PESCI)’) experiment using yeast strains with HA-tagged H2B or HA-tagged H4. Untreated and induced cells were fixed with formaldehyde in the usual way and sonicated to obtain short DNA fragments. After immunoprecipitation (IP), the DNA was subjected to paired-end sequencing. Histone occupancy maps can be constructed for direct comparison with those of MNase-digested samples. Furthermore, the resolution of the IP is higher for shorter DNA fragments and can be improved by selection in silico of just the shortest DNA fragments to construct the map. The length distributions of the PESCI inputs and IPs showed that the inputs had peaks at ∼90 bp, with a wide range of DNA fragments from 50 to 500 bp, whereas the IP samples were longer on average, with peaks at ∼125 bp (Supplementary Figure S1). The reason for this difference in average length is unclear, although no difference was observed for the Rpb3 subunit of Pol II (see below). The partially cross-linked nucleosome might be somewhat protected against sonication, although the peak fragment length is well below the size of a nucleosome. There is also uncertainty over whether uncross-linked histones are removed from the DNA in the sonication buffer, which contains a mixture of detergents.
PESCI maps for H4 and H2B at ARG1 constructed using only 50–150 bp fragments showed that there was a major loss of both histones from ARG1 after induction, with a significantly greater loss of H2B than of H4 over the coding region (Figure 3). This observation is consistent with the presence of tetrasomes and/or hexasomes on induced ARG1. Theoretically, the input should give a flat line at average genome coverage because all genomic DNA fragments should be present. This was reasonably true at the ARG1 locus; the variations can be attributed to PCR bias, or to differential sensitivity to sonication. The NDRs were severely depleted of both histones, independently of induction, indicating that these NDRs are histone-free. The -1 nucleosome, located upstream of the ARG1 NDR, was clearly resolved in untreated cells but was depleted of both histones to similar levels after induction. Thus, the -1 nucleosome was removed on induction, resulting in a wider NDR, extended upstream. This is intriguing given that the known regulatory elements—binding sites for the Gcn4 activator and the Arg80 repressor (35)—are located within the narrow NDR that exists prior to induction.
Figure 3.
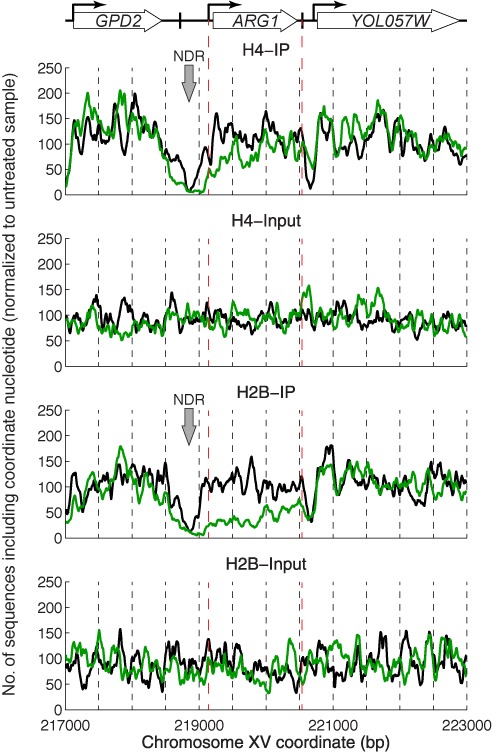
Induction of ARG1 by 3AT results in some loss of H4 and a major loss of H2B over the coding region. PESCI ChIP for H4 and H2B. Occupancy maps constructed using 50–150 bp fragments (normalized to the total aligned read-pair count for untreated cells and smoothed with a 21-bp moving average). Untreated (black line) and induced cells (green line). Inputs are shown in separate panels for clarity.
To determine whether differential loss of H2B relative to H4 was generally true for induced genes, we analyzed our previously reported list of 49 genes with disrupted chromatin structure, measured by loss of core particle occupancy using MNase (19). The average histone occupancy of each gene in untreated cells was compared with its average occupancy in induced cells. Only the three most disrupted genes as measured by the MNase assay were obviously depleted of H4 after induction (YPR036W-A, ICY2 and ARG1) (Figure 4A). The other genes were either unaffected or perhaps slightly depleted of H4. In contrast, most of the 49 genes were substantially depleted of H2B in induced cells (Figure 4B). Differential loss of H2B relative to H4 after induction was clearly demonstrated in plots of H2B occupancy against H4 occupancy for untreated and induced cells (Figure 4C and D). Moreover, H2B occupancy correlated well with the extent of chromatin disruption measured by MNase (Supplementary Figure S2).
Figure 4.
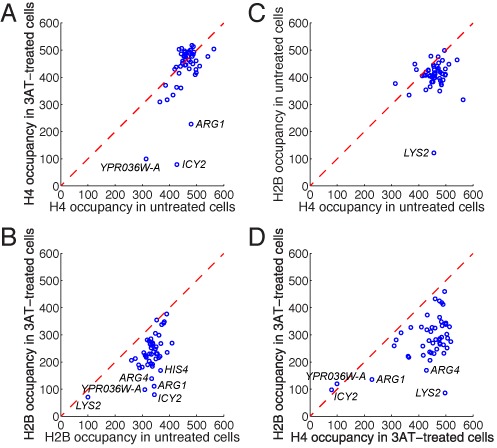
Differential loss of H2B relative to H4 from highly induced genes. Analysis of 49 genes exhibiting major chromatin disruption (19). Average H4 and H2B occupancies were calculated for the coding region of each gene. The average value for each gene obtained from two biological replicate experiments was plotted. (A) H4 occupancy in untreated and induced cells. (B) H2B occupancy in untreated and induced cells. (C) H2B versus H4 occupancy in untreated cells. (D) H2B versus H4 occupancy in induced cells. Dashed line indicates no change in occupancy. Note: LYS2 is low in the HA-H2B strain because part of the gene is deleted (lys2Δ).
In conclusion, our histone PESCI experiments indicate that H2B is differentially lost from induced genes, suggesting that many nucleosomes have lost one or both of their H2A-H2B dimers. The fact that a few genes are also depleted of some H4 indicates that some nucleosomes are completely removed from these genes. Thus, some complete nucleosomes (H4 loss) and more H2A-H2B dimers are lost from ARG1, ICY2 and YPR036W-A after induction, but most induced genes show significant loss of H2B only.
Queued polymerases on induced genes
The role of Pol II in chromatin disruption was addressed by PESCI using an antibody against the Rpb3 subunit. The length distributions for inputs and IPs were almost identical, with a peak at ∼100 bp and ranging from 50 to 500 bp (Supplementary Figure S3A). Induction resulted in a huge increase in the amount of Pol II bound to the ARG1 coding region (Figure 5A). In contrast, there was relatively little Pol II at the ARG1 TSS. Furthermore, Pol II was very high even downstream of the ARG1 TES, suggesting that Pol II overshot the TES and invaded YOL057W. This overshoot was not due to long DNA fragments in the IP, because the Pol II peak extends up to ∼350 bp downstream of the ARG1 TES and the map is composed of 50–150 bp fragments.
Figure 5.
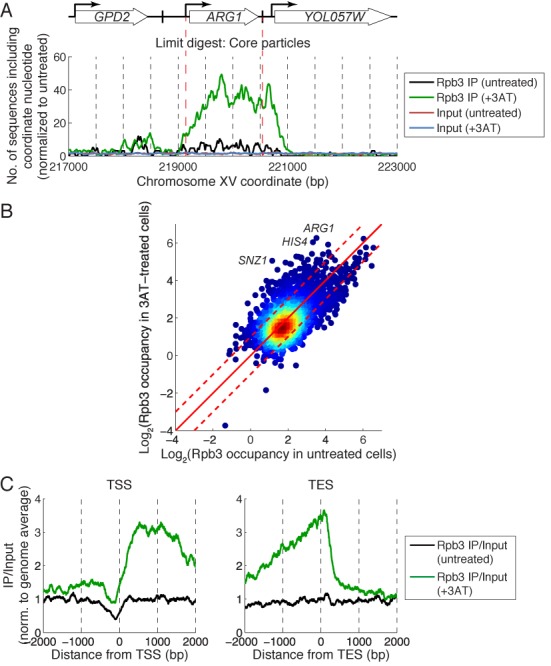
Pol II accumulates at the 3′-ends of induced genes. PESCI for the Rpb3 subunit. (A) Pol II occupancy map for ARG1 constructed using 50–150 bp fragments. (B) Global analysis of average Pol II occupancy on the coding region in untreated and induced cells for 4145 genes. The value for each gene is the average of two biological replicate experiments (Pearson correlation coefficients for the replicates were 0.94 for both untreated cells and induced cells). Individual genes are marked by blue circles; the coloring indicates increased density of spots (red is maximum). The data are plotted on a log2 scale; red dashed lines represent 2-fold change. Two hundred seventy-two genes were activated > 2-fold by 3AT. (C) Distribution of Pol II relative to the TSS and TES for 244 genes induced > 2-fold and longer than 500 bp.
An alternative explanation for the Pol II peak at the YOL057W promoter is that it represents Pol II waiting to transcribe YOL057W, but this is unlikely because the peak was not present in untreated cells. Another interpretation is that the overshoot peak represents paused Pol II ready to transcribe the ARG1 anti-sense transcript, which is initiated in the 3’-UTR (36). This possibility is more difficult to rule out, but the same observations were true of HIS4, another gene strongly induced by 3AT (Supplementary Figure S3B), which has no anti-sense transcript (37). Instead, we propose that the Pol II overshoot peak represents Pol II waiting to dissociate from the DNA and that dissociation is rate-limiting for transcription of ARG1 and HIS4.
To determine the generality of our observations for ARG1 and HIS4, we identified strongly induced genes by comparing the average Pol II occupancy on the coding regions of all genes in untreated and induced cells (Figure 5B). In induced cells, ARG1 was actually the most heavily transcribed gene, and HIS4 was also very heavily transcribed. Of the 49 genes that show reduced nucleosome occupancy after induction (>25% loss) mentioned above (19), 35 have associated TSS/TES data (31); 28 of these 35 (80%) were induced >2-fold (defined by increased Rpb3 occupancy between the TSS and the TES). We analyzed the Pol II distribution on the 244 genes that were induced >2-fold (above the upper dashed line in Figure 5B) with coding regions >500 bp (Figure 5C). Relative to the TSS, the level of Pol II at the promoter was low and increased to a high plateau over distal coding regions in induced cells. Relative to the TES, the level of Pol II was high over the distal coding region, there was a slight decrease near the TES itself and an overshoot peak ∼140 bp downstream of the TES in induced cells. The implication is that Pol II elongation complexes upstream of the TES are queued, waiting for the terminating Pol II to dissociate.
High Pol II density correlates with differential loss of H2B
The relationship between high levels of transcription and loss of H2A-H2B dimers was addressed by correlating the occupancy levels of H4 and H2B with those of Pol II on induced genes. There was no correlation between the levels of H4 and Pol II in untreated or induced cells, with little loss of H4 from any induced genes except ARG1 (Figure 6A). This was also true for H2B in untreated cells, because induced genes are not heavily transcribed in the absence of 3AT. In contrast, there was a strong inverse correlation between H2B and Pol II levels in induced cells (Figure 6A). Thus, Pol II density correlates with loss of H2A-H2B dimers.
Figure 6.
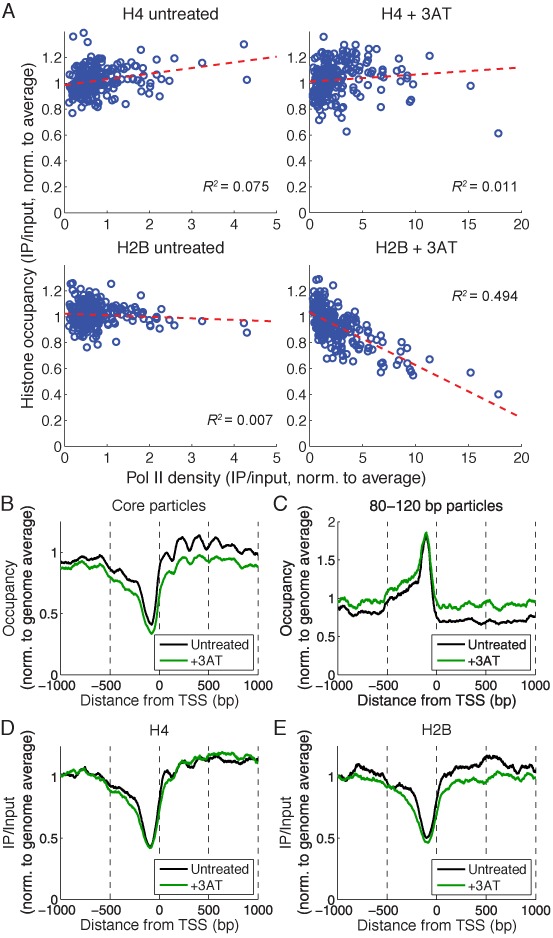
Pol II density correlates with differential loss of H2B from induced genes. (A) Strong inverse correlation between Pol II and H2B levels on 244 genes induced by 3AT > 2-fold and longer than 500 bp (ICY2 and YPR036W-A are shorter than 500 bp and are therefore not included). Occupancy phasing analysis on the induced genes relative to the TSS: (B) Nucleosome core particles (140–160 bp). (C) 80–120 bp particles in underdigested chromatin. (D) H4 (50–150 bp fragments). (E) H2B (50–150 bp fragments).
Analysis of nucleosome phasing on induced genes revealed substantial 3AT-dependent disruption on both sides of the TSS, with reduced core particle signal consistent with loss of nucleosomes from these genes (Figure 6B), as observed previously (20). Increased levels of 80–120 bp particles were present in the NDR and upstream of the NDR (Figure 6C). If inverted, the shape of the 80–120 bp particle peak is an approximate match for the shape of the NDR (Figure 6B), implying that these particles fill the NDR. A similar analysis of H4 occupancy revealed H4 phasing in untreated cells (Figure 6D), providing confirmation of nucleosome phasing independent of MNase. H4 phasing was weaker in induced cells, with a slight reduction in the +1 nucleosome and a slight expansion of the NDR upstream, as observed for core particles (Figure 6B). However, unlike core particles, there was little loss of H4 over the coding region. In contrast, H2B occupancy was significantly reduced over the coding region (P-value < 0.001, Welch's t-test) and upstream in induced cells (Figure 6E). Thus, H2B occupancy correlates more precisely with core particle occupancy than H4, as expected if there is a differential loss of H2A-H2B dimers, resulting in disassembly of core particles. In untreated cells, the much weaker phasing of H2B relative to H4 might reflect the fact that the two H2B molecules in a nucleosome are farther apart than the two H4 molecules, resulting in a broader signal (clear phasing of H2B was observed using dyad phasing analysis, which has higher resolution; see below). Finally, both H4 and H2B (Figure 6D and E) showed a trough at the NDR similar to that observed for core particles (Figure 6B), with no peak corresponding to the subnucleosomal particles (Figure 6C), indicating that the 80–120 bp particles in these NDRs do not contain H4 or H2B and are therefore non-histone complexes.
Heavily transcribed genes also show differential loss of H2B and queued polymerases
We have shown that, for induced genes, Pol II density correlates with loss of H2B (Figure 6). Is this effect peculiar to genes induced by 3AT, or is it a general property of heavily transcribed genes? We constructed scatter plots to compare the average H2B occupancy of a gene with its average H4 occupancy in untreated cells (Figure 7A) and in induced cells (Figure 7B). Most, but not all, of the genes had occupancies close to the normalized average value of 1. The histone occupancy values of the 244 inducible genes in untreated cells were superimposed on the scatter plot for untreated cells (compare Figure 7C with Figure 7A): these genes show a distribution of values similar to that for all genes, as expected, because most of them are poorly transcribed in the absence of 3AT. For comparison, the histone occupancy values of the 244 induced genes in induced cells were superimposed on the scatter plot for induced cells (compare Figure 7D with Figure 7B): many induced genes shift to lower H2B occupancy and a few also show lower H4 occupancy. Some genes show little shift (as in Figure 6A), most likely because a high level of induction does not necessarily result in a high level of transcription: a gene can be strongly induced but still only transcribed at moderate levels. Consequently, we examined heavily transcribed genes in both untreated and induced cells. We identified the 250 genes with the highest Pol II density in untreated cells and in induced cells; 123 genes appeared in both lists (49%), indicating that they are heavily transcribed independently of 3AT. Their histone occupancy values were superimposed on the scatter plots for untreated and induced cells (compare Figure 7E with 7A and Figure 7F with 7B). In both cases, it is clear that heavily transcribed genes tend to be depleted of H2B and a few genes also show some loss of H4. This differential loss of H2B from heavily transcribed genes in both untreated and induced cells was confirmed by plots of average histone occupancy against average Pol II density (Supplementary Figure S4; compare with Figure 6A). Thus, like 3AT-induced genes, heavily transcribed genes exhibit a differential loss of H2B relative to H4, reinforcing the correlation between Pol II density and H2B loss.
Figure 7.
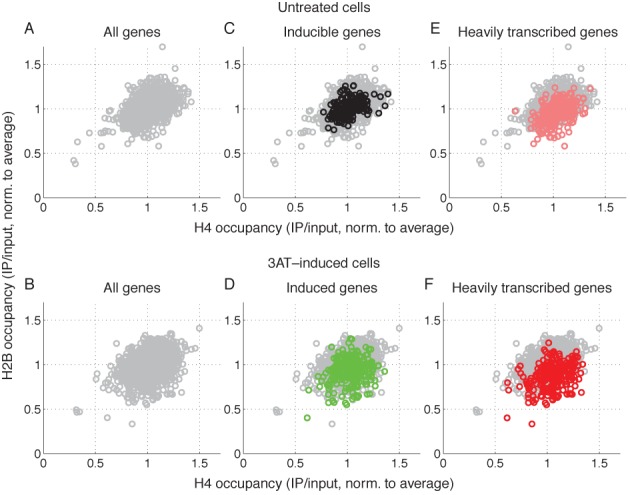
Heavily transcribed genes show reduced levels of H2B relative to H4. Scatter plots comparing H2B occupancy with H4 occupancy for all genes longer than 500 bp: (A) Untreated cells; (B) 3AT-induced cells; (C) As in (A), but with the 244 inducible genes (black circles) superimposed on the plot for all genes (gray circles); (D) As in (B), but with the 244 3AT-induced genes superimposed (green circles); (E) As in (A), but with the 250 most heavily transcribed genes in untreated cells superimposed (red circles); (F) As in (B), but with the 250 most heavily transcribed genes in 3AT-induced cells superimposed (red circles).
We also asked whether the two surprising characteristics of the Pol II distribution—low levels at the promoter and high levels post-TES—are properties of heavily transcribed genes, or whether they are peculiar to 3AT-induced genes. For both untreated and induced cells, all genes were sorted according to their Pol II density and then divided into quintiles, such that the first quintile contained the most transcribed genes and the last quintile contained the least transcribed genes. The distribution of Pol II relative to the TSS or the TES was then calculated as an IP/input ratio (Supplementary Figure S5). As observed for induced genes (Figure 5C), the most heavily transcribed genes (quintile 1) in both untreated and induced cells, showed the lowest Pol II levels at promoters (TSS plots) and the highest levels on both sides of the TES, with significant overshoot (TES plots). The amount of Pol II on the genes in the other quintiles is much lower than for quintile 1, although the plots are in the order expected from the sort. The disproportionate genomic distribution of Pol II has been commented on previously (38). We conclude that our observations for induced genes are generally true for heavily transcribed genes.
In addition, we asked whether the chromatin structure of TATA box-containing genes (regulated by the SAGA complex and mostly inducible) is different from that of genes lacking TATA boxes (regulated by TFIID and mostly constitutively expressed) (39). On average, TATA-containing genes displayed the characteristics of highly active genes: high Pol II over the coding region and around the TES, a wider NDR and weaker phasing, and a slight decrease in H2B relative to H4 (Supplementary Figure S6). These observations can be explained by the fact that TATA-containing genes are enriched for highly transcribed genes relative to TATA-less genes (23% of the TATA-containing genes are in the most highly transcribed gene quintile (see Supplementary Figure S5); only 10% of the TATA-less genes are present in this quintile). Consequently, the difference in chromatin structure between TATA-containing and TATA-less genes can be accounted for by the fact that TATA-containing genes have a higher proportion of heavily transcribed genes.
DISCUSSION
Induced genes show differential loss of H2B from coding regions
Our initial aim was to understand the structural basis of the loss of nucleosome occupancy from genes induced by 3AT. We considered three models: loss of complete nucleosomes, loss of H2A-H2B dimers or a conformational change. At induced ARG1, we observed an increase in particles of subnucleosomal size, reduced H4 and a larger reduction in H2B (Figure 8A). These observations are consistent with a limited loss of complete nucleosomes (reduced H4 and H2B) and loss of H2A-H2B from some of the remaining nucleosomes (greater loss of H2B), resulting in tetrasomes and/or hexasomes. Thus, our data support a combination of the first two models for ARG1 and a few other very heavily transcribed genes. However, genes with somewhat lower Pol II density exhibit a major loss of H2B but not of H4, indicating that H2A-H2B dimer loss is predominant. The disturbance of the chromatin structure of flanking genes can be explained by expansion of the NDR upstream of the induced gene and by invasion of the downstream gene by Pol II prior to dissociation.
Figure 8.
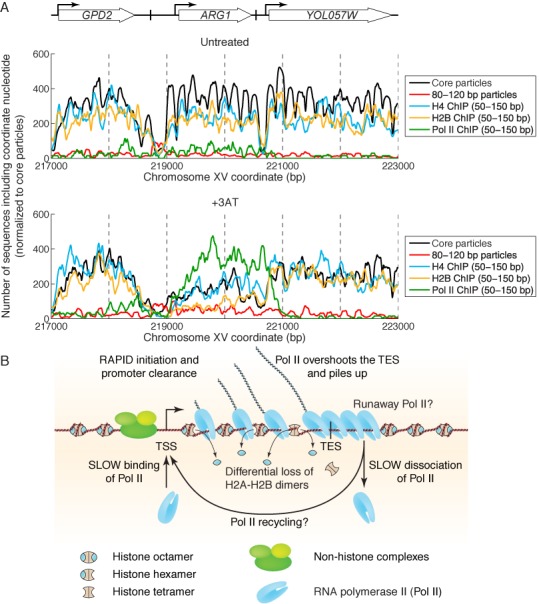
Chromatin structure of a heavily transcribed gene. (A) Summary of data for the ARG1 locus in untreated and induced cells: core particles, 80–120 bp particles, H4, H2B and Pol II. All data were normalized to the number of sequences obtained for untreated core particles and smoothed using a 21-bp moving average. (B) Model: The NDR is expanded upstream to accommodate additional non-histone complexes (both H4 and H2B are partially lost). Pol II binds near the TSS and clears the promoter rapidly (low Pol II at the TSS). Pol II levels over the remainder of the gene are high and coincide with some loss of H4 and heavy loss of H2B, resulting in subnucleosomal particles (tetrasomes and hexasomes). Pol II overshoots the TES and accumulates ∼140 bp downstream, sometimes farther (‘runaway’ Pol II). Accumulation of Pol II downstream of the TES implies that dissociation from DNA is relatively slow, such that more Pol II queues up behind it. Slow dissociation might facilitate transfer of Pol II back to the promoter (‘recycling’), increasing the transcription rate.
Increased levels of subnucleosome-sized particles over the coding regions of induced genes are consistent with tetrasomes and/or hexasomes but when considered alone, do not prove that they are present. This is because they confer weaker protection from MNase than complete nucleosomes and so must be detected in underdigested samples, in which protruding linker DNA has not yet been removed from the particles by MNase, making it difficult to be certain that they protect the characteristic lengths of DNA (∼80 and ∼110 bp). Indeed, alternative interpretations are that the shorter protected DNA fragments derive from internal digestion of intact nucleosomes, or from stable non-histone complexes. However, our histone-PESCI data show that there are higher levels of H4 than of H2B on coding regions, leading to the conclusion that some particles must lack one or both of their H2A-H2B dimers. It should be noted that the tetrasomes and hexasomes are not necessarily compact; they might be unfolded. In addition, we cannot distinguish between the conventional tetrasome, which contains negatively wrapped DNA, and the reversome (40), which contains positively wrapped DNA, because both are compact and should protect similar lengths of DNA from digestion.
Our data are consistent with a genome-wide tiling-array study (13) showing a similar, limited loss of H4 from coding regions that correlates with transcription level (neither H2A nor H2B was measured in this study). ChIP studies of the active yeast GAL genes indicate that both H2B and H4 are reduced to similar levels on the coding regions, suggesting that complete nucleosome displacement occurs (6,11,12). However, we observe a greater loss of H2B relative to H4. The fact that this differential loss is not observed at the GAL genes might reflect their extreme activity in galactose, such that complete nucleosome loss is predominant. In conclusion, we have demonstrated that loss of H2A-H2B dimers, not complete nucleosome loss, is the predominant consequence of transcription.
The disruption of the coding region chromatin that we observe on heavily transcribed genes can be accounted for by in vitro experiments showing that a single passage through a nucleosome by Pol II results in displacement of one H2A-H2B dimer, whereas multiple passages, expected at high Pol II density, result in complete nucleosome loss (3,4). Consistent with this, exogenous RNA polymerase II preferentially displaces H2A-H2B dimers from nucleosome core particles derived from active genes (41). Our observation that genes with lower Pol II density show proportionately reduced H2B loss and only marginal loss of H4 is consistent with this scenario. In vivo, exchange of all four histones occurs at highly transcribed genes (7–9), indicating that nucleosomes are not just disassembled on active genes but are also re-assembled. Histone exchange occurs most often at promoters but also happens on coding regions, facilitated by elongation factors, histone chaperones and histone acetylation (5–7,10,11,42). Exchange of H2A and H2B is much more rapid than that of H3 and H4 (43,44), consistent with our observation that much more H2B is displaced than H4. The fact that we can detect subnucleosomes on active coding regions indicates that re-assembly of H2A-H2B dimers into nucleosomes is relatively slow. The molecular mechanism by which dimers are replaced in vivo is unclear, but is likely to involve histone chaperones, Spt6 and/or the FACT complex (reviewed in ref. 21).
Slow dissociation after transcription results in queued polymerases
Transcription involves several steps: recruitment of Pol II to form a ‘closed’ preinitiation complex (PIC), melting of promoter DNA to form the ‘open’ initiation complex, initiation, a conformational change to form a stable elongation complex, elongation and perhaps pausing, termination and dissociation. The paradigm for transcriptional regulation has been that initiation is the slowest step and therefore the natural target for regulation (45). More recently, it was discovered that many genes in higher eukaryotes are associated with a Pol II elongation complex paused in the vicinity of the +1 nucleosome (46). Single-gene studies in higher eukaryotes show that, on some genes, Pol II overshoots the TES and pauses several hundred base pairs downstream, where it binds mRNA processing factors prior to termination (47). Genome-wide, the distribution of Pol II on higher eukaryotic genes is consistent with these studies, showing a large Pol II peak around the TSS and relatively low Pol II levels along the gene (48,49). A small subset of genes exhibits a strong peak in the termination region, but there are no queued polymerases (48,49).
In yeast, relatively low-resolution ChIP-on-chip studies have demonstrated the expected correlation between the amount of Pol II on coding regions and mRNA levels (50). More recently, higher resolution microarray studies have shown that some highly transcribed genes accumulate Pol II downstream of the TES, which could reflect either slow dissociation or anti-sense transcription (38,51,52). Our high-resolution Pol II PESCI data extend and clarify these findings, by examining the effect of induction on Pol II distribution, rather than by correlation with expression data. Surprisingly, we find that the lowest level of Pol II is at the TSS, suggesting that initiation is not rate-limiting. However, if Pol II promoter binding is very slow, rapid initiation and promoter clearance might be important, making the promoter immediately available to bind another Pol II. The fact that Pol II is not in direct contact with DNA in the initial form of the PIC (53) should also be considered, since it might result in inefficient cross-linking of Pol II to DNA and underestimate the amount of Pol II bound at the promoter. The highest levels of Pol II occur just upstream of the TES and ∼140 bp downstream of the TES, indicating that Pol II overshoots the TES and is slow to dissociate from the DNA. It will be important to examine whether Pol II binding downstream of the TES is functional, perhaps by demonstrating the presence of the melted DNA indicative of open complex formation.
In summary, we propose that Pol II dissociation is the slowest step in transcription of heavily transcribed genes. The delay in dissociation results in a queue of polymerases on the gene, waiting to complete transcription and then dissociate in turn. It is likely that this polymerase queue contributes to chromatin disruption, because Pol II is a large complex and physically occupies more DNA than a typical linker in yeast: either each polymerase is paused within a disrupted nucleosome, or some nucleosomes must be partially or completely removed in order to accommodate it (Figure 8B).
ACCESSION NUMBERS
GEO database GSE54524.
SUPPLEMENTARY DATA
Supplementary Data are available at NAR Online.
Acknowledgments
We thank Gary Felsenfeld, Alan Hinnebusch, Vasily Studitsky and Carl Wu for helpful comments on the manuscript. We thank the NHLBI Core Facility (Yoshi Wakabayashi, Yan Luo, Ting Ni and Jun Zhu) for paired-end sequencing, Namrita Dhillon and Rohinton Kamakaka for yeast strains with HA-tagged H4 and H2B, and Bruce Howard and Nguyet Dang for help with bioinformatic analysis.
FUNDING
Intramural Research Program of the National Institutes of Health (NICHD). Funding for open access charge: Intramural Research program of the National Institutes of Health (NICHD).
Conflict of interest statement. None declared.
REFERENCES
- 1.Luger K., Mäder A.W., Richmond R.K., Sargent D.F., Richmond T.J. Crystal structure of the nucleosome core particle at 2.8 Å resolution. Nature. 1997;389:251–260. doi: 10.1038/38444. [DOI] [PubMed] [Google Scholar]
- 2.Camerini-Otero R.D., Sollner-Webb B., Felsenfeld G. The organization of histones and DNA in chromatin: evidence for an arginine-rich histone kernel. Cell. 1976;8:333–347. doi: 10.1016/0092-8674(76)90145-8. [DOI] [PubMed] [Google Scholar]
- 3.Kireeva M.L., Walter W., Tchernajenko V., Bondarenko V., Kashlev M., Studitsky V.M. Nucleosome remodeling induced by RNA polymerase II: loss of the H2A/H2B dimer during transcription. Mol. Cell. 2002;9:541–552. doi: 10.1016/s1097-2765(02)00472-0. [DOI] [PubMed] [Google Scholar]
- 4.Kulaeva O.I., Hsieh F., Studitsky V.M. RNA polymerase complexes cooperate to relieve the nucleosomal barrier and evict histones. Proc. Natl Acad. Sci. U.S.A. 2010;107:11325–11330. doi: 10.1073/pnas.1001148107. [DOI] [PMC free article] [PubMed] [Google Scholar]
- 5.Kaplan C.D., Laprade L., Winston F. Transcription elongation factors repress transcription initiation from cryptic sites. Science. 2003;301:1096–1099. doi: 10.1126/science.1087374. [DOI] [PubMed] [Google Scholar]
- 6.Schwabish M.A., Struhl K. Asf1 mediates histone eviction and deposition during elongation by RNA polymerase II. Mol. Cell. 2006;22:415–422. doi: 10.1016/j.molcel.2006.03.014. [DOI] [PubMed] [Google Scholar]
- 7.Rufiange A., Jacques P.E., Bhat W., Robert F., Nourani A. Genome-wide replication-independent histone H3 exchange occurs predominantly at promoters and implicates H3 K56 acetylation and Asf1. Mol. Cell. 2007;27:393–405. doi: 10.1016/j.molcel.2007.07.011. [DOI] [PubMed] [Google Scholar]
- 8.Dion M.F., Kaplan T., Kim M., Buratowski S., Friedman N., Rando O.J. Dynamics of replication-independent histone turnover in budding yeast. Science. 2007;315:1405–1408. doi: 10.1126/science.1134053. [DOI] [PubMed] [Google Scholar]
- 9.Jamai A., Imoberdorf R.M., Strubin M. Continuous histone H2B and transcription-dependent histone H3 exchange in yeast cells outside of replication. Mol. Cell. 2007;25:345–355. doi: 10.1016/j.molcel.2007.01.019. [DOI] [PubMed] [Google Scholar]
- 10.Jamai A., Puglisi A., Strubin M. Histone chaperone Spt16 promotes redeposition of the original H3–H4 histones evicted by elongating RNA polymerase. Mol. Cell. 2009;35:377–383. doi: 10.1016/j.molcel.2009.07.001. [DOI] [PubMed] [Google Scholar]
- 11.Schwabish M.A., Struhl K. Evidence for eviction and rapid deposition of histones upon transcriptional elongation by RNA polymerase II. Mol. Cell. Biol. 2004;24:10111–10117. doi: 10.1128/MCB.24.23.10111-10117.2004. [DOI] [PMC free article] [PubMed] [Google Scholar]
- 12.Kristjuhan A., Svejstrup J.Q. Evidence for distinct mechanisms facilitating transcript elongation through chromatin in vivo. EMBO J. 2004;23:4243–4252. doi: 10.1038/sj.emboj.7600433. [DOI] [PMC free article] [PubMed] [Google Scholar]
- 13.Lee C.K., Shibata Y., Rao B., Strahl B.D., Lieb J.D. Evidence for nucleosome depletion at active regulatory regions genome-wide. Nat. Genet. 2004;36:900–905. doi: 10.1038/ng1400. [DOI] [PubMed] [Google Scholar]
- 14.Boeger H., Griesenbeck J., Strattan J.S., Kornberg R.D. Removal of promoter nucleosomes by disassembly rather than sliding in vivo. Mol. Cell. 2004;14:667–673. doi: 10.1016/j.molcel.2004.05.013. [DOI] [PubMed] [Google Scholar]
- 15.Field Y., Kaplan N., Fondufe-Mittendorf Y., Moore I.K., Sharon E., Lubling Y., Widom J., Segal E. Distinct modes of regulation by chromatin encoded through nucleosome positioning signals. PLoS Comp. Biol. 2008;4:e1000216. doi: 10.1371/journal.pcbi.1000216. [DOI] [PMC free article] [PubMed] [Google Scholar]
- 16.Shivaswamy S., Bhinge A., Zhao Y., Jones S., Hirst M., Iyer V.R. Dynamic remodeling of individual nucleosomes across a eukaryotic genome in response to transcriptional perturbation. PLoS Biol. 2008;6:e65. doi: 10.1371/journal.pbio.0060065. [DOI] [PMC free article] [PubMed] [Google Scholar]
- 17.Zawadzki K.A., Morozov A.V., Broach J.R. Chromatin-dependent transcription factor accessibility rather than nucleosome remodeling predominates during global transcriptional restructuring in Saccharomyces cerevisiae. Mol. Biol. Cell. 2009;20:3503–3513. doi: 10.1091/mbc.E09-02-0111. [DOI] [PMC free article] [PubMed] [Google Scholar]
- 18.Weiner A., Hughes A., Yassour M., Rando O.J., Friedman N. High-resolution nucleosome mapping reveals transcription-dependent promoter packaging. Genome Res. 2010;20:90–100. doi: 10.1101/gr.098509.109. [DOI] [PMC free article] [PubMed] [Google Scholar]
- 19.Cole H.A., Howard B.H., Clark D.J. Activation-induced disruption of nucleosome position clusters on the coding regions of Gcn4-dependent genes extends into neighbouring genes. Nucleic Acids Res. 2011;39:9521–9535. doi: 10.1093/nar/gkr643. [DOI] [PMC free article] [PubMed] [Google Scholar]
- 20.Cui F., Cole H.A., Clark D.J., Zhurkin V.B. Transcriptional activation of yeast genes disrupts intragenic nucleosome phasing. Nucleic Acids Res. 2012;40:10753–10764. doi: 10.1093/nar/gks870. [DOI] [PMC free article] [PubMed] [Google Scholar]
- 21.Rando O.J., Winston F. Chromatin and transcription in yeast. Genetics. 2012;190:351–387. doi: 10.1534/genetics.111.132266. [DOI] [PMC free article] [PubMed] [Google Scholar]
- 22.Natarajan K., Meyer M.R., Jackson B.M., Slade D., Roberts C., Hinnebusch A.G., Marton M.J. Transcriptional profiling shows that Gcn4p is a master regulator of gene expression during amino acid starvation in yeast. Mol. Cell. Biol. 2001;21:4347–4368. doi: 10.1128/MCB.21.13.4347-4368.2001. [DOI] [PMC free article] [PubMed] [Google Scholar]
- 23.Hinnebusch A.G., Natarajan K. Gcn4, a master regulator of gene expression, is controlled at multiple levels by diverse signals of starvation and stress. Eukaryot Cell. 2002;1:22–32. doi: 10.1128/EC.01.1.22-32.2002. [DOI] [PMC free article] [PubMed] [Google Scholar]
- 24.Natarajan K., Jackson B.M., Zhou H., Winston F., Hinnebusch A.G. Transcriptional activation by Gcn4 involves independent interactions with the SWI/SNF complex and the SRB/mediator. Mol. Cell. 2001;4:657–664. doi: 10.1016/s1097-2765(00)80217-8. [DOI] [PubMed] [Google Scholar]
- 25.Kim Y., McLaughlin N., Lindstrom K., Tsukiyama T., Clark D.J. Activation of Saccharomyces cerevisiae HIS3 results in Gcn4p-dependent, SWI/SNF-dependent mobilization of nucleosomes over the entire gene. Mol. Cell. Biol. 2006;26:8607–8622. doi: 10.1128/MCB.00678-06. [DOI] [PMC free article] [PubMed] [Google Scholar]
- 26.Nagarajavel V., Iben J.R., Howard B.H., Maraia R.J., Clark D.J. Global ‘bootprinting’ reveals the elastic architecture of the yeast TFIIIB-TFIIIC transcription complex in vivo. Nucleic Acids Res. 2013;41:8135–8143. doi: 10.1093/nar/gkt611. [DOI] [PMC free article] [PubMed] [Google Scholar]
- 27.Eriksson P.R., Ganguli D., Clark D.J. Spt10 and Swi4 control the timing of histone H2A/H2B gene activation in budding yeast. Mol. Cell. Biol. 2011;31:557–572. doi: 10.1128/MCB.00909-10. [DOI] [PMC free article] [PubMed] [Google Scholar]
- 28.Cole H.A., Howard B.H., Clark D.J. Genome-wide mapping of nucleosomes in yeast using paired-end sequencing. Methods Enzymol. 2012;513:145–168. doi: 10.1016/B978-0-12-391938-0.00006-9. [DOI] [PubMed] [Google Scholar]
- 29.Cole H.A., Howard B.H., Clark D.J. The centromeric nucleosome of budding yeast is perfectly positioned and covers the entire centromere. Proc. Natl Acad. Sci. U.S.A. 2011;108:12687–12692. doi: 10.1073/pnas.1104978108. [DOI] [PMC free article] [PubMed] [Google Scholar]
- 30.Ganguli D., Chereji R.V., Iben J.R., Cole H.A., Clark D.J. RSC-dependent constructive and destructive interference between opposing arrays of phased nucleosomes in yeast. Genome Res. 2014;24:1637–1649. doi: 10.1101/gr.177014.114. [DOI] [PMC free article] [PubMed] [Google Scholar]
- 31.David L., Huber W., Granovskaia M., Toedling J., Palm C.J., Bofkin L., Jones T., Davis R.W., Steinmetz L.M. A high-resolution map of transcription in the yeast genome. Proc. Natl Acad. Sci. U.S.A. 2006;103:5320–5325. doi: 10.1073/pnas.0601091103. [DOI] [PMC free article] [PubMed] [Google Scholar]
- 32.Studitsky V.M., Clark D.J., Felsenfeld G. A histone octamer can step around a transcribing polymerase without leaving the template. Cell. 1994;76:371–382. doi: 10.1016/0092-8674(94)90343-3. [DOI] [PubMed] [Google Scholar]
- 33.Kent N.A., Adams S., Moorhouse A., Paszkiewicz K. Chromatin particle analysis: a method for comparative chromatin structure analysis using paired-end mode next-generation DNA sequencing. Nucleic Acids Res. 2011;39:e26. doi: 10.1093/nar/gkq1183. [DOI] [PMC free article] [PubMed] [Google Scholar]
- 34.Henikoff J.G., Belsky J.A., Krassovsky K., MacAlpine D.M., Henikoff S. Epigenome characterization at single base-pair resolution. Proc. Natl Acad. Sci. U.S.A. 2011;108:18318–18323. doi: 10.1073/pnas.1110731108. [DOI] [PMC free article] [PubMed] [Google Scholar]
- 35.Yoon S., Hinnebusch A.G. Mcm1p binding sites in ARG1 positively regulate Gcn4p binding and SWI/SNF recruitment. Biochem. Biophys. Res. Commun. 2009;381:123–128. doi: 10.1016/j.bbrc.2009.02.045. [DOI] [PMC free article] [PubMed] [Google Scholar]
- 36.Crisucci E.M., Arndt K.M. Paf1 restricts Gcn4 occupancy and antisense transcription at the ARG1 promoter. Mol. Cell. Biol. 2012;32:1150–1163. doi: 10.1128/MCB.06262-11. [DOI] [PMC free article] [PubMed] [Google Scholar]
- 37.Yassour M., Pfiffner J., Levin J.Z., Adiconis X., Gnirke A., Nusbaum C., Thompson D., Friedman N., Regev A. Strand-specific RNA sequencing reveals extensive regulated long antisense transcripts that are conserved across yeast species. Genome Biol. 2010;11:R87. doi: 10.1186/gb-2010-11-8-r87. [DOI] [PMC free article] [PubMed] [Google Scholar]
- 38.Venters B.J., Pugh B.F. A canonical promoter organization of the transcription machinery and its regulators in the Saccharomyces genome. Genome Res. 2009;19:360–371. doi: 10.1101/gr.084970.108. [DOI] [PMC free article] [PubMed] [Google Scholar]
- 39.Basehoar A.D., Zanton S.J., Pugh P.F. Identification and distinct regulation of yeast TATA box-containing genes. Cell. 2004;116:699–709. doi: 10.1016/s0092-8674(04)00205-3. [DOI] [PubMed] [Google Scholar]
- 40.Lavelle C., Prunell A. Chromatin polymorphism and the nucleosome superfamily. Cell Cycle. 2007;6:2113–2119. doi: 10.4161/cc.6.17.4631. [DOI] [PubMed] [Google Scholar]
- 41.Baer B.W., Rhodes D. Eukaryotic RNA polymerase II binds to nucleosome cores from transcribed genes. Nature. 1983;301:482–488. doi: 10.1038/301482a0. [DOI] [PubMed] [Google Scholar]
- 42.Govind C.K., Qiu H., Ginsburg D.S., Ruan C., Hofmeyer K., Hu C., Swaminathan V., Workman J.L., Li B., Hinnebusch A.G. Phosphorylated Pol II CTD recruits multiple HDACs, including Rpd3C(S), for methylation-dependent deacetylation of ORF nucleosomes. Mol. Cell. 2010;39:234–246. doi: 10.1016/j.molcel.2010.07.003. [DOI] [PMC free article] [PubMed] [Google Scholar]
- 43.Kimura H., Cook P.R. Kinetics of core histones in living human cells: little exchange of H3 and H4 and some rapid exchange of H2B. J. Cell Biol. 2001;153:1341–1353. doi: 10.1083/jcb.153.7.1341. [DOI] [PMC free article] [PubMed] [Google Scholar]
- 44.Thiriet C., Hayes J.J. Replication-independent core histone dynamics at transcriptionally active loci in vivo. Genes Dev. 2005;19:677–682. doi: 10.1101/gad.1265205. [DOI] [PMC free article] [PubMed] [Google Scholar]
- 45.Wade J.T., Struhl K. The transition from transcriptional initiation to elongation. Curr. Opin. Genet. Dev. 2008;18:130–136. doi: 10.1016/j.gde.2007.12.008. [DOI] [PMC free article] [PubMed] [Google Scholar]
- 46.Adelman K., Lis J. Promoter-proximal pausing of RNA polymerase II: emerging roles in metazoans. Nat. Rev. Genet. 2012;13:720–731. doi: 10.1038/nrg3293. [DOI] [PMC free article] [PubMed] [Google Scholar]
- 47.Mischo H.E., Proudfoot N.J. Disengaging polymerase: terminating RNA polymerase II transcription in budding yeast. Biochim. Biophys. Acta. 2013;1829:174–185. doi: 10.1016/j.bbagrm.2012.10.003. [DOI] [PMC free article] [PubMed] [Google Scholar]
- 48.Grosso A.R., de Almeida S.F., Braga J., Carmo-Fonseca M. Dynamic transitions in RNA polymerase II density profiles during transcription termination. Genome Res. 2012;22:1447–1456. doi: 10.1101/gr.138057.112. [DOI] [PMC free article] [PubMed] [Google Scholar]
- 49.Le Martelot G., Canella D., Symul L., Migliavacca E., Gilardi F., Liechti R., Martin O., Harshman K., Delorenzi M., Desvergne B., et al. Genome-wide RNA polymerase II profiles and RNA accumulation reveal kinetics of transcription and associated epigenetic changes during diurnal cycles. PLoS Biol. 2012;10:e1001442. doi: 10.1371/journal.pbio.1001442. [DOI] [PMC free article] [PubMed] [Google Scholar]
- 50.Steinmetz E.J., Warren C.L., Kuehner J.N., Panbehi B., Ansari A.Z., Brow D.A. Genome-wide distribution of yeast RNA polymerase II and its control by Sen1 helicase. Mol. Cell. 2006;24:735–746. doi: 10.1016/j.molcel.2006.10.023. [DOI] [PubMed] [Google Scholar]
- 51.Kim T.S., Liu C.H., Yassour M., Holik J., Friedman N., Buratowski S., Rando O.J. RNA polymerase mapping during stress responses reveals widespread nonproductive transcription in yeast. Genome Biol. 2010;11:R75. doi: 10.1186/gb-2010-11-7-r75. [DOI] [PMC free article] [PubMed] [Google Scholar]
- 52.Perales R., Erickson B., Zhang L., Kim H., Valiquett E., Bentley D. Gene promoters dictate histone occupancy within genes. EMBO J. 2013;32:2645–2656. doi: 10.1038/emboj.2013.194. [DOI] [PMC free article] [PubMed] [Google Scholar]
- 53.Murakami K., Elmlund H., Kalisman N., Bushnell D.A., Adams C.M., Azubel M., Elmlund D., Levi-Kalisman Y., Liu X., Gibbons B.J. Architecture of an RNA polymerase II transcription pre-initiation complex. Science. 2013;342 doi: 10.1126/science.1238724. doi:10.1126/science.1238724. [DOI] [PMC free article] [PubMed] [Google Scholar]
Associated Data
This section collects any data citations, data availability statements, or supplementary materials included in this article.