


Abstract
Vascular endothelial growth factor A (VEGF-A) is a master regulator of angiogenesis, vascular development and function. In this study we investigated the transcriptional regulation of VEGF-A-responsive genes in primary human aortic endothelial cells (HAECs) and human umbilical vein endothelial cells (HUVECs) using genome-wide global run-on sequencing (GRO-Seq). We demonstrate that half of VEGF-A-regulated gene promoters are characterized by a transcriptionally competent paused RNA polymerase II (Pol II). We show that transition into productive elongation is a major mechanism of gene activation of virtually all VEGF-regulated genes, whereas only ∼40% of the genes are induced at the level of initiation. In addition, we report a comprehensive chromatin interaction map generated in HUVECs using tethered conformation capture (TCC) and characterize chromatin interactions in relation to transcriptional activity. We demonstrate that sites of active transcription are more likely to engage in chromatin looping and cell type-specific transcriptional activity reflects the boundaries of chromatin interactions. Furthermore, we identify large chromatin compartments with a tendency to be coordinately transcribed upon VEGF-A stimulation. We provide evidence that these compartments are enriched for clusters of regulatory regions such as super-enhancers and for disease-associated single nucleotide polymorphisms (SNPs). Collectively, these findings provide new insights into mechanisms behind VEGF-A-regulated transcriptional programs in endothelial cells.
INTRODUCTION
Angiogenesis, the formation of blood vessels during tissue vascularization, involves a coordinated cascade of many signaling processes. Vascular endothelial growth factor (VEGF, VEGF-A) lies at the heart of this process, is essential for endothelial cell function and angiogenesis during development, and plays a major role in neovascularization also later in life (1). On the other hand, pathological angiogenesis is a hallmark of various ischemic and inflammatory diseases and cancer. Although the program of gene expression regulated by VEGF has been widely studied, the majority of genome-wide studies have focused on measuring stable mRNA levels (2,3) and have resulted in a less detailed understanding of the mechanisms affecting subsets of critical genes. For example, many stimulus-responsive early genes are regulated at the level of paused RNA polymerase II (Pol II) accumulated approximately 50 bp downstream of the transcription start site (reviewed in 4–6). This was first shown for the Drosophila melanogaster hsp70 heat shock gene, where gene induction in response to heat shock occurs very rapidly (7,8). Since then, the prevalence of pausing has been well established also in mammals, and according to current knowledge, 30–40% of RefSeq genes exhibit significant enrichment of promoter-proximal paused Pol II (4–6).
Coordinated responses to extra- and intracellular signals require the combined activity of promoters and enhancers, the latter containing the majority of binding sites for transcription factors and thus being largely responsible for tissue-specific gene expression (9–11). This occurs through the actions of a small number of key lineage-determining transcription factors (LDTFs), which select enhancer regions in the genome and allow binding of signal-dependent transcription factors (12,13). In endothelial cells, the major transcriptional regulators include members of the ETS, SOX, Forkhead (FOX), GATA and Krüppel-like families (KLF) (14). Especially the ETS family members, including ETS1, ELF1, FLI1, TEL, and ERG, have well-characterized roles in endothelial cell development and each bind to the enhancers and activate the transcription of endothelial genes. According to the current view, the selected enhancers then regulate the target promoter via direct physical interaction (looping) and recruitment of transcriptional coregulators, while participating in the establishment of the spatial organization of the genome. Recent advances in the development of chromosome conformation capture (3C) methods (15) have advanced our understanding of the topology of the mammalian genome. They have revealed that compartments of transcriptionally active euchromatin tend to group together separated from compartments of inactive heterochromatin (16). The subcompartment-level chromatin is further organized into megabase-scale topological domains which are already formed in embryonic stem cells and remain relatively constant throughout development (17). Notably, structural reorganization is seen during cellular differentiation at a submegabase scale and these lineage-specific subtopologies regulate establishment of cell type-specific gene expression programs (18). These contacts are reported to stay relatively stable to the effects of external stimuli (19). The pre-existing chromatin landscape could then be responsible for the selection and regulation of target genes in a cell type-specific way.
The goal of this study was to elucidate the mechanisms driving VEGF-regulated gene expression programs at the level of initiation, elongation and chromatin organization using global-run on sequencing (GRO-Seq) and tethered conformation capture (TCC) in primary human endothelial cells. Our results demonstrate that half of the VEGF-induced genes are poised for activation, characterized by high level of elongation competent Pol II, H3K4me3 and H3 acetylation. We also provide for the first time a genome-wide chromatin interaction map of human umbilical vein endothelial cells (HUVECs) and demonstrate how cell type-specific transcription could define the boundaries between active and inactive chromatin compartments. Finally, we present evidence for compartmentalization of VEGF-coregulated genes and show that these compartments are enriched for clusters of regulatory regions and disease-associated genes and DNA variation. The potential implications of compartmental gene regulation in disease are discussed.
MATERIALS AND METHODS
Cell culture
HUVECs were isolated from umbilical cords obtained from the maternity ward of the Kuopio University Hospital by the approval of the Kuopio University Hospital Ethics Committee. HUVECs were maintained in endothelial cell growth medium (EGM; 0.1% human epidermal growth factor, 0.1% hydrocortisone, 0.1% Gentamicin-Amphotericin-B, 0.4% bovine brain extract, 2% FBS; Lonza) on cell culture flasks coated with 10 g/ml fibronectin (Sigma, St. Louis, MO) and 0.05% gelatin in phosphate buffered saline (PBS). HUVECs were used at passage 5. Human aortic endothelial cells (HAECs) were purchased from Life Technologies, cultured as above and used at passage 8. For TCC, the HUVECs were purchased from Life Technologies, cultured as above and used at passage 8.
Treatments
Cells were seeded on 10 cm dishes and allowed to adhere for 24 h after which the cells were washed with Hank's Balanced Salt Solution and lipoprotein deficient medium (2% LPDS) was added. After 16 h, cells were treated with 50 ng/ml recombinant human VEGF-A165 (R&D Systems, Minneapolis, MN) for 2–8 h. siRNA knockdown was performed using Silencer® Select siRNA against RAD21 and by comparing the gene expression to two control siRNAs #1 and #2 (Life Technologies). Oligofectamine (Life Technologies) was used to transduce the cells with a final concentration of 5 nM of siRNAs. The gene expression and tube formation capacity was analyzed 48 h after siRNA treatment. For the Matrigel assay, the cells were dry-trypsinized, suspended into medium containing 1% FBS and counted. Cells were seeded onto growth factor reduced BD Matrigel™ Basement Membrane Matrix and incubated for 16 h before imaging with Olympus IX71 microscope.
GRO-Seq and RNA-Seq libraries
Global run-on and library preparation for sequencing was performed as described in (20) with minor modifications. Briefly, nuclei were extracted from 8 million cells grown on two 10 cm plates and after run-on reaction the RNA was extracted with Trizol LS Reagent (Life Technologies, Carlsbad, CA, USA). RNA was treated with TURBO DNase (Life Technologies), fragmented using RNA Fragmentation Reagents (Life Technologies) and purified by running through P-30 column (Bio-Rad, Hercules, CA, USA). The 3′ end of the fragmented RNA was dephosphorylated with T4 polynucleotide kinase (PNK; New England Biolabs, Ipswich, MA, USA) followed by heat-inactivation. Dephosphorylation reactions were purified using anti-BrdU beads (SantaCruz Biotech, Santa Cruz, CA, USA) and precipitated overnight. Poly(A)-tailing and cDNA synthesis were performed the next day as described (20). However, for reverse transcription an oligo allowing custom barcoding during final amplification was used: /5Phos/GATCGTCGGACTGTAGAACTCTGAAC/iSp18/TCAGACGTGTGCTCTTCCGATCTTTTTTTTTTTTTTTTTTTTVN (IDT). After cDNA synthesis, Exonuclease I (New England Biolabs) was used to catalyze the removal of excess oligo. The DNA–RNA hybrid was purified using ChIP DNA Clean & Concentrator Kit (Zymo Research Corporation, Irvine, CA, USA), RNaseH treated and circularized. The libraries were amplified for 11–14 cycles with oNTI201-primer: 5′-AATGATACGGCGACCACCGACAGGTTCAGAGTTCTACAGTCCGACG-3′ and a barcode specific primer oNTI200-index: 5′-CAAGCAGAAGACGGCATACGAGATXXXXXXGTGACTGGAGTTCAGACGTGTGCTCTTCCGATCT (barcode XXXXXX underlined). The final product was ran on Novex 10% TBE gel, purified and cleaned up as above.
For RNA-Seq libraries, RNA was purified using Trizol and enriched for Poly(A)-RNA with MicroPoly(A) Purist Kit (Life Technologies). Library cDNA was generated as above but by replacing the bead purification step with gel extraction on Novex 10% polyacrylamide TBE-urea gel (Life Technologies). The libraries were sequenced on the Illumina Genome Analyzer 2 or HiSeq 2000 according to the manufacturer's instructions.
ChIP-Seq libraries
ChIP-Seq libraries were prepared as previously described (21). Briefly, formaldehyde (10′) fixed lysates were clarified from sonicated nuclei and protein–DNA complexes were isolated with H3K4me2 antibody (07-030; Millipore, Billerica, MA, USA). DNA was end-repaired using a combination of T4 DNA polymerase, Escherichia coli DNA Pol I large fragment (Klenow polymerase; New England Biolabs) and PNK (Enzymatics Inc., Beverly, MA, USA). The blunt, phosphorylated ends were treated with Klenow fragment (minus exo; New England Biolabs) and dATP to yield a protruding 3- ‘A’ base for ligation of Illumina's adapters that have a single ‘T’ base overhang at the 3′ end. After adapter ligation, ChIP DNA was polymerase chain reaction (PCR) amplified with Illumina genomic adaptors or with NEXTflex DNA barcode adaptors (Bioo Scientific Corporation, Austin, TX, USA) and library fragments were size-selected (150–250 bp) from a 2% agarose gel. All libraries were sequenced on Illumina HiSeq 2000 according to the manufacturer's instructions.
Tethered conformation capture
TCC was performed as described (22) with minor modifications. Briefly, 90 million HUVECs were fixed with 1% paraformaldehyde/PBS at room temperature for 10 min and crosslinking was stopped by incubating cells 5 min in the presence of 125 mM glycine. Cells were washed two times with ice-cold PBS containing 0.5% bovine serum albumin and scraped into lysis buffer containing 10 mM Tris-HCl (pH 7.4), 10 mM NaCl, 5 mM MgCl2, 0.2% NP-40 and protease inhibitor cocktail (Roche). Samples were vortexed, incubated on ice for 10 min, centrifugated for 5 min in 1500 g in +4°C and washed once again with lysis buffer. Cells were washed twice with ice-cold wash buffer containing 50 mM Tris-HCl (pH 8.0), 50 mM NaCl and 0.5 M ethylenediaminetetraacetic acid and nuclei were isolated by incubating samples 10 min at +65°C in wash buffer with 0.55% sodium dodecyl sulphate and collected by centrifugation (1000 g for 1 min). Later steps followed the protocol described (22), except MboI (NEB) was used to digest chromatin, T1 Streptavidin dynabeads (Life Technologies) were used in all pulldown steps, NucleoSpin Gel & PCR Clean-up kit (Macherey-Nagel) for clean-up steps and Bioruptor NextGen sonicator for DNA shearing (high setting, 30 s/30 s cycles for total 35 cycles). Libraries were amplified in 15 PCR cycles and size-selected for 225–425 bp range on 10% TBE gel (Life Technologies). Gel was grinded and soaked with 0.1% Tween-20 and 150 mM NaCl and DNA was eluted through Ultrafree centrifugal filter column (Millipore), cleaned up with ChIP DNA Clean & Concentrator kit (Zymo Research) and paired-end sequenced with Illumina HiSeq 2000.
RNA extraction and qPCR
RNA was extracted using the RNeasy Mini Kit (Qiagen), Turbo™ DNAse treated (Life Technologies) and converted into cDNA using the SuperScript® First-Strand Synthesis System (Life Technologies). Quantitative PCR (qPCR) was done to analyze the change in promoter-proximal Pol II from the GRO-Seq prepared library and to monitor the changes in mRNA levels upon VEGF stimulus from the RNA extracted as above. qPCR was performed on an Applied Biosystems StepOne Plus™ system using SYBR GreenER mastermix (Invitrogen) and the following conditions: 10 min at 50°C and 10 min at 95°C, followed by 40 cycles of 15 s at 95°C, 15 s at 58°C and 30 s at 70–72°C. Primer sequences are listed in Supplementary Table S4.
Data Analysis
Processing of sequencing data and analysis of differentially regulated genes
GRO-Seq data was mapped using bowtie and RNA-Seq using tophat allowing up to two mismatches and reporting only one alignment for each read. Poor-quality reads were filtered out (minimum 97% of bp over quality cutoff 10). Each sequencing experiment was normalized to a total of 107 uniquely mapped tags and visualized by preparing custom tracks for the UCSC Genome Browser. Differentially expressed genes were identified using edgeR (23) and thresholds of P-value < 0.05, RPKM > 0.5 and fold change (FC) > 1.8 were used. Genes with RPKM < 0.1 were considered ‘inactive.’ Micro RNAs and small nucleolar RNAs were excluded from the analysis. Clustering results were generated by Cluster 3.0 (24) by normalizing gene expression tags to range from 0 to 1 and performing average linkage clustering using the uncentered Pearson correlation metric. The output from clustering was viewed using Java Treeview (25). For gene ontology analysis, DAVID Bioinformatics Resources 6.7 (GOTERM BP FAT; P-value < 0.01) (26,27) or HOMER (Biological Process; P-value < 0.05) was used.
Pausing analysis
Sequencing data analysis (including pausing analysis, peak finding, motif analysis and processing and analysis of TCC data) was performed using HOMER 4.3 and the detailed instructions for analysis can be found at http://homer.salk.edu/homer (12) and below.
Pause ratio of genes was calculated as a ratio of RPKM at the promoter (from transcriptional start site TSS to +200 bp) relative to the body of the gene (+200 bp to end of the gene). Genes shorter than 400 bp were excluded from the analysis. Gene was considered ‘paused’ if the pause ratio was ≥ 3 and promoter RPKM ≥ 2. Pause ratio threshold was selected based on plotting the pause ratios across active genes (Supplementary Figure S1E). Promoter RPKM ≥ 2 was used to ensure significant level of expression within the 200 bp to avoid false positives (i.e. ∼5 tags per sample with the current sequencing depth). All the candidates were further verified by visual inspection in UCSC Browser.
To compare the Pol II ChIP-Seq signal to GRO-Seq at the promoters (engaged to competent fraction of Pol II), the tags at the body of the gene were used to normalize the signal at the promoter for each gene assuming that the amount of Pol II is equal at gene bodies as described in (28). To avoid false gene annotations, the TSS were redefined based on GRO-Seq data using the ‘analyzeRNA.pl’ command in the HOMER software with ‘-tss’ option. Only genes with GRO- and Pol II ChIP-Seq RPKM > 0.5 at gene bodies and > 2000 bp in size were used in the analysis.
ChIP-Seq peak finding and eRNA detection
Genomic binding regions enriched for H3K4me1/2/3 and H3K9/27ac were identified using the ‘findPeaks’ command in the HOMER software with default settings for ‘style histone’ option: identification of 500 bp regions, 4-fold enrichment over input tag count 4, 0-fold enrichment over local tag count and 0.001 false discovery rate (FDR) significance. The settings for transcription factor peak detection were those of ‘style factor’ option: identification of 200 bp peaks, with 4-fold tag enrichment over input and over local tags and 0.001 FDR significance. To analyze if histone marks were enriched over the promoters of a subgroup of genes, we analyzed the literal overlap of the enriched regions as defined above with the 2 kb region around the annotated ‘TSS’ of genes. To define intergenic enhancers we selectively considered intergenic regions defined as areas at least 3 kb away from the TSS of any known RefSeq or UCSC gene to avoid false promoter annotations. For analysis of intergenic eRNA expression, also a region of 10 kb from the transcriptional termination site (TTS) was excluded to avoid interference of coding gene transcription downstream of the 3′ end of genes (29).
Motif analysis
Motif enrichment at promoters and regulatory regions was performed using the ‘findMotifs.pl’ and ‘findMotifsGenome.pl’ commands in the HOMER software, respectively, with default settings: size used for motif finding was 200 bp and motif length 8, 10 and 12 bases. A random set of genomic positions matched for GC% content was used as background. For motif analysis at H3K4me2-defined enhancers, the signal was centered around nucleosome-free regions (NFRs). This was done by scanning each region, comparing the read density within 100 bp intervals relative to the flanking 150 bp regions and assigning the NFR to a location with the greatest disparity in read density.
Preprocessing of TCC data
For TCC analysis, reads from paired-end sequencing were separately filtered and aligned to the genome using bowtie. Each read was trimmed from the 3′ end after GATC site and minimum read length was set to 25 bp. Paired-end reads were connected and additional filtering steps were performed using HOMER 4.3. Read pairs with exact same ends were only considered once and read pairs were removed if they were separated by less than 1.5× the estimated sequencing insert length to remove likely continuous genomic fragments or re-ligation events. Paired-end reads originating from regions of unusually high tag density were left out by removing reads from 10 kb regions that contain more than five times the average number of reads. Reads were filtered according to their distance from a restriction site keeping only those read pairs that had both of their reads aligning at most 1.5× fragment length estimate from a restriction site. Reads were removed if their ends form a self-ligation with adjacent restriction sites.
Analysis of individual interactions
Data normalization and identification of significant interactions were done as described in (30) using a resolution of 10 kb and P-value < 0.001. FDR for significant interactions was estimated by generating random experiment with the same sequencing depth and by performing interaction search from this randomized dataset, which gave an FDR estimate of <5%.
To associate interactions with nearby genes, study feature enrichment at interaction endpoints and connect features with interactions the HOMER command ‘annotateInteractions.pl’ was used (30). The program uses positional overlaps to assign interaction endpoints to ChIP-Seq peak locations and other genomic features. Gene targets are assigned as the closest RefSeq annotated TSS relative to the interaction endpoint location. Feature enrichment is calculated based on the expected overlap of features and interaction endpoints given an effective genome size of 2×10⁹ bp to help correct for uninterrogable regions of the genome.
To assign an enhancer to a particular gene using TCC data, the opposing end of each interaction originating from an enhancer had to reside within 10 kb of the TSS. Enrichment of cis-regulatory elements with gene promoters was calculated from the region 2–5 kb around TSS using ‘annotateInteractions.pl’ command. To study the HUVEC-specific super-enhancers, we first identified the individual H3K27ac regions that had been previously stitched together to identify the clusters of enhancers called super-enhancers (31). Subsequently, we studied the interactions originating from these H3K27ac regions compared to ‘normal’ enhancers that were located outside the boundaries of super-enhancers. To investigate the enrichment of DNA sequence variation or disease-associated genes within compartments, we used the list of 15 328 single nucleotide polymorphisms (SNPs) from NHGRI Catalog of Published Genome-Wide Association Studies (GWAS) and 16 658 genes from DisGeNET database (32,33). A list of cardiovascular disease (CVD) associated genes was compiled by selecting diseases linked to keywords cardiovascular, vascular, coronary and cerebrovascular diseases.
Analysis of chromatin compartments and topological domains
Principal component analysis (PCA) was performed using the HOMER command ‘runHiCpca.pl.’ Briefly, this analysis divides the chromosomes into two sets of loci (active/inactive) such that contacts within each set are enriched and contacts between sets are depleted (16,30). The HUVEC-specific active compartments were determined by comparing the PC1 values from IMR90/hESC and HUVEC HiC data using 50 kb resolution. Regions of continuous positive PC1 value were considered to be active and differential compartments were analyzed by setting the minimum difference between PC1 values to 80 (Supplementary Figure S7A). The topological domains were identified using the HOMER command ’findHiCDomains.pl.’ This analysis is based on a statistic referred to as the ‘directionality index,’ which describes the tendency of a given position to interact with either the chromatin upstream or downstream from its current position (17). A 50 kb window was used for the analysis of chromatin compartments with PCA (16,30), whereas 10 kb was used to detect topological domains (17) (Supplementary Figure S5). To test for the significant enrichment of super-enhancers/SNPs in chromatin compartments or regulated genes/disease-associated genes we used the hypergeometric distribution function as follows:
 |
where N is the total number of compartments or active genes, m is the number of compartments containing regulated super-enhancers/SNPs or VEGF-regulated/disease-associated genes, n is the number of VEGF-regulated compartments or active genes within VEGF-regulated compartments, and k is the number of compartments containing super-enhancers/SNPs or VEGF-regulated/disease-associated genes within VEGF-regulated compartments. As an additional control for compartment size, if the enrichment within VEGF-regulated compartments was lower than in three random sets of compartments of similar size (total Mb), the enrichment was considered non-significant.
Statistical analysis and visualization of data
Statistical analyses were performed using Excel or GraphPad Prism 5. The images were prepared using Excel, GraphPad Prism 5, R package Geneplotter version 1.40.0, UCSC Genome Browser and Photoshop CS5.1.
Data access
Experiments performed in this study are available in GEO under the accession number GSE52642.
The public datasets analyzed can be found under accession numbers GSE41166 (H3K27ac, p300, ETS1 ChIP-Seqs under VEGF treatment), GSE29611 (H3K4me2 [HUVEC and other ENCODE cell lines], H3K4me1/3, H3K9ac, H3K27ac and Pol II ChIP-Seqs), GSE32465 (Pol II ChIP-Seq), GSE31477 (cJUN, cFOS, GATA2 ChIP-Seqs), GSE35156 (hESC and IMR90 HiC), GSE43070 (IMR90 GRO-Seq), GSE16256 (IMR90 H3K4me2 ChIP-Seq) and GSE41009 (hESC GRO-Seq).
RESULTS
Transcriptional responses to VEGF-A
To investigate the effects of VEGF stimulation on early transcription events, we quantified nascent transcripts following treatment of HUVEC and HAEC cells with recombinant human VEGF-A165 for 2 h (Supplementary Table S1A). The short stimulation time allowed us to visualize the leading edge of Pol II at long VEGF-responsive genes, such as PDE4D and CHD13, and thus confirm the success of GRO-Seq (Figure 1A). For these genes, we observed an elongation rate of ∼3 kb/min, which is in line with recent reports (34,35). The biological replicates (each replicate of pool of three donors) and HUVEC and HAEC cells had high statistical correlation across gene bodies (Pearson correlation r = 0.96; Supplementary Figure S1A).
Figure 1.
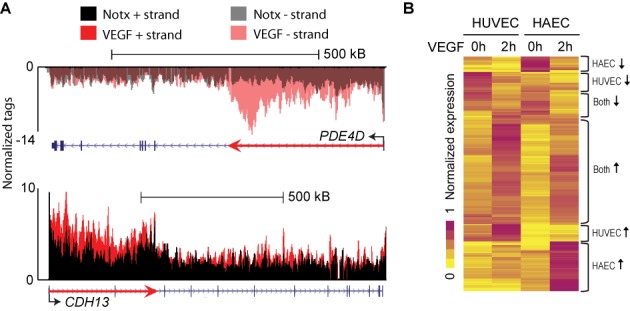
Characterization of early transcriptional programs in response to VEGF stimulus in primary endothelial cells. (A) UCSC Genome Browser image for long VEGF-upregulated genes PDE4D (chr5:58,245,963-59,070,890) and CHD13 (chr16:82,660,399-83,830,215) in HAECs and HUVECs, respectively. Normalized tag counts for GRO-Seq are shown under no treatment (Notx) and 2 h VEGF-A stimulation. The red arrow indicates the trajectory that Pol II has traveled during the stimulation. (B) Hierarchical clustering and heat map of the normalized gene expression values for VEGF-regulated genes in HUVECs and HAECs. Brackets to the right indicate major groups of genes.
GRO-Seq analysis identified 252 nascent RNA transcripts regulated by more than 1.8-fold (reads per kilobase per million reads, RPKM > 0.5, P-value < 0.05; Figure 1B, Supplementary Figure S1B, Supplementary Table S1B) in either cell population, which were highly enriched for biological pathways implicated in cell migration, blood vessel development and regulation of cell proliferation (Supplementary Table S1C). Hierarchical clustering revealed that roughly half of these genes are commonly regulated in HUVECs and HAECs (Figure 1B), with ∼70% of the upregulated genes and ∼40% of the downregulated genes showing similar regulation (FC > 1.4). Overall, the biological replicates and different endothelial cell lines were similar in their response to VEGF stimulus (Supplementary Figure S1C).
To characterize how well GRO-Seq results correlate with mature mRNA levels, we performed RNA-Seq in HUVECs after 8 h treatment with recombinant VEGF-A 165. The late time point was chosen to reflect the lag between transcription and mature mRNA formation (29). Comparison of differentially regulated genes detected by GRO-Seq or RNA-Seq revealed correlation between the two methods but also identified genes that were only classified as regulated by one of the sequencing methods (Supplementary Figure S1D, Supplementary Table S1D). This suggested that subgroups of genes are solely regulated at the transcriptional or post-transcriptional level.
Half of VEGF-A-induced genes exhibit a paused phenotype
To study whether VEGF-regulated early genes are enriched for a paused form of Pol II immediately downstream of the TSS, we calculated the pause ratio for all the induced genes in basal conditions by dividing promoter-proximal tag counts by gene body tag counts (Figure 2A). Forty-six and sixty-one percents of the genes induced upon VEGF-A stimulation in HUVECs and HAECs (HUVEC: 37/80 genes; HAEC: 92/151 genes) displayed a paused phenotype, respectively, thus exhibiting a pause ratio of over 3 (Figure 2A and B, Supplementary Figure S1E, Supplementary Table S1E). The pause ratios showed high similarity between biological replicates (Supplementary Figure S1F). Ontology (GO) analysis suggested that paused genes participate in biological processes involved in signal transduction pathways such as the unfolded protein response (UPR) and signal transduction, whereas non-paused genes take part in the regulation of cell motility and stress response suggesting that they might be associated with different biological processes (Figure 2C, Supplementary Table S1F).
Figure 2.
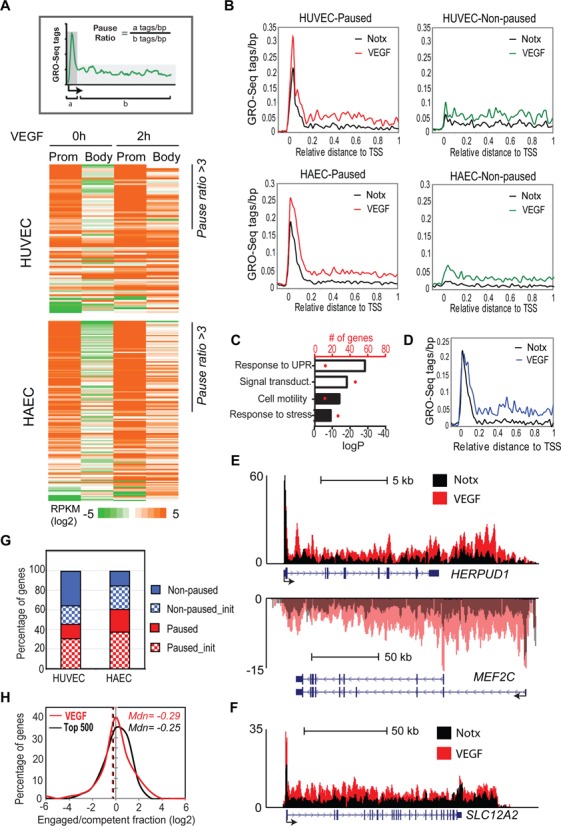
VEGF-regulated genes are controlled by the transition from paused to elongating forms of Pol II. (A) The gene pause ratio (upper figure) was defined as the ratio of strand-specific GRO-Seq tag density (RPKM) within the proximal promoter (a = 0–200 bp) to the GRO-Seq tag density at the gene body (b = +200 to end of the gene). Heat map of the GRO-Seq tags (lower figure) at the promoter and at the body of the gene sorted by the pause ratio. (B) Distribution of average GRO-Seq tag densities on the + strand around the TSS of VEGF-upregulated genes displaying paused or non-paused polymerase in basal conditions (no treatment = Notx). (C) Gene ontology analysis of the paused (white) and non-paused (black) VEGF-upregulated genes. Number of genes belonging to the ontology group are indicated by red dots. UPR = unfolded protein response. (D) Profile of GRO-Seq tag densities at the + strand of paused genes where the induction was restricted to gene bodies. (E and F) UCSC Genome Browser image depicting normalized GRO-Seq tag counts at (E) HERPUD1 (chr16:56,965,000-56,985,000) and MEF2C (chr5:87,999,470-88,188,000) genes upregulated at the level of elongation and (F) SLC12A gene (chr5:127,418,000-127,554,000) upregulated at the level of elongation and initiation. The lighter colors at MEF2C GRO-Seq signal indicate transcription along the negative strand. (G) Fraction of VEGF-upregulated genes displaying a paused (red) versus non-paused (blue) phenotype. All genes are induced at the level of elongation but the fraction of genes also induced at the level of initiation (FC > 2) are indicated with a checker board pattern. (H) Histogram showing the distribution of engaged/competent fraction for promoters of 500 top (black) and VEGF-upregulated (red) paused genes. The dashed lines correspond to the median.
To gain more detailed understanding of the transcriptional stage at which the regulation occurs, whether it is at the level of initiation or elongation, we next studied the changes in GRO-Seq signal at the promoter and along the gene body. Of the paused genes, 35–46% displayed an over 2-fold decrease in pause ratio upon VEGF-A stimulation and were thus regulated mainly through release of Pol II into productive elongation (17/37 HUVEC; 32/92 HAEC), exemplified by HERPUD1 and MEF2C (Figure 2D and E). In the case of MEF2C, VEGF also stimulated the use of an alternative promoter. Besides being induced at the level of elongation, 34–47% of all VEGF-induced genes exhibited over 2-fold increase at the level of promoter-proximal Pol II (27/80 HUVEC, 71/151 HAEC; Supplementary Table S1E, Figure 2G), illustrated by SLC12A2 (Figure 2B and F). Similarly, all the VEGF-downregulated genes showed a decrease in GRO-Seq at the gene bodies and 47–77% also exhibited a significant decrease in the amount of promoter-proximal Pol II in HAECs and HUVECs, respectively (Supplementary Table S1E). This data confirms that VEGF-regulated immediate-early genes are controlled by the transition from paused to elongating forms of Pol II.
GRO-seq only detects RNA polymerases engaged in transcription and the increase in promoter-proximal GRO-Seq signal at VEGF-induced genes could be either explained by (i) an increase in the initiation of transcription with constant rate of elongation or (ii) an increase in the fraction of Pol II that becomes elongation competent (i.e. release of arrested form of Pol II (36)). To address this question, we compared the GRO-Seq data to published Pol II ChIP-Seq data from HUVECs (37). Pol II ChIP-Seq is able to recognize both the elongation competent and incompetent forms of Pol II and thus the ratio of two sequencing methods will reveal the fraction of engaged to competent Pol II (28). Our analysis demonstrated that the engaged/competent fraction at promoters of paused genes fits a bell-shaped distribution, with a median close to 1 (log 2 = 0) suggesting that the major form of Pol II is elongation competent in basal conditions and the increase in promoter-proximal GRO-Seq upon VEGF-stimulation is likely due to increase in initiation (Figure 2H).
Several studies have demonstrated that active promoter transcription is associated with positive chromatin marks such as H3K4me3 and H3K9ac (38–40). To study if this also holds true for VEGF-regulated genes, we analyzed the pattern of H3K4me3, H3K9 and H3K27 using the publicly available data (3,37). The H3K4me3 mark was enriched over background at 100% of paused promoters and 86% (38/44) of non-paused promoters, indicating that this mark becomes established independently of the promoter status. However, the level of H3K4me3 was significantly higher at paused promoters (Figure 3A). Other marks of active chromatin, namely acetylation of H3K9 and H3K27, were highly correlated with H3K4me3 and also exhibited a significantly higher frequency at paused promoters (Figure 3A). This suggested that acetyltransferases such as p300 could be involved in setting up the acetylation at these sites. Indeed, analysis of p300 ChIP-Seq data in VEGF-stimulated HUVECs indicated that p300 is present at 66% (23/35) of paused promoters under basal conditions compared to 34% (15/44) for non-paused ones (hypergeometric test P-value: 0.005). The level of H3K27ac and binding of p300 were proportionally increased upon early VEGF stimulation at both paused and non-paused promoters and returned to basal levels at later time points (Figure 3B and C). This is in line with a recent report suggesting that p300 is functionally involved in deposition of H3K27ac in response to VEGF stimulation (3). Taken together, these data indicate that paused VEGF-responsive genes in endothelial cells are characterized by the presence of H3K4me3, H3K9ac and H3K27ac marks under basal conditions, exhibiting histone modifications characteristic of actively transcribed genes.
Figure 3.
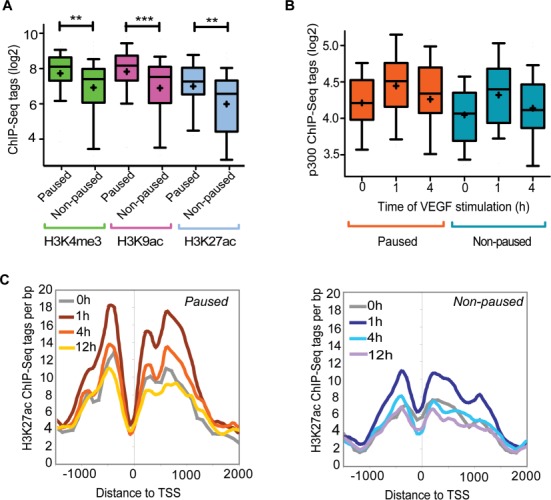
VEGF-induced paused genes exhibit characteristics of actively transcribed genes under basal conditions. (A and B) Box-and-whisker plots of the ChIP-Seq tags around TSS (2 kb) of the paused and non-paused genes. Boxes encompass the 25th to 75th percentile changes. Whiskers extend to 10th and 90th percentiles. The median tag count is indicated by the central horizontal bar and the mean tag count fold by +. ***P-value < 0.001, ** < 0.005, two-tailed Student's test. (C) Temporal profile of change in H3K27ac ChIP-Seq tags (3) around TSS of paused and non-paused genes following VEGF treatment.
Regions of active transcription exhibit more chromatin interactions
To analyze the role of enhancers in the regulation of VEGF-transcriptional program we used H3K4me2 ChIP-Seq to localize the regulatory regions in HUVEC and HAEC cells. We identified ∼59 000 regulatory regions in HUVECs (37) and ∼71 000 regions in HAECs. The subsequent analysis was limited to ∼15 000 intergenic regions located at least 3 kb away from the TSS and 10 kB from the TTS of any known RefSeq or UCSC gene. In HUVECs, ∼90% of these regions exhibited higher enrichment of H3K4me2 and H3K4me1 over H3K4me3 suggesting that the vast majority of regulatory regions used in the analysis are indeed enhancers although we cannot exclude the presence of a small fraction of promoters belonging to previously unannotated genes (Supplementary Figure S2A). Comparison of the HUVEC and HAEC enhancers demonstrated that 60% were shared by both cell types. Moreover, ∼35% of these regions showed no overlap with publicly available ENCODE data from HepG2, hESC1, HeLa, A549, IMR90 and MCF7 cells (37), indicating that many of these endothelial enhancers are cell type specific (Supplementary Figure S2B). Endothelial enhancers were highly enriched for motifs recognized by AP-1, ETS, IRF, SOX and FOX transcription factors, consistent with previous findings (3,41), further supporting the similarity of vein and artery endothelial cells (Figure 4A).
Figure 4.
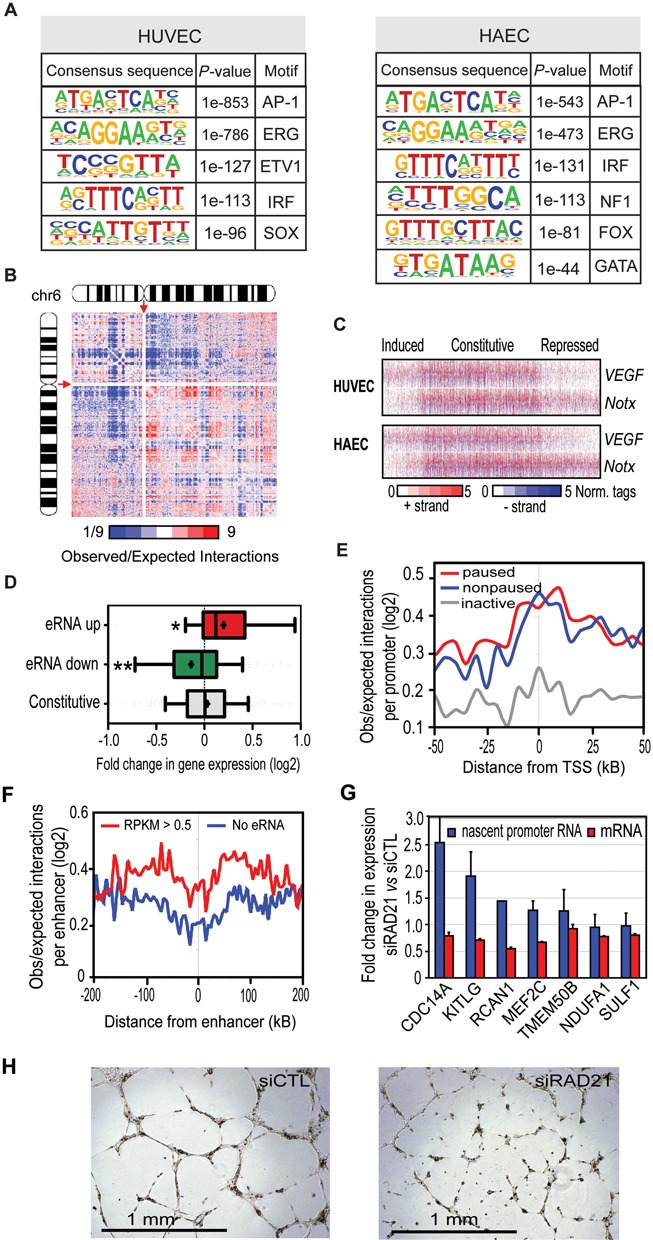
Characterization of endothelial enhancers and relationship between transcriptional activity and chromatin interactions. (A) De novo motif analysis of regulatory regions in HUVEC and HAEC cells. Motifs were identified by comparing the intergenic H3K4me2 regions to randomly selected genomic regions. (B) Genome-wide contact matrix showing normalized intrachromosomal interactions involving chromosome 6 (Chr 6) at 200 kb resolution. Colors indicate the ratio of observed interaction frequency to expected interaction frequency derived from background model (normalized for sequencing coverage and distance between loci): blue, lower than expected; red, higher than expected. The centromere positions, devoid of any signal, are indicated by red arrows. (C) Heat maps of normalized tag densities for GRO-Seq around 2 kb of intergenic H3K4me2 enhancers with significant eRNA expression (RPKM > 0.5) centered to nucleosome-free regions. (D) Box-and-whisker plots of the fold change in expression of genes interacting with enhancers associated with induced and repressed constitutive eRNA expression in HUVECs. Boxes encompass the 25th to 75th percentile changes. The median tag count is indicated by the central horizontal bar and the mean tag count fold by +. *P-value < 0.05, ** < 0.005, one-tailed t-test compared to the constitutive group. (E) Profiles of TCC interaction frequency centered on promoters comparing active (RPKM > 0.5) paused and non-paused and inactive genes (RPKM < 0.1) identified using GRO-seq data. (F) Profiles of TCC contact frequency centered on enhancers, comparing regions with no or significant eRNA expression. (G) Fold change in the promoter-proximal Pol II upon cohesin knockdown (blue bars) analyzed by qPCR from GRO-Seq libraries. Effect of cohesin knockdown on mRNA expression analyzed from total RNA 8 h after VEGF treatment (red bars). The experiments represent results from 2–4 replicates. (H) Effect of RAD21 knockdown on tube formation. HUVECs were seeded on growth factor reduced Matrigel after 48 h of siRNA treatment and incubated for 16 h before imaging.
As the common practice to link distal enhancers to their nearest promoters can lead to false assignments, we wanted to improve the target gene prediction by generating a map of chromatin interactions in HUVECs using TCC (22). We produced a total of 120 million paired-end reads and computed interactions between loci with a window of 10 kilobases. From the filtered interaction data, we generated genome-wide interaction matrices for each chromosome (Figure 4B, Supplementary Figure S3). This analysis identified clusters of interacting genomic elements across the entire length of chromosomes in HUVECs. In addition, we identified a total of 87 240 significant interactions in HUVEC cells with a median distance of 168 kb (FDR < 5%; Supplementary Table S2). Majority of the interactions were between inter- or intragenic regions (75%), less than half (42%) of which were enriched for histone marks characteristic of enhancers. Only 3% of interactions were between promoters, whereas promoter-proximal elements represented 20% of interactions. Altogether, 241 interactions were associated with VEGF-regulated promoters and 25% of them (61/241) were within enhancer regions. On the other hand, a total of 538 interactions were associated with enhancers exhibiting over 2-fold change in eRNA expression upon VEGF stimulation. We next interrogated the expression of genes looping to these enhancers compared to regions exhibiting constitutive expression of eRNAs (Figure 4C, Supplementary Table S3A). Our data demonstrated that eRNA expression correlated well with changes in transcription of the interacting gene (Figure 4D). No differences were seen in the basal chromatin interactions between induced and repressed enhancers suggesting that pre-existing interactions do not determine the direction of regulation, i.e. up- or downregulation (data not shown).
We next evaluated whether chromatin interactions could explain promoter-proximal pausing. We observed no association between the two as active genes, whether paused (43% of RefSeq) or non-paused, exhibited similar level of interactions with the surrounding regions (Figure 4E). However, significantly more interactions were seen at these active genes compared to inactive ones (RPKM < 0.1). In line with this, interaction endpoints associated with active gene promoters exhibited significant enrichment of the active histone marks H3K4me1/2/3 and H3K27ac whereas these marks were depleted from inactive gene promoters (Supplementary Figure S2C). Division of genes into quartiles based on gene RPKM levels revealed that the interactions are more prominent at highly expressed genes suggesting that looping correlates more with the overall expression level of a gene than with the pausing status (Supplementary Figure S2D). Similarly active enhancers, producing eRNAs, were more likely to interact with adjacent regions compared to inactive regions (Figure 4F) suggesting and important role for active transcription in establishing chromatin loops.
Growing evidence suggests an intimate link between transcriptional pausing and enhancer function (42–44). It has been demonstrated that stalled promoters promote higher order chromatin organization, i.e. looping between promoters and enhancers, but also that enhancers participate in the regulation of transcriptional pause (43,44) release. Cohesin has been shown to play a pivotal role in mediating specific long-range interactions within chromatin compartments and facilitate enhancer–promoter looping (45). Moreover, cohesin depletion increases transcriptional pausing in Drosophila cells (46). To probe the requirement of cohesin in promoter-proximal pausing of VEGF-regulated genes, we knocked down the RAD21, a subunit of cohesin in HUVECs. Knockdown efficiencies of ∼90% of the mRNA were achieved (data not shown). The results show that knockdown of RAD21 increased the level of promoter-proximal Pol II at 5/7 of genes and reduced the VEGF-mediated induction of mRNA expression (Figure 4G). Moreover, RAD21-specific siRNA markedly abolished HUVEC tube formation on Matrigel (Figure 4H). Altogether, our results suggest that although paused and non-paused genes exhibit similar level of interactions, the looping connections, in part mediated by cohesin, are crucial for the regulation of the level of promoter-proximal pausing of VEGF-regulated genes and angiogenesis.
VEGF-regulated genes localize to compartments with similarly regulated genes
Recent studies have shown that interphase chromatin is partitioned into spatially segregated megabase-sized compartments and submegabase-sized topological domains (16,17). To analyze the organization of VEGF-regulated genes within compartments, we partitioned each chromosome into active, gene- and enhancer-rich, and inactive, gene-poor, compartments using PCA (Figure 5A, Supplementary Figure S4A) (16,22). The active compartments preferentially interact with other active compartments throughout the genome, whereas the inactive tend to interact together (Supplementary Figure S4A). We identified 2022 active compartments in HUVECs, and the 108 VEGF-regulated genes fell into 81 of them, with a median size of 1.65 Mb (Supplementary Table S3B). Average active gene count (RPKM > 0.3) within the 81 compartments was 23 genes. To our surprise, many of the genes located in the same compartment with VEGF-regulated genes exhibited similar regulation irrespective of the paused or non-paused phenotype (Figure 5A and B; data not shown). Notably, of the 81 compartments, we could identify 16 compartments of VEGF-upregulated and 9 compartments of downregulated genes in which a significant fraction of genes were associated with similar regulation (FC > 1.2; hypergeometric test P-value < 0.05; Figure 5C, Supplementary Figure S4B, Supplementary Table S3C).
Figure 5.
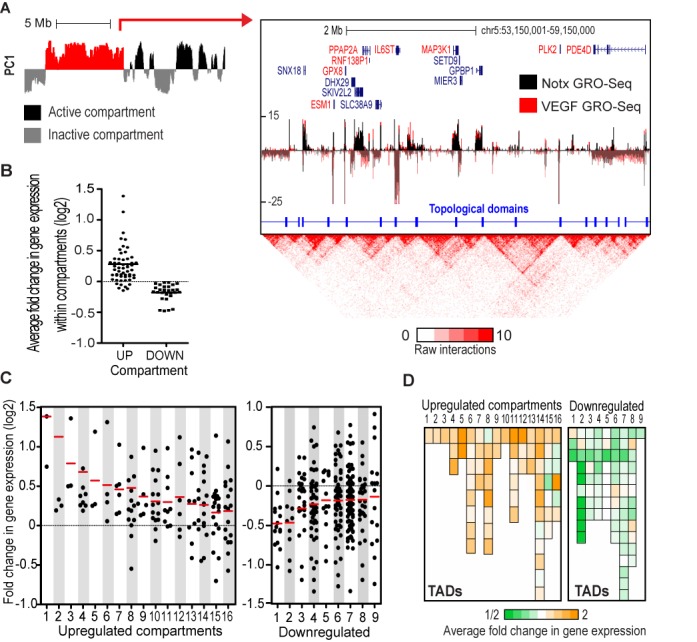
Identification of chromatin compartments enriched for VEGF-regulated genes. (A) PC1 profile depicting active (black) and inactive (gray) chromatin compartments in position chr5:50,000,000-68,500,000 (left). Two-dimensional heat map surrounding the VEGF-upregulated chromatin compartment (highlighted red; chr5:53,150,001-59,150,000 at resolution of 10 kb) is shown on the right panel. Normalized tag counts for GRO-Seq are shown for active genes (RPKM > 0.3) under no treatment (Notx) and VEGF stimulation. Names of the upregulated genes are highlighted in red and the topological domains are indicated by blue line segments. (B) Scatter plot depicting average fold changes in gene expression upon VEGF stimulation in the 56 chromatin compartments containing VEGF-upregulated gene(s) (UP) and 15 compartments associated with downregulated gene(s) (DOWN). Chromatin compartments containing ≥3 genes are shown. (C) Scatter plot depicting fold changes in gene expression upon VEGF stimulation in HUVECs. The genes included in the upregulated (left) and downregulated (right) chromatin compartments are shown. Red line denotes the mean fold change within compartment. (D) Average fold change in gene expression in topologically associated domains (TADs) along the VEGF-up- and downregulated compartments. The order of compartments follows that of Figure 5C.
Due to high similarity of HUVEC and HAEC cell types, we next interrogated HAEC gene expression in HUVEC-defined compartments. We saw a similar regulation for 14/15 genes within the upregulated compartments in HAECs (Supplementary Figure S4B, Supplementary Table S3C). However, the correlation was poor within the downregulated compartments where only 3/9 showed similar regulation, which is in line with the observation that only 40% of the repressed genes are shared by the two cell lines (Figure 1B, Supplementary Figure S4B). This also implies that downregulated compartments could exhibit more cell type-specific regulation.
The active chromatin compartments can be further subdivided into smaller topologically associating domains (TADs) that represent highly self-interacting regions surrounded by segments that lack obvious chromatin interactions (Figure 5A, Supplementary Figures S5 and S6A) (17,47). They are localized at active or inactive compartments and have been shown to be highly tissue invariant. We identified a total of 5717 topological domains in HUVECs at 10 kb resolution (Supplementary Figure S5) of which 614 fell into the VEGF-regulated compartments suggesting average division of VEGF compartments into ∼8 TADs (Figure 5A, Supplementary Figure S4A, Supplementary Table S3D). Previously, it was shown that expression profiles of genes located within the same TAD are highly correlated (47). To investigate if the VEGF-regulated genes are located within a limited number of TADs within chromatin compartments, we focused our analysis on the 25 significantly VEGF-regulated compartments. These compartments comprised of 175 TADs of which 148 contained active genes. We compared the average fold change in gene expression within the 148 TADs and found that similarly regulated genes within compartments were often spread throughout the different topological domains (Figure 5A and D; Supplementary Table S3C). This suggests that coordinately regulated TADs are integrated into larger regulatory compartments potentially sharing common cis-elements.
VEGF-regulated compartments are enriched for clusters of regulatory regions bound by lineage-determining transcription factors
To identify factors that might be responsible for selecting the compartments for VEGF-mediated regulation, we further studied the regulatory elements located within the compartments. The VEGF-regulated compartments were enriched for the binding motifs of ETS1, AP-1, FOXP1 and NF1 at their regulatory regions (Figure 6A). To see if the amount of ETS1 LDTF was higher in the VEGF-regulated compartments, we took advantage of the public ChIP-Seq data (3). To our surprise, we noticed that VEGF-regulated compartments had significantly more ETS1 peaks than the non-regulated compartments either measured by the number of peaks per compartment or RPKM (Figure 6B, Supplementary Figure S6). This correlated with a higher number of H3K27ac regions in VEGF-regulated compartments, suggesting that VEGF-regulated compartments are enriched for clusters of regulatory regions (Figure 6B, Supplementary Figure S6).
Figure 6.
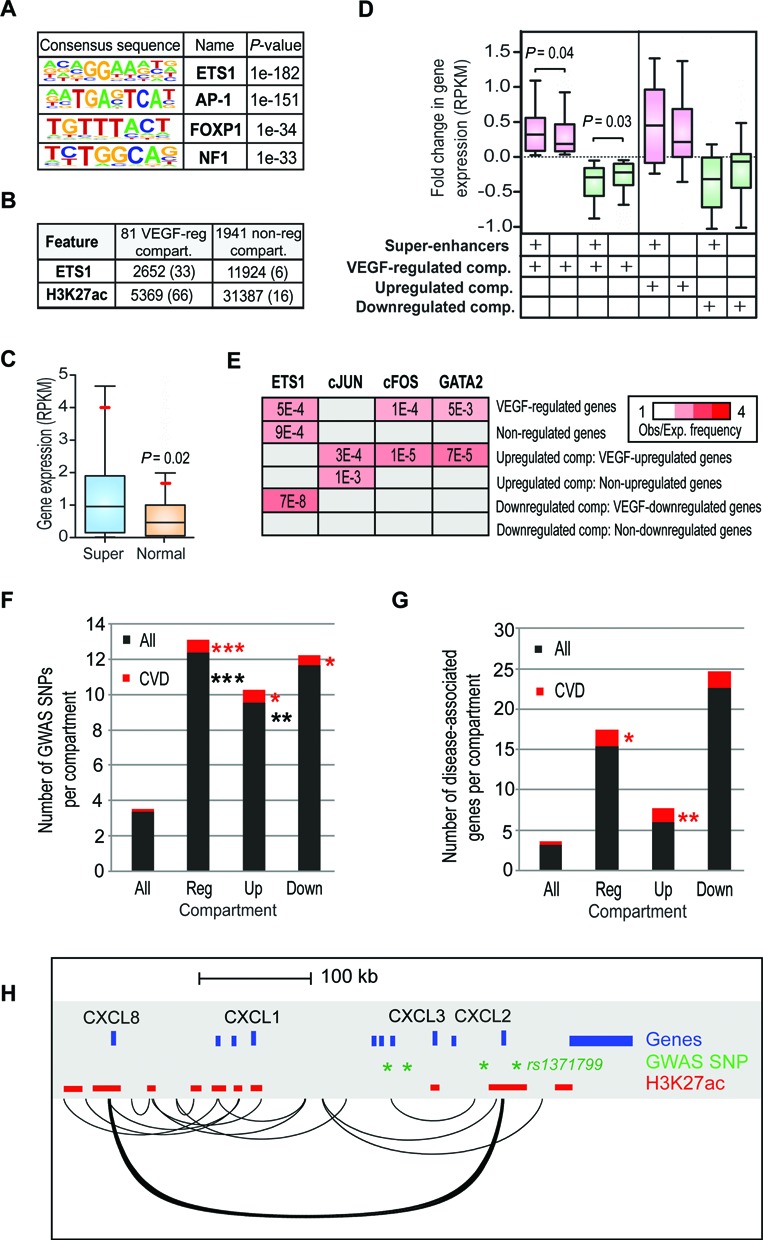
VEGF-regulated compartments are enriched for clusters of enhancers. (A) Sequence motifs associated with the regulatory regions of chromatin compartments containing VEGF-regulated genes when compared to randomly selected genomic loci. Regulatory regions were defined by a significant enrichment of H3K4me1, H3K4me2 or H3K27ac. (B) Number of ETS1 peaks and H3K27ac regions associated with VEGF-regulated compartments or non-regulated compartments. The average number per compartment is indicated in parentheses. (C) Box-and-whisker plots of the expression level (RPKM) of genes interacting with super-enhancers (blue) or normal enhancers (orange) within VEGF-regulated chromatin compartments. Boxes encompass the 25th to 75th percentile changes. Whiskers extend to 10th and 90th percentiles. The median fold change is indicated by the central horizontal bar and the mean by a red line. P-value based on one-tailed t-test is shown. (D) Box-and-whisker plots of the fold change in expression of genes interacting with super-enhancers or normal enhancers within the VEGF-regulated chromatin compartments. Boxes encompass the 25th to 75th percentile changes and whiskers extend to 10th and 90th percentiles. The median fold change is indicated by the central horizontal bar. For 81 VEGF-regulated compartments, the genes were divided into upregulated (pink boxes 1–2; fold change > 1) and downregulated genes (green boxes 3–4; fold change < 1) whereas for 16 VEGF-upregulated (pink boxes 5–6) and 9 VEGF-downregulated (green boxes 7–8) compartments all active genes are shown. P-values based on one-tailed t-test are indicated. (E) Preferential interactions of VEGF-regulated gene promoters (2 kB around TSS) with endothelial-specific lineage-determining transcription factor peaks based on ChIP-Seq data from (3,37). Heat map represents enrichment ratios, i.e. observed association frequency relative to expected frequency (association strength; red) for each comparison exhibiting significant P-values < 0.005. Non-significant enrichment pairs are represented by gray boxes. Results from the non-regulated genes are represented as median of four randomly selected sets of 108 non-regulated genes to allow comparison to 108 VEGF-regulated genes. (F and G) Overlap of SNPs and disease-associated genes in the NHGRI Catalog of Published GWAS and DisGeNET database (June 2014), respectively, with HUVEC chromatin compartments. Average (F) SNP or (G) gene count is shown for all (2022), VEGF-regulated (81), VEGF-upregulated (16), and VEGF-downregulated (9) compartments. *P-value < 0.007, ** < 0.0002, *** < 2.5E-11, hypergeometric test. (H) Significant interactions at CXCL-loci (chr4:74,433,700-75,000,000). Regulatory regions defined by H3K27ac, gene annotations and the GWAS SNPs are shown. Of the SNPs, only rs1371799 is located within a HUVEC enhancer.
Clusters of enhancers that are densely occupied by the LDTFs and Mediator, called super-enhancers, have been recently identified as regulators of genes that define cell identity (48). Super-enhancers are found in a broad range of human cells and they seem to play prominent roles in control of cell type-specific gene expression program (31). These super-enhancers differ from typical enhancers in cell-type specificity, size, transcription factor density and sensitivity to perturbation such as depletion of LDTF or Mediator. To study if VEGF-regulated compartments could be regulated by super-enhancers, we used the catalog of super-enhancers created for various human cell types based on H3K27ac ChIP-Seq data (31). To our surprise, significant fraction of 63% of VEGF-regulated compartments (51/81) coincided with HUVEC-specific super-enhancers (31) compared to 23% of all compartments (461/2022) (hypergeom. test P < 2E-15; Supplementary Table S3B). The super-enhancers represented 12% (670/5369) of all the H3K27ac regions within the VEGF-regulated compartments and were associated with genes that were generally expressed at higher levels than genes associated with typical enhancers (Figure 6C) (48). Interestingly, at the promoters that exhibit interactions with super-enhancers, higher levels of transcriptional induction and repression were observed than at the promoters that interact with normal enhancers (Figure 6D).
As super-enhancers are densely occupied by master regulators, we next investigated the role of endothelial cell-specific lineage-determining factors ETS1, AP-1 (cJUN/cFOS) and GATA2 in defining the interactions within VEGF-regulated chromatin compartments. Indeed, we saw significant enrichment of ETS1, cFOS and GATA2 peaks at the interaction endpoints looping with promoters of VEGF-regulated genes (Figure 6E). More detailed analysis of the compartments enriched for up- or downregulated genes demonstrated that the upregulated gene promoters exhibit more interactions with regions bound by cJUN, cFOS and GATA2 compared to non-regulated gene promoters or the genes within the downregulated compartments (Figure 6E). Altogether this suggests that clusters of enhancers, through the binding of endothelial specific transcription factors, participate in the establishment of interactions within VEGF-regulated chromatin compartments and could thus be responsible for targeting specific chromatin compartments for regulation.
Recent studies suggest that much of disease-associated DNA sequence variation occurs at enhancers and is further enriched at super-enhancers (31,49). To investigate whether DNA sequence variation or disease-associated genes occur at VEGF-regulated compartments, we used the list of 15 328 SNPs from NHGRI Catalog of Published GWAS and 16 658 genes from DisGeNET database (32,33). We found that VEGF-regulated compartments are enriched for trait-associated SNPs (hypergeometric test P-value = 2.5E-11) and especially SNPs linked to CVDs (P-value = 1.2E-13; Figure 6F). The majority of trait-associated SNPs were located at intergenic (33%) or intronic regions (51%) and were further enriched in super-enhancers compared to typical enhancers (hypergeometric test P-value = 0.00004). Supporting the regulatory role of these SNPs, VEGF-regulated compartments were also enriched for CVD-associated genes (P-value = 0.0016; Figure 6G). The enrichment for GWAS, SNPs and disease-associated genes was also evident at the level of interactions as interaction endpoints associated with VEGF regulated compartments were more highly enriched for these features compared to interactions associated with random compartments (GWAS SNPs: P-value 3.5E-05 versus 0.2; DisGeNET genes: P-value 5E-72 versus 1.5E-15, respectively). An example of such interaction is presented for the inflammatory CXCL8 gene, which is contacted by an enhancer region containing disease-associated SNP (rs1371799) 370 kB downstream of the gene (Figure 6H). In line with inflammatory gene regulation, this SNP has been found to be associated with white blood cell count in African American populations (50). Altogether, these results suggest that altered expression of genes within VEGF-regulated chromatin compartments may contribute to disease.
Transcriptional activity reflects the boundaries of chromatin compartments
It has been shown that the chromatin compartments and topological domains are highly similar between cell types (16,17). Indeed, only ∼10% of HUVEC compartments showed regions with significantly different boundaries compared to compartments determined from the published hESC1 or IMR90 HiC data (Figure 7A, Supplementary Figure S7A, Supplementary Table S3E) (17). However, to our surprise, 33% (27/81; hypergeom. test P > 0.002) compartments containing VEGF-regulated genes and 81% (13/16; hypergeom. test P > 1.5E-7) of compartments enriched for upregulated genes overlapped with HUVEC-specific chromatin compartments suggesting an important role for cell type-specific chromatin organization at these regions.
Figure 7.
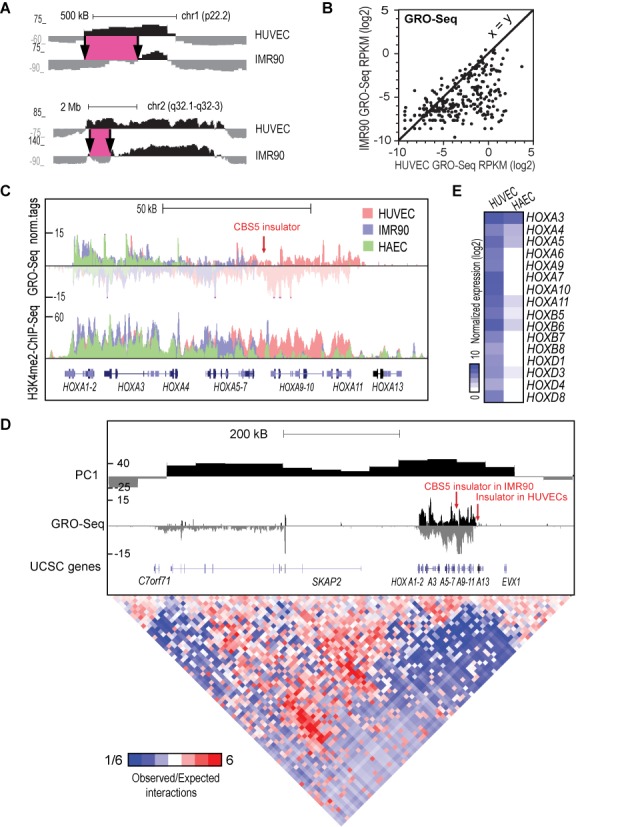
Transcriptional activity reflects the boundaries of chromatin interactions. (A) The PC1 values segregating chromatin into active (positive) and inactive (negative) compartments (50 kb resolution) are shown for two representative regions exhibiting HUVEC-specific compartmental boundaries compared to IMR90 (17). The differential regions are highlighted in pink. (B) Comparison of amount of GRO-Seq signal in HUVEC and IMR90 cells within HUVEC-specific compartments. (C) UCSC Genome Browser image for the HOXA locus (chr7:27,130,000-27,241,000). Normalized tag counts for GRO-Seq and H3K4me2-ChIP-Seq are shown for HUVEC, HAEC and IMR90 cells. The location of CBS5-insulator in IMR90 cells is indicated by an arrow. (D) Two-dimensional heat map surrounding the HOXA locus in HUVECs. The PC1 values (50 kb resolution) are shown together with normalized GRO-Seq tags above the heat map. Ratio of observed interactions relative to expected interactions from background model (normalizing for sequencing coverage and distance between loci) across chr7:26,600,000-27,401,000 at 10 kb resolution is shown. The location of CBS5-insulator in IMR90 cells and potential insulator region in HUVECs are indicated by an arrow. (E) Heat map of normalized GRO-Seq tags for HOX-transcription factor genes showing differential gene expression between HUVEC and HAEC cells.
We next sought to determine whether transcription itself could participate in defining the HUVEC-specific active compartments. In support of this, the HUVEC-specific chromatin compartments exhibited significantly more (P < 4E-89) GRO-Seq signal in HUVECs compared to IMR90 and hESC1 cells and vice versa (Figure 7B, Supplementary Figure S7B and C). A striking example of transcription-defined compartmental boundary was seen within the VEGF-downregulated HOXA locus (Compartment #1, Figure 7C and E). The HOXA locus was recently shown to separate into two topological domains by an experimentally validated CTCF binding site 5 (CBS5) insulator between HOXA7 and HOXA9 in IMR90 cells (17,51). Based on previous GRO-Seq data from IMR90 cells, it was evident that the insulator also marks the end of transcription (Figure 7C) (40). In contrast, we demonstrate that actively transcribed regions extending from HOXA1 to HOXA11 in HUVECs interact with each other and with other active regions. This active compartment is being followed by an inactive compartment starting from HOX13 (Figure 7D). This suggests that insulator elements within HOXA locus differ in location between cell types. Accordingly, the absence of transcription after HOXA5 gene, which was accompanied by an absence in H3K4me2 mark, could indicate that the location of insulator in HAECs is between HOXA5 and HOXA6 genes (Figure 7C). Altogether, these data suggest that the location of possible insulator regions in HOXA locus is dictated by active transcription in different cell types.
DISCUSSION
Growing evidence suggests that for a large number of human genes a major rate-limiting step in transcription is the transition into productive elongation (4–6). These genes are characterized by paused polymerases at their promoters that are poised to respond to the positive transcription elongation factor P-TEFb and enter into elongation in response to appropriate signals (52,53). Our data suggests that pausing is also a prevalent feature of genes in endothelial cells. Similar proportion, i.e. 40–60%, of active RefSeq genes and VEGF-regulated genes exhibited a paused phenotype, suggesting that VEGF-regulated genes do not form a distinct group of genes. This is in sharp contrast to hypoxia-regulated genes that were previously essentially all shown to be paused during normoxia (54). Our data shows that release of the polymerase into productive elongation is a major mechanism of gene activation and only roughly 40% of the VEGF-induced genes are induced at the level of initiation. The paused VEGF-induced promoters have distinct chromatin signatures characterized by higher levels of H3K4me3, H3K9ac, H3K27ac and binding of p300. These histone marks have been previously identified as the most important features for predicting the amount of Pol II at the promoter but their enrichment does not seem to be sufficient for elongation (39). Our data also demonstrates that cohesin, a central mediator of enhancer–promoter interactions, participates in the regulation of pausing. Cohesin depletion increased transcriptional pausing in HUVECs similarly to what had been previously shown in Drosophila cells suggesting that cohesin might facilitate the escape from the pause to productive elongation (46). Identifying the cis-elements and factors responsible for Pol II escape into productive elongation will be critical for understanding the VEGF-mediated regulation of transcriptional programs and angiogenesis.
Previous studies have shown that TSSs preferentially interact with active enhancer elements (30,55,56). Here, we also show that transcriptionally active genes and enhancers expressing eRNAs are more likely to engage in looping interactions compared to regions devoid of transcription. This is also supported by our observation that HUVEC-specific chromatin compartments are more transcriptionally active in comparison to fibroblasts. However, in the light of current evidence, transcription might just be the mere result of chromatin looping and not required for interactions (19,56). Our data supports a model in which binding of LDTFs is responsible for establishing cell type-specific chromatin compartments by establishing distinct transcription signatures. Binding of LDTFs would then prime chromatin for recruitment of cohesin, mediator and coregulators such as CTCF and p300 that participate in establishing chromatin looping and fine-tuning the transcriptional output such as pausing (46,57,58).
Coregulation of neighboring genes, or genes exhibiting direct or indirect promoter–promoter interactions (genes sharing common enhancers), has been widely described in the literature (19,59,60). Recently, coordinately regulated gene clusters, independent of the distance between genes, were demonstrated to occur for promoters located within the same topological domains at the mouse X-inactivation center (47). Here, we identify large compartments of VEGF-coregulated genes distributed across all human chromosomes, where the similarly regulated genes are distributed to multiple topological domains and are thus distinct from previously described correlations. Elucidation of the mechanism driving this compartmental regulation will be the key to understanding the transcriptional responses to proangiogenic stimuli. To this end, our analysis provides strong support for the role of LDTFs in establishing the interactions needed for VEGF-regulated transcriptional program in endothelial cells. First, the de novo motif analysis of VEGF-regulated compartments shows high enrichment of ETS1, AP-1 and FOXP1 transcription factors. Secondly, we demonstrate that ETS1, AP-1 and GATA2 are enriched at interaction pairs originating from the VEGF-regulated promoters. This could also explain why the HUVEC–specific chromatin compartments colocalize strongly with the compartments enriched for VEGF-(up)regulated genes. Thirdly, our data demonstrates that VEGF-regulated compartments are enriched for clusters of regulatory regions, as evidenced by increased presence of ETS1 binding sites and H3K27ac regions and enrichment for super-enhancers. This suggests that coregulation seen at compartments enriched for VEGF-regulated genes could be due to colocalization of the genes to ‘transcription factories’ (60,61) or to bystander effects caused by transcription factor recruitment to few highly regulated promoters or enhancers. One can speculate that changes in the levels or activity of transcription factors can have a more pronounced ‘mass effect’ at clusters of enhancers compared to common enhancers, explaining compartmental coregulation. Supporting this view, high sensitivity to changes in the level of transcription factors has been previously demonstrated for super-enhancers (48). Nevertheless, further studies are needed to address whether regulation of clusters of enhancers involve different rules of TF-DNA binding, such as higher level of cooperativity, compared to common enhancers (62). We also found that disease-associated SNPs occur at super-enhancers of VEGF-regulated compartments, suggesting that altered expression of gene expression within these compartments may contribute to diseases. The enrichment was most evident for CVD-associated SNPs and genes, providing evidence that angiogenesis could play a role in the disease process. Indeed, angiogenesis has been shown to contribute to atherosclerosis and other CVDs although the causal relationships related to disease progression remain unclear (63). The identification of molecular mechanisms underlying control of transcription and spatial organization of VEGF-regulated chromosome compartments could thus prove valuable for further understanding of endothelial cell function and role in disease.
SUPPLEMENTARY DATA
Supplementary Data are available at NAR Online.
FUNDING
M.U.K was supported by Academy of Finland; Fondation Leducq; Sigrid Jusélius Foundation; Finnish Foundation for Cardiovascular Research; Finnish Cultural Foundation (North Savo Regional Fund). H.N was supported by the Doctoral Program in Molecular Medicine of University of Eastern Finland. C.E.R was supported by the American Heart Association Postdoctoral Fellowship [12POST11760017] and the National Institutes of Health Pathway to Independence Award [1K99HL12348]. E.K. was supported by Eemil Aaltonen Foundation and Orion Farmos Foundation. J.L was supported by Sigrid Juselius Foundation. C.K.G was supported by grants from National Institutes of Health grants [R01 CA17390 and P01 HC088093]. S.Y-H was supported by Academy of Finland and European Research Council Advanced Grant. Funding for open access charge: Institutional funding (University of Eastern Finland).
Conflict of interest statement. None declared.
REFERENCES
- 1.Koch S., Tugues S., Li X., Gualandi L., Claesson-Welsh L. Signal transduction by vascular endothelial growth factor receptors. Biochem. J. 2011;437:169–183. doi: 10.1042/BJ20110301. [DOI] [PubMed] [Google Scholar]
- 2.Schweighofer B., Testori J., Sturtzel C., Sattler S., Mayer H., Wagner O., Bilban M., Hofer E. The VEGF-induced transcriptional response comprises gene clusters at the crossroad of angiogenesis and inflammation. Thromb. Haemost. 2009;102:544–554. doi: 10.1160/TH08-12-0830. [DOI] [PMC free article] [PubMed] [Google Scholar]
- 3.Zhang B., Day D.S., Ho J.W., Song L., Cao J., Christodoulou D., Seidman J.G., Crawford G.E., Park P.J., Pu W.T. A dynamic H3K27ac signature identifies VEGFA-stimulated endothelial enhancers and requires EP300 activity. Genome Res. 2013;23:917–927. doi: 10.1101/gr.149674.112. [DOI] [PMC free article] [PubMed] [Google Scholar]
- 4.Kwak H., Lis J.T. Control of transcriptional elongation. Annu. Rev. Genet. 2013;47:483–508. doi: 10.1146/annurev-genet-110711-155440. [DOI] [PMC free article] [PubMed] [Google Scholar]
- 5.Guo J., Price D.H. RNA polymerase II transcription elongation control. Chem. Rev. 2013;113:8583–8603. doi: 10.1021/cr400105n. [DOI] [PMC free article] [PubMed] [Google Scholar]
- 6.Gaertner B., Zeitlinger J. RNA polymerase II pausing during development. Development. 2014;141:1179–1183. doi: 10.1242/dev.088492. [DOI] [PMC free article] [PubMed] [Google Scholar]
- 7.Gilmour D.S., Lis J.T. RNA polymerase II interacts with the promoter region of the noninduced hsp70 gene in Drosophila melanogaster cells. Mol. Cell. Biol. 1986;6:3984–3989. doi: 10.1128/mcb.6.11.3984. [DOI] [PMC free article] [PubMed] [Google Scholar]
- 8.Rougvie A.E., Lis J.T. The RNA polymerase II molecule at the 5’ end of the uninduced hsp70 gene of D. melanogaster is transcriptionally engaged. Cell. 1988;54:795–804. doi: 10.1016/s0092-8674(88)91087-2. [DOI] [PubMed] [Google Scholar]
- 9.Heintzman N.D., Hon G.C., Hawkins R.D., Kheradpour P., Stark A., Harp L.F., Ye Z., Lee L.K., Stuart R.K., Ching C.W., et al. Histone modifications at human enhancers reflect global cell-type-specific gene expression. Nature. 2009;459:108–112. doi: 10.1038/nature07829. [DOI] [PMC free article] [PubMed] [Google Scholar]
- 10.Visel A., Blow M.J., Li Z., Zhang T., Akiyama J.A., Holt A., Plajzer-Frick I., Shoukry M., Wright C., Chen F., et al. ChIP-seq accurately predicts tissue-specific activity of enhancers. Nature. 2009;457:854–858. doi: 10.1038/nature07730. [DOI] [PMC free article] [PubMed] [Google Scholar]
- 11.Thurman R.E., Rynes E., Humbert R., Vierstra J., Maurano M.T., Haugen E., Sheffield N.C., Stergachis A.B., Wang H., Vernot B., et al. The accessible chromatin landscape of the human genome. Nature. 2012;489:75–82. doi: 10.1038/nature11232. [DOI] [PMC free article] [PubMed] [Google Scholar]
- 12.Heinz S., Benner C., Spann N., Bertolino E., Lin Y.C., Laslo P., Cheng J.X., Murre C., Singh H., Glass C.K. Simple combinations of lineage-determining transcription factors prime cis-regulatory elements required for macrophage and B cell identities. Mol. Cell. 2010;38:576–589. doi: 10.1016/j.molcel.2010.05.004. [DOI] [PMC free article] [PubMed] [Google Scholar]
- 13.Heinz S., Romanoski C.E., Benner C., Allison K.A., Kaikkonen M.U., Orozco L.D., Glass C.K. Effect of natural genetic variation on enhancer selection and function. Nature. 2013;503:487–492. doi: 10.1038/nature12615. [DOI] [PMC free article] [PubMed] [Google Scholar]
- 14.De Val S., Black B.L. Transcriptional control of endothelial cell development. Dev. Cell. 2009;16:180–195. doi: 10.1016/j.devcel.2009.01.014. [DOI] [PMC free article] [PubMed] [Google Scholar]
- 15.Dekker J., Rippe K., Dekker M., Kleckner N. Capturing chromosome conformation. Science. 2002;295:1306–1311. doi: 10.1126/science.1067799. [DOI] [PubMed] [Google Scholar]
- 16.Lieberman-Aiden E., van Berkum N.L., Williams L., Imakaev M., Ragoczy T., Telling A., Amit I., Lajoie B.R., Sabo P.J., Dorschner M.O., et al. Comprehensive mapping of long-range interactions reveals folding principles of the human genome. Science. 2009;326:289–293. doi: 10.1126/science.1181369. [DOI] [PMC free article] [PubMed] [Google Scholar]
- 17.Dixon J.R., Selvaraj S., Yue F., Kim A., Li Y., Shen Y., Hu M., Liu J.S., Ren B. Topological domains in mammalian genomes identified by analysis of chromatin interactions. Nature. 2012;485:376–380. doi: 10.1038/nature11082. [DOI] [PMC free article] [PubMed] [Google Scholar]
- 18.Phillips-Cremins J.E., Sauria M.E., Sanyal A., Gerasimova T.I., Lajoie B.R., Bell J.S., Ong C.T., Hookway T.A., Guo C., Sun Y., et al. Architectural protein subclasses shape 3D organization of genomes during lineage commitment. Cell. 2013;153:1281–1295. doi: 10.1016/j.cell.2013.04.053. [DOI] [PMC free article] [PubMed] [Google Scholar]
- 19.Jin F., Li Y., Dixon J.R., Selvaraj S., Ye Z., Lee A.Y., Yen C.A., Schmitt A.D., Espinoza C.A., Ren B. A high-resolution map of the three-dimensional chromatin interactome in human cells. Nature. 2013;503:290–294. doi: 10.1038/nature12644. [DOI] [PMC free article] [PubMed] [Google Scholar]
- 20.Wang D., Garcia-Bassets I., Benner C., Li W., Su X., Zhou Y., Qiu J., Liu W., Kaikkonen M.U., Ohgi K.A., et al. Reprogramming transcription by distinct classes of enhancers functionally defined by eRNA. Nature. 2011;474:390–394. doi: 10.1038/nature10006. [DOI] [PMC free article] [PubMed] [Google Scholar]
- 21.Escoubet-Lozach L., Benner C., Kaikkonen M.U., Lozach J., Heinz S., Spann N.J., Crotti A., Stender J., Ghisletti S., Reichart D., et al. Mechanisms establishing TLR4-responsive activation states of inflammatory response genes. PLoS Genet. 2011;7:e1002401. doi: 10.1371/journal.pgen.1002401. [DOI] [PMC free article] [PubMed] [Google Scholar]
- 22.Kalhor R., Tjong H., Jayathilaka N., Alber F., Chen L. Genome architectures revealed by tethered chromosome conformation capture and population-based modeling. Nat. Biotechnol. 2012;30:90–98. doi: 10.1038/nbt.2057. [DOI] [PMC free article] [PubMed] [Google Scholar]
- 23.Robinson M.D., McCarthy D.J., Smyth G.K. edgeR: a Bioconductor package for differential expression analysis of digital gene expression data. Bioinformatics. 2010;26:139–140. doi: 10.1093/bioinformatics/btp616. [DOI] [PMC free article] [PubMed] [Google Scholar]
- 24.de Hoon M.J., Imoto S., Nolan J., Miyano S. Open source clustering software. Bioinformatics. 2004;20:1453–1454. doi: 10.1093/bioinformatics/bth078. [DOI] [PubMed] [Google Scholar]
- 25.Saldanha A.J. Java Treeview—extensible visualization of microarray data. Bioinformatics. 2004;20:3246–3248. doi: 10.1093/bioinformatics/bth349. [DOI] [PubMed] [Google Scholar]
- 26.Huang da W., Sherman B.T., Lempicki R.A. Systematic and integrative analysis of large gene lists using DAVID bioinformatics resources. Nat. Protoc. 2009;4:44–57. doi: 10.1038/nprot.2008.211. [DOI] [PubMed] [Google Scholar]
- 27.Huang da W., Sherman B.T., Lempicki R.A. Bioinformatics enrichment tools: paths toward the comprehensive functional analysis of large gene lists. Nucleic Acids Res. 2009;37:1–13. doi: 10.1093/nar/gkn923. [DOI] [PMC free article] [PubMed] [Google Scholar]
- 28.Core L.J., Waterfall J.J., Gilchrist D.A., Fargo D.C., Kwak H., Adelman K., Lis J.T. Defining the status of RNA polymerase at promoters. Cell Rep. 2012;2:1025–1035. doi: 10.1016/j.celrep.2012.08.034. [DOI] [PMC free article] [PubMed] [Google Scholar]
- 29.Kaikkonen M.U., Spann N.J., Heinz S., Romanoski C.E., Allison K.A., Stender J.D., Chun H.B., Tough D.F., Prinjha R.K., Benner C., et al. Remodeling of the enhancer landscape during macrophage activation is coupled to enhancer transcription. Mol. Cell. 2013;51:310–325. doi: 10.1016/j.molcel.2013.07.010. [DOI] [PMC free article] [PubMed] [Google Scholar]
- 30.Lin Y.C., Benner C., Mansson R., Heinz S., Miyazaki K., Miyazaki M., Chandra V., Bossen C., Glass C.K., Murre C. Global changes in the nuclear positioning of genes and intra- and interdomain genomic interactions that orchestrate B cell fate. Nat. Immunol. 2012;13:1196–1204. doi: 10.1038/ni.2432. [DOI] [PMC free article] [PubMed] [Google Scholar]
- 31.Hnisz D., Abraham B.J., Lee T.I., Lau A., Saint-Andre V., Sigova A.A., Hoke H.A., Young R.A. Super-enhancers in the control of cell identity and disease. Cell. 2013;155:934–947. doi: 10.1016/j.cell.2013.09.053. [DOI] [PMC free article] [PubMed] [Google Scholar]
- 32.Bauer-Mehren A., Rautschka M., Sanz F., Furlong L.I. DisGeNET: a Cytoscape plugin to visualize, integrate, search and analyze gene-disease networks. Bioinformatics. 2010;26:2924–2926. doi: 10.1093/bioinformatics/btq538. [DOI] [PubMed] [Google Scholar]
- 33.Hindorff L.A., Sethupathy P., Junkins H.A., Ramos E.M., Mehta J.P., Collins F.S., Manolio T.A. Potential etiologic and functional implications of genome-wide association loci for human diseases and traits. Proc. Natl. Acad. Sci. U.S.A. 2009;106:9362–9367. doi: 10.1073/pnas.0903103106. [DOI] [PMC free article] [PubMed] [Google Scholar]
- 34.Danko C.G., Hah N., Luo X., Martins A.L., Core L., Lis J.T., Siepel A., Kraus W.L. Signaling pathways differentially affect RNA polymerase II initiation, pausing, and elongation rate in cells. Mol. Cell. 2013;50:212–222. doi: 10.1016/j.molcel.2013.02.015. [DOI] [PMC free article] [PubMed] [Google Scholar]
- 35.Ardehali M.B., Lis J.T. Tracking rates of transcription and splicing in vivo. Nat. Struct. Mol. Biol. 2009;16:1123–1124. doi: 10.1038/nsmb1109-1123. [DOI] [PubMed] [Google Scholar]
- 36.Cheung A.C., Cramer P. Structural basis of RNA polymerase II backtracking, arrest and reactivation. Nature. 2011;471:249–253. doi: 10.1038/nature09785. [DOI] [PubMed] [Google Scholar]
- 37.Bernstein B.E., Birney E., Dunham I., Green E.D., Gunter C., Snyder M. An integrated encyclopedia of DNA elements in the human genome. Nature. 2012;489:57–74. doi: 10.1038/nature11247. [DOI] [PMC free article] [PubMed] [Google Scholar]
- 38.Guenther M.G., Levine S.S., Boyer L.A., Jaenisch R., Young R.A. A chromatin landmark and transcription initiation at most promoters in human cells. Cell. 2007;130:77–88. doi: 10.1016/j.cell.2007.05.042. [DOI] [PMC free article] [PubMed] [Google Scholar]
- 39.Chen Y., Jorgensen M., Kolde R., Zhao X., Parker B., Valen E., Wen J., Sandelin A. Prediction of RNA polymerase II recruitment, elongation and stalling from histone modification data. BMC Genomics. 2011;12:544. doi: 10.1186/1471-2164-12-544. [DOI] [PMC free article] [PubMed] [Google Scholar]
- 40.Core L.J., Waterfall J.J., Lis J.T. Nascent RNA sequencing reveals widespread pausing and divergent initiation at human promoters. Science. 2008;322:1845–1848. doi: 10.1126/science.1162228. [DOI] [PMC free article] [PubMed] [Google Scholar]
- 41.Dejana E., Taddei A., Randi A.M. Foxs and Ets in the transcriptional regulation of endothelial cell differentiation and angiogenesis. Biochim. Biophys. Acta. 2007;1775:298–312. doi: 10.1016/j.bbcan.2007.05.003. [DOI] [PubMed] [Google Scholar]
- 42.Zippo A., Serafini R., Rocchigiani M., Pennacchini S., Krepelova A., Oliviero S. Histone crosstalk between H3S10ph and H4K16ac generates a histone code that mediates transcription elongation. Cell. 2009;138:1122–1136. doi: 10.1016/j.cell.2009.07.031. [DOI] [PubMed] [Google Scholar]
- 43.Chopra V.S., Cande J., Hong J.W., Levine M. Stalled Hox promoters as chromosomal boundaries. Genes Dev. 2009;23:1505–1509. doi: 10.1101/gad.1807309. [DOI] [PMC free article] [PubMed] [Google Scholar]
- 44.Liu W., Ma Q., Wong K., Li W., Ohgi K., Zhang J., Aggarwal A.K., Rosenfeld M.G. Brd4 and JMJD6-associated anti-pause enhancers in regulation of transcriptional pause release. Cell. 2013;155:1581–1595. doi: 10.1016/j.cell.2013.10.056. [DOI] [PMC free article] [PubMed] [Google Scholar]
- 45.Seitan V.C., Faure A.J., Zhan Y., McCord R.P., Lajoie B.R., Ing-Simmons E., Lenhard B., Giorgetti L., Heard E., Fisher A.G., et al. Cohesin-based chromatin interactions enable regulated gene expression within preexisting architectural compartments. Genome Res. 2013;23:2066–2077. doi: 10.1101/gr.161620.113. [DOI] [PMC free article] [PubMed] [Google Scholar]
- 46.Schaaf C.A., Kwak H., Koenig A., Misulovin Z., Gohara D.W., Watson A., Zhou Y., Lis J.T., Dorsett D. Genome-wide control of RNA polymerase II activity by cohesin. PLoS Genet. 2013;9:e1003382. doi: 10.1371/journal.pgen.1003382. [DOI] [PMC free article] [PubMed] [Google Scholar]
- 47.Nora E.P., Lajoie B.R., Schulz E.G., Giorgetti L., Okamoto I., Servant N., Piolot T., van Berkum N.L., Meisig J., Sedat J., et al. Spatial partitioning of the regulatory landscape of the X-inactivation centre. Nature. 2012;485:381–385. doi: 10.1038/nature11049. [DOI] [PMC free article] [PubMed] [Google Scholar]
- 48.Whyte W.A., Orlando D.A., Hnisz D., Abraham B.J., Lin C.Y., Kagey M.H., Rahl P.B., Lee T.I., Young R.A. Master transcription factors and mediator establish super-enhancers at key cell identity genes. Cell. 2013;153:307–319. doi: 10.1016/j.cell.2013.03.035. [DOI] [PMC free article] [PubMed] [Google Scholar]
- 49.Visel A., Rubin E.M., Pennacchio L.A. Genomic views of distant-acting enhancers. Nature. 2009;461:199–205. doi: 10.1038/nature08451. [DOI] [PMC free article] [PubMed] [Google Scholar]
- 50.Reiner A.P., Lettre G., Nalls M.A., Ganesh S.K., Mathias R., Austin M.A., Dean E., Arepalli S., Britton A., Chen Z., et al. Genome-wide association study of white blood cell count in 16,388 African Americans: the continental origins and genetic epidemiology network (COGENT) PLoS Genet. 2011;7:e1002108. doi: 10.1371/journal.pgen.1002108. [DOI] [PMC free article] [PubMed] [Google Scholar]
- 51.Kim Y.J., Cecchini K.R., Kim T.H. Conserved, developmentally regulated mechanism couples chromosomal looping and heterochromatin barrier activity at the homeobox gene A locus. Proc. Natl. Acad. Sci. U.S.A. 2011;108:7391–7396. doi: 10.1073/pnas.1018279108. [DOI] [PMC free article] [PubMed] [Google Scholar]
- 52.Marshall N.F., Price D.H. Purification of P-TEFb, a transcription factor required for the transition into productive elongation. J. Biol. Chem. 1995;270:12335–12338. doi: 10.1074/jbc.270.21.12335. [DOI] [PubMed] [Google Scholar]
- 53.Marshall N.F., Peng J., Xie Z., Price D.H. Control of RNA polymerase II elongation potential by a novel carboxyl-terminal domain kinase. J. Biol. Chem. 1996;271:27176–27183. doi: 10.1074/jbc.271.43.27176. [DOI] [PubMed] [Google Scholar]
- 54.Galbraith M.D., Allen M.A., Bensard C.L., Wang X., Schwinn M.K., Qin B., Long H.W., Daniels D.L., Hahn W.C., Dowell R.D., et al. HIF1A employs CDK8-mediator to stimulate RNAPII elongation in response to hypoxia. Cell. 2013;153:1327–1339. doi: 10.1016/j.cell.2013.04.048. [DOI] [PMC free article] [PubMed] [Google Scholar]
- 55.Sanyal A., Lajoie B.R., Jain G., Dekker J. The long-range interaction landscape of gene promoters. Nature. 2012;489:109–113. doi: 10.1038/nature11279. [DOI] [PMC free article] [PubMed] [Google Scholar]
- 56.Hah N., Murakami S., Nagari A., Danko C.G., Kraus W.L. Enhancer transcripts mark active estrogen receptor binding sites. Genome Res. 2013;23:1210–1223. doi: 10.1101/gr.152306.112. [DOI] [PMC free article] [PubMed] [Google Scholar]
- 57.Kagey M.H., Newman J.J., Bilodeau S., Zhan Y., Orlando D.A., van Berkum N.L., Ebmeier C.C., Goossens J., Rahl P.B., Levine S.S., et al. Mediator and cohesin connect gene expression and chromatin architecture. Nature. 2010;467:430–435. doi: 10.1038/nature09380. [DOI] [PMC free article] [PubMed] [Google Scholar]
- 58.Schmidt D., Schwalie P.C., Ross-Innes C.S., Hurtado A., Brown G.D., Carroll J.S., Flicek P., Odom D.T. A CTCF-independent role for cohesin in tissue-specific transcription. Genome Res. 2010;20:578–588. doi: 10.1101/gr.100479.109. [DOI] [PMC free article] [PubMed] [Google Scholar]
- 59.Caron H., van Schaik B., van der Mee M., Baas F., Riggins G., van Sluis P., Hermus M.C., van Asperen R., Boon K., Voute P.A., et al. The human transcriptome map: clustering of highly expressed genes in chromosomal domains. Science. 2001;291:1289–1292. doi: 10.1126/science.1056794. [DOI] [PubMed] [Google Scholar]
- 60.Li G., Ruan X., Auerbach R.K., Sandhu K.S., Zheng M., Wang P., Poh H.M., Goh Y., Lim J., Zhang J., et al. Extensive promoter-centered chromatin interactions provide a topological basis for transcription regulation. Cell. 2012;148:84–98. doi: 10.1016/j.cell.2011.12.014. [DOI] [PMC free article] [PubMed] [Google Scholar]
- 61.Cook P.R. The organization of replication and transcription. Science. 1999;284:1790–1795. doi: 10.1126/science.284.5421.1790. [DOI] [PubMed] [Google Scholar]
- 62.Slattery M., Zhou T., Yang L., Dantas Machado A.C., Gordan R., Rohs R. Absence of a simple code: how transcription factors read the genome. Trends Biochem. Sci. 2014;39:381–399. doi: 10.1016/j.tibs.2014.07.002. [DOI] [PMC free article] [PubMed] [Google Scholar]
- 63.Sluimer J.C., Daemen M.J. Novel concepts in atherogenesis: angiogenesis and hypoxia in atherosclerosis. J. Pathol. 2009;218:7–29. doi: 10.1002/path.2518. [DOI] [PubMed] [Google Scholar]
Associated Data
This section collects any data citations, data availability statements, or supplementary materials included in this article.