


Abstract
While individual non-B DNA structures have been shown to impact gene expression, their broad regulatory role remains elusive. We utilized genomic variants and expression quantitative trait loci (eQTL) data to analyze genome-wide variation propensities of potential non-B DNA regions and their relation to gene expression. Independent of genomic location, these regions were enriched in nucleotide variants. Our results are consistent with previously observed mutagenic properties of these regions and counter a previous study concluding that G-quadruplex regions have a reduced frequency of variants. While such mutagenicity might undermine functionality of these elements, we identified in potential non-B DNA regions a signature of negative selection. Yet, we found a depletion of eQTL-associated variants in potential non-B DNA regions, opposite to what might be expected from their proposed regulatory role. However, we also observed that genes downstream of potential non-B DNA regions showed higher expression variation between individuals. This coupling between mutagenicity and tolerance for expression variability of downstream genes may be a result of evolutionary adaptation, which allows reconciling mutagenicity of non-B DNA structures with their location in functionally important regions and their potential regulatory role.
INTRODUCTION
DNA usually assumes a right-handed double helix conformation—termed B DNA (1,2). DNA can also take on non-canonical conformations, referred to collectively as non-B DNA (3,4). Several types of non-B DNA have been distinguished, including the four-stranded structure called a ‘G-quadruplex’ (5,6), left-handed Z DNA (7,8), the slipped strand DNA structure (9), the Holliday junction structure—here called a ‘cruciform’ (10), triple-stranded structure H DNA (11,12) and stress-induced duplex destabilization (SIDD) sites (13). Formation of non-B DNA structures in vitro is well established (14) and there is increasing evidence that they also form in vivo (15,16). A necessary, but not sufficient, condition for formation of a non-B DNA structure is a compatible nucleotide sequence; we refer to such sequences as potential non-B DNA. Formation of a non-B DNA structure within a cell rests on additional factors, for example, torsional stress resulting from supercoiling induced by transcriptional activity of downstream genes (17,18). In addition, formation of such structures is expected to be context-dependent; for example, structure formation may depend on the existence of other competing non-B DNA susceptible sequences in the region (18,19).
Non-B DNA structures have been indicated to play important roles in biological processes including replication, transcription and translation (20), and are proposed to play important roles in adaptation during evolution (21). Consistent with these observations, some types of potential non-B DNA regions are enriched in functionally important regions in the genomes of a broad range of organisms (22–32). The enrichment in functional regions might suggest a higher-than-average conservation (22,33). Consistent with this view, Capra et al. showed that potential G-quadruplex regions were evolutionarily conserved in yeast (22). An earlier study based on a large repository of human single nucleotide polymorphisms (SNPs) indicated that there was a lower density of SNPs in potential G-quadruplex regions compared to the genomic background regions with similar GC content (33).
However, potential non-B DNA regions have been also shown to be mutagenic (34–40). Both specific sequence patterns defining potential non-B DNA regions and formation of actual structures were proposed to play a role in mutagenicity of these regions. For example, non-B DNA structures can interfere with DNA replication and repair, increasing mutation frequency (39). Possible mechanisms include stalling of replication forks, which would in turn give rise to longer exposure of single-stranded DNA (ssDNA) and may cause replication fork collapse (21). In addition, repetitive sequences capable of forming non-B DNA are found at sites of chromosomal breaks, copy number variations (CNVs) and other rearrangements (41).
It is important to reconcile these apparently paradoxical findings on a genome-wide basis. Sequence changes within potential non-B DNA regions may perturb expression of nearby genes, and, as a result, play a causal role in disease development (42–44). Since previous studies focused on either mutagenic or regulatory roles, understanding of those two issues together remains incomplete for the human genome.
The expression of several genes has been shown to be dependent on non-B DNA formation. An important example is the mammalian proto-oncogene c-MYC, which has several potential non-B DNA sequences in its promoter region (45,46). For c-MYC, there are two upstream regulatory elements, called FUSE (far upstream element) and NHE III1 (five repeats of the sequence (C/T)C(C/T)TCCCCA). The FUSE is actually a SIDD site (47) and the NHE III1 interval contains G-quadruplex and H DNA sequences (48–50). Also, transcription of c-MYC in permeabilized nuclei is associated with three discrete Z DNA formations in its promoter region (51).
If the formation of non-B DNA structures is related to gene expression, then mutations in those elements would be expected to affect gene expression. In the case of c-MYC, a mutagenesis experiment showed that a single G to A transition in a potential G-quadruplex region resulted in a 3-fold increase in basal transcriptional activity of c-MYC (52). Several less directed studies suggested that alterations in gene expression were in part attributable to the regulatory potential of non-B DNA regions (53–55).
How can mutagenicity and regulatory potential coexist without compromising cell function? With the accumulation of next-generation high-throughput data, we have a new opportunity to gain insight into this potential paradox. In this study, using nucleotide variant data (including both SNPs and short indels) from the 1000 Genomes Project (56) and recently generated eQTL data (57), we examined, for the first time in such a large dataset, both the frequency of nucleotide variants within potential non-B DNA regions and their effect on gene expression. As expected, we found a higher density of nucleotide variants in potential non-B DNA regions. The enrichment in nucleotide variants was independent of genic locations, and was also observed in genomic regions that are conserved between human and chimpanzee. Surprisingly, we found that eQTL-associated nucleotide variants (eQTL variants) were not enriched in potential non-B DNA structures. Instead, we identified a correlation of the number of potential non-B DNA regions with expression variation of the downstream genes, even after controlling for expression mean. This coupling between mutagenicity and tolerance for expression variability of downstream genes may be a result of evolutionary adaptation, which allows reconciling mutagenicity of non-B DNA structures with their location in functionally important regions and their potential regulatory role.
MATERIALS AND METHODS
Human genome and gene annotation data
The human genome NCBI Build 37 annotation release 105 (GRCh37.p13, hg19) was downloaded from the National Center for Biotechnology Information (NCBI) ftp site (58). Only the assembled reference autosomes were used. Gene annotation corresponding to NCBI Homo sapiens Annotation Release 105 was obtained from the RefSeq (59) database. Only transcripts whose identifiers started with NM (protein-coding transcripts of the most confidently validated type) were used.
Genic regions
We defined the transcription start site (TSS) of a gene as the start of transcription that, among all transcripts of the gene, was most 5′ with respect to the coding strand. Similarly, the transcription termination site (TTS) of a gene was defined as the most 3′ end of transcription among all transcripts. The start codon of a gene was defined as the most 5′ start codon among all transcripts of that gene with respect to the coding strand, and the stop codon of a gene was defined as the most 3′ stop codon among all transcripts. Those were done for 18 255 protein coding genes used in this study. The gene-5′ region of a protein coding gene was defined as the interval starting 2 kb upstream of the TSS of that gene and extending up to 1 kb downstream of TSS of that gene, but not beyond the start codon of that gene. The gene-3′ region of a protein coding gene was defined similarly as extending back from 2 kb downstream of the TTS to at most 1 kb upstream region of TTS, but not beyond the stop codon of that gene.
In this study, we distinguish intergenic regions from protein coding genes, and within protein coding genes, we distinguish 5′-UTR, 3′-UTR, exon (including UTR) and intron regions. An intergenic region is defined to be a region that does not lie between the TSS and TTS of any gene. A total of 16 882 intergenic regions were used in this study—the number of intergenic regions is smaller than the number of protein coding genes because some pairs of genes overlap. The 5′-UTR region of a gene was defined as the union of 5′-UTR regions for all transcripts from the same gene, and the 3′-UTR region was defined as the union of 3′-UTR regions for all transcripts from the same gene. UTR regions of a gene can be, and frequently are, discontinuous because the UTR regions of all transcripts of the gene do not overlap. Similarly, the exon region of a gene was defined as the union region of all exons (including UTR regions) from all transcripts of the same gene. To deal with overlapping genes, we merged the gene-5′ regions, gene 3′-regions, 5′-UTR, 3′-UTR and exon regions of all genes when counting variants and non-B DNA regions, counting each nucleotide at most once for each type of region. Intronic regions were defined as consisting of any nucleotide between the TSS and TTS of any protein coding gene, but not in an exon of any (not necessarily the same) gene.
As a control, 500 000 regions with length 50 nucleotides were sampled from the autosomes randomly without replacement and forbidding overlaps between pairs of sampled 50 nucleotide regions or regions that contain the ambiguity character ‘N’, which often indicates gaps in the alignment.
See Supplementary Table S1 for detailed statistics of all genic regions discussed in this subsection.
Identification of potential non-B DNA regions
Non-B DNA regions were identified in silico on the human autosomes. Potential G-quadruplex regions in this study were predicted using QuadParser (60) with G bases required in each G monomer repeat and four repeats in the sequence, minimum gap size between repeats of 1, and maximum gap size of 7. Both G- and C-patterns were searched in order to identify potential G-quadruplex regions on both strands. Potential Z-DNA regions were predicted using the program Z-hunt II (61) with a probability/propensity score of no less than 500, and using the SIBZ program (62) as B-DNA to Z-DNA transition sites with maximal sequences of consecutive base pairs that have transition probability >0.5 at temperature 310 K and superhelical density σ = −0.06. The results from both programs were consistent and in the figures and tables, we show only the results obtained with Z-hunt II. However, since the SIBZ program directly estimates the probability of B-Z transition, the analysis the potential impact of SNPs on formation of Z-DNA was done with the SIBZ program only.
Potential slipped DNA regions were predicted using the TRF program (version 4.04) (63) with scores no less than 60 and repeat lengths between 8 nucleotides and 50 nucleotides, inclusive. Potential cruciform regions were predicted using the software IRF (version 3.05) (64) with scores exceeding a threshold of 16 and loop length between 1 nucleotide and 10 nucleotides, inclusive. Potential H-DNA regions were predicted using the Triplex package from Bioconductor (version 2.13) (65) with score no less than 18 and maximum length 100 nucleotides. SIDD sites are regions where DNA strand separation is favored at equilibrium under negative superhelical stress (31). Potential SIDD regions were sites with minimum destabilization energy no more than 3.0 kcal/mol calculated using the SIDD prediction algorithm of (62) at temperature 310°K and superhelical density σ = −0.055. For potential Z-DNA, slipped DNA, cruciform, H-DNA and SIDD regions, overlapping intervals of the same type were merged. QuadParser automatically merges overlapping potential G-quadruplex regions on the same strand; when strand information was not considered, we also merged potential G-quadruplex found on opposite strands.
A neighbor region for a specific potential non-B DNA region was defined as the union of the two adjacent intervals on either side, each with half the length of the potential non-B DNA region. For regions with odd length, the flanking 3′-region, as determined by the reference strand read from the p-telomere to the q-telomere, was made one base longer. Since the hypothesized effect of the potential non-B DNA regions depends on the local genetic context, always adding a base to the q-telomeric end is not expected to bias the results. If all types of potential non-B DNA regions were considered as one single type—non-B DNA region—overlapping regions from different types were merged as one single contiguous region and the neighbor region was defined accordingly based on this merged region. If a neighbor region, as defined above, overlapped with a potential non-B DNA region of the same type, the neighbor region was truncated to eliminate the overlap.
See Supplementary Table S1 for detailed statistics of the potential non-B DNA regions discussed in this subsection.
Nucleotide variants, eQTLs and expression data
Data on genomic nucleotide variants, including SNPs and short insertions and deletions (indels), for the CEU population—a population of individuals with Northern and Western European ancestry who are mostly residents of Utah—were downloaded from the 1000 Genomes Project website (56) from the phase 1 dataset. Position information (hg19) assigned by the 1000 Genomes dataset for SNPs and indels was used. A total of 6 500 134 autosomal nucleotide variants with minor allele frequency (MAF) no less than 0.05 were used in this study. A dataset of eQTLs for the CEU population (lymphoblastoid cell line K562) from a recent study was used as an indication of functional nucleotide variants (57). To correct the potential biases in the selection of probes used in identification of these eQTLs, variants in linkage disequilibrium (LD) with any of the identified eQTL were also considered as if they were functional eQTL variants; LD between two variants was defined as having r2 no less than 0.6 measured among the CEU population. The total number of putative functional nucleotide variants, including the eQTLs identified in (15) and LD-related variants, is 314 632. We refer to this combined dataset as eQTL variants. The corresponding normalized expression data for CEU population were downloaded from ArrayExpress (E-MTAB-198) (66). The coefficient of variation was taken as the measure of variation of expression among samples (individuals from CEU). If there was more than one expression measure for a gene from multiple reporters with distinct oligonucleotides, the variation of each reporter was calculated individually and the average of these variations was used as the variation of the gene.
Analysis of disruptive nucleotide variants
Among the structures considered, only for Z-DNA does there exist a program (SIBZ) that evaluates the probability of formation of structure based on biophysical principles. For SIBZ, we assumed that the Z-DNA length is 12 nucleotides, and we considered a Z-DNA to be destroyed if the probability of its formation drops below 50%. In all other cases, as a proxy, we defined a variant to be disruptive if the corresponding prediction program with the same parameter setting did not predict the structure in the sequence with variant(s). We considered each potential non-B region only once and, if there were multiple variants in a given potential non-B DNA region, we considered it to be disrupted if at least one variant was disruptive. The working definitions of intergenic and gene-5′ regions are used as described above, except that intergenic regions for this analysis also exclude any gene-5′ or gene-3′ regions defined above.
Experimentally identified regions
For transcription factors binding sites we used ChIP-seq data from human-derived lympoblastoid cell line K562 downloaded from the ENCODE database (67). Coordinates of binding locations were provided with respect to the NCBI human genome build 37. Only data from the Myers Lab at the Hudson Alpha Institute for Biotechnology (ENCODE/HAIB) were used in this study (see protocol online for details on http://hudsonalpha.org/myers-lab/protocols). We identified transcription factor binding sites (TFBS) based on peaks of signals indicating occupancy of any one of 47 transcription factors. If there were multiple replicates for the same transcription factor, only overlapping regions from different replicates were considered as TFBS of that transcription factor. TFBS regions for different transcription factors were merged and 156 795 non-overlapping TFBS regions were used in this study.
An integrative annotation of chromatin elements (68), also based on ENCODE data, was used to generate other functional regions; again, only data derived from the lymphoblastoid cell line K562 were used. DNase hypersensitive sites identified through DNase-seq from Duke University were defined as open chromatin regions; H3K27me3 signals were used to define repressed regions. Scores were provided as part of the annotation (68). Regions with zero scores from histone modification signals (H3K4me1, H3K4me2, H3K4me3, H3K9ac, H3K27ac, P300 and H3K27me3) and zero scores from open chromatin signals (either from the DNase-seq peaks from Duke University used above to define open chromatin regions, or from either of two additional datasets based on ENCODE data (68,69): DNase-seq peaks from University of Washington or FAIRE-seq peaks from University of North Carolina at Chapel Hill) were defined as quiescent regions. We used a minimum score of 0.8 to identify peaks of open chromatin or repressed regions. We tried other score cut-offs without substantial influence on the results (data not shown). In total, 194 790 open chromatin regions, 23 955 repressed regions and 16 892 quiescent regions were used in this study. Within regulatory marker or open chromatin regions, the subintervals that are not predicted to be non-B DNA regions were designated as ‘B DNA regions,’ with no minimum size for any single region.
See Supplementary Table S1 for detailed statistics of the experimentally identified regions discussed in this subsection.
Conservation groups
Assembled autosomal chromosomes for chimpanzee (Pan_troglodytes-2.1.4, panTro4) and mouse (GRCm38.p2, mm10) were downloaded from the GenBank database (70). For G-quadruplex, Z-DNA, slipped DNA, cruciform and H-DNA, we used the same programs and parameters as in human to identify potential non-B DNA regions in chimpanzee and mouse. Human-chimpanzee (version hg19-panTro4) and human-mouse (version hg19-mm10) alignments were downloaded from the UCSC Genome Browser (71). A potential non-B DNA region from the human genome was defined as ‘not aligned’ if it did not intersect a region of the human genome that was aligned with the chimpanzee genome. A potential non-B DNA region that lies entirely within a region of the human genome that aligns with the chimpanzee genome, and that also overlaps with potential non-B DNA regions of the same type in chimpanzee, was called ‘conserved.’ Otherwise, a potential non-B DNA region that lies totally within a region of the human genome that aligns to the chimpanzee genome, but which was not labeled as ‘conserved’, was said to be ‘aligned but not conserved.’ As a consequence of these definitions, non-B DNA regions that overlap but do not lie totally within regions of the human genome that align with the chimpanzee genome were not included in the calculations. To make strict comparisons, whenever a neighbor region of a potential non-B DNA sequence intersects both aligned and not aligned regions, we did not use the potential non-B DNA region or the neighbor region in the computation. The definitions of ‘not aligned,’ ‘conserved’ and ‘aligned but not conserved’ potential non-B DNA regions from the human genome based on human-mouse alignment followed the same rules.
Statistical analysis
The distribution of potential non-B DNA regions was shown as normalized density in 5 kb upstream and downstream regions around the TSS of protein coding genes in the human genome. The position of each non-B DNA region was identified as its central base (the last base of first half if it has even length). For each type of non-B DNA region, we counted the number of times a potential non-B DNA region was predicted at each position, and then, normalized by number of genes for better comparison. To smooth the distribution, for each position relative to the TSS, we calculated the total number of a particular type of potential non-B DNA region in a 101 base window centered at that position normalized by dividing by the length of 101 bases. To plot and compare the distribution of the frequency of variants as a function of MAF, we did the following steps. First, for each value between 0.1 and 0.45, using 0.01 as step, we counted the number of variants with a MAF within a window of width 0.1 centered that point. Second, we calculated the probability density of these counts as the number of variants counted for each window normalized by the total number of variants counted in all windows with multiplicity. This was done separately for B DNA and potential non-B DNA regions (not including SIDD). Differences between probability densities were evaluated using Kolmogorov–Smirnov tests, as implemented in GNU R (72) (http://www.R-project.org/).
To assess relationships between the local base composition and the distribution of potential non-B DNA regions, we generated randomized sequences preserving position-dependent composition bias for regions upstream and downstream 5 kb around the TSS of protein coding genes. To do so, sequences for all genes were aligned according to the TSS, and then we randomly shuffled nucleotides at each position, generating 18,255 random sequences with the same positional composition as the original regions. Potential non-B DNA regions were predicted based on those randomized sequences using the same prediction programs and parameters as for the real sequences, and the normalized density was calculated as described above for each potential non-B DNA region. This randomization procedure was repeated 100 times and the final normalized density was calculated as the average among those 100 replicates. The18 255 protein coding genes were further partitioned into three groups (high/medium/low GC content groups) each with approximately 6000 genes based on GC content of the intervals 2 kb upstream and downstream of the TSS for each gene. We decided to make the groups of comparable sizes to balance the statistical power, rather than using round number thresholds for GC content. We decided to use 2 kb intervals in this analysis, instead of 5 kb intervals used in other analyses, to capture sharper peaks and valleys of GC content. Normalized densities for those three groups were also shown based on both original and randomized sequences. Since permutation analysis of SIDDs is prohibitively time-consuming, given their depletion around TSS and small role in mutations, we excluded SIDDs from this analysis.
The density of nucleotide variants in each type of genomic region was calculated as the total number of nucleotide variants in that region normalized by the total length of corresponding region. Differences between densities of variants in different regions were evaluated based on χ2 tests of 2 × 2 tables. Each 2 × 2 contingency table was created with rows indicating whether a position belongs to a case region or a control region, and columns indicating whether a variant had been observed or not within a region. The enrichment of eQTL variants in a specific region was measured as a ratio of number of eQTL variants to all nucleotide variants in the corresponding region normalized by the background ratio of number of all eQTL variants to all nucleotide variants from CEU population. Differences between the levels of enrichment of eQTL variants in different regions were also evaluated based on χ2 tests of 2 × 2 tables. Here 2 × 2 contingency tables were used where rows indicated whether a position belongs to a case or control region and columns indicated whether a position is or is not an eQTL variant. For enrichment analysis of structure-disrupting nucleotide variants in potential non-B DNA regions in gene-5′ regions compared to intergenic regions, P-values were calculated based on χ2 tests of 2 × 2 tables with rows indicating whether a case belongs to gene-5′ region or intergenic region, and columns indicating disruptive cases or non-disruptive cases.
Correlations between the number of each potential non-B DNA region type within the gene-5′ region and, either expression mean or expression variation, of the corresponding gene were measured using Spearman rank-order correlation, as implemented in GNU R (72) (http://www.R-project.org/). Partial correlations were also calculated between the number of occurrences of each potential non-B DNA region in the gene-5′ region and expression variation, while controlling for the expression mean. For comparison, correlations were also computed for the previously generated random regions in the gene-5′ region of all protein coding genes in human. The statistical significance of a correlation was assessed by a permutation test. The values for one variable were randomly permuted, so that each value for one variable was randomly paired with a value for the other variable. The correlation for the permuted data was then calculated. This process was repeated 100 000 times and the empirical P-value was taken as the fraction of these correlations that had an absolute value at least as large as the correlation in the observed data.
RESULTS
Distribution of potential non-B DNA regions
One of the arguments often used in supporting of regulatory role of non-B DNA structures is the accumulation of potential non-B DNA regions in gene promoter regions. Therefore, we started with an analysis of the distribution of potential non-B DNA regions with respect to the TSS of protein coding genes in the human genome. While the distribution of some non-B DNA structures in the human genome has been analyzed before (23,29,73–75), no systematic attempt has been made to test if similar distributions would be obtained by chance based on position-specific nucleotide distribution alone. Similarity of the ‘by chance’ distribution to the actual distribution would support the hypothesis that potential non-B DNA regions were favored as byproducts of unrelated evolutionary pressures.
In agreement with previous results (23,26,29,31,76), several types of potential non-B DNA regions showed an enrichment around the TSS of protein coding genes (Figure 1, solid curves). These enriched structures include G-quadruplex (Figure 1A and B), Z-DNA (Figure 1C) and slipped DNA (Figure 1D). Since the formation of a G-quadruplex involves a single strand, we estimated the distribution of potential G-quadruplex regions on the template and non-template strands separately. There is an asymmetry with respect to the occurrences of potential G-quadruplex regions on each of the two strands: while potential G-quadruplex regions on the template strand showed a single peak upstream of TSS (Figure 1A), there was an additional peak downstream of TSS for potential G-quadruplex regions on the non-template strand (Figure 1B). This asymmetry was also observed previously by other researchers (77,78). For potential cruciform regions, the peak near TSS is very small with respect to the baseline level (Figure 1E). Potential H-DNA and SIDD regions were depleted near TSS (Figure 1F and G).
Figure 1.

Distribution of potential non-B DNA regions. Distributions of (A) G-quadruplex in template strand, (B) G-quadruplex in non-template strand, (C) Z-DNA, (D) slipped DNA, (E) cruciform, (F) H-DNA and (G) SIDD are shown as normalized densities in the 5 kb upstream and downstream region around the TSS of human protein coding genes. This was done based on central base of each potential non-B DNA region. The normalized density was defined as the number of structures in each position normalized by the number of total genes. For smoothing, for each position, potential non-B DNA regions were counted within a 101-nucleotide window centered at that position, and then normalized by the length of the window. Normalized densities are also shown for randomized sequences (dotted curves, not for SIDD). The randomized sequences were generated from original sequences aligned according to the TSS of genes, while keeping nucleotide composition for each position (see Materials and Methods for details). Each of the density computations in panels (A) through (F) was done for all genes together and for three disjoint high, medium and low GC content gene groups.
We next tested whether positional biases in composition alone could give rise to the observed profile of potential non-B DNA regions. To obtain random sequences with the same nucleotide bias including the dependence of this bias on the distance from TSS, we aligned protein coding genes with respect to TSS and permuted nucleotides among the sequences while preserving their distance to TSS (77) (see Materials and Methods subsection entitled ‘Statistical analysis’ for details of the randomization procedure). Interestingly, randomized sequences also showed enrichment of corresponding potential non-B DNA regions and in the case of Z-DNA, the number of such regions in the permuted sequences was very high (Figure 1A–F). An exception was H-DNA, which was rarely predicted to occur in randomized sequences.
To control for biases due to differences in local GC content of genes, we performed additional experiments in which we partitioned genes into groups with high, medium or low GC content near the TSS, as described in Materials and Methods, subsection entitled ‘Statistical analysis.’ As we had done for the full set of protein coding genes, we generated three sets of control sequences for each of the three groups of genes. Higher GC content generally corresponded to higher enrichment of potential non-B DNA regions with the ratio of the area under curve for the genes with high GC versus low GC bigger than 1.0, indicating that GC content contributes to the enrichment of potential non-B DNA regions. GC content typically does not explain the enrichment entirely, as there are more potential non-B DNA regions than would be expected based on nucleotide frequencies alone. An interesting exception are potential Z-DNA regions, where except for the sharp peak in the upstream region of TSS, the enrichment for potential Z-DNA regions could be largely explained by the GC distribution (Figure 1C).
Given the enrichment of some types of potential non-B DNA regions in the vicinity of TSS, one could expect a depletion of mutation that destroys these structures in this genomic region. We tested this hypothesis for all ‘structural’ non-B DNA elements (thus excluding SIDDs). Unfortunately, among the structures considered, only for Z-DNA does there exist a program (SIBZ) that evaluates the probability of formation of structure based on biophysical principles. In all other cases, as a proxy, we defined a variant to be disruptive if the corresponding prediction program failed to detect the structure in the mutated sequence (see Materials and Methods, subsection entitled ‘Analysis of disruptive nucleotide variants’ for more details).
Using the intergenic regions as reference, we asked whether gene-5′ regions were enriched or depleted in disruptive variants. The structures that are enriched around TSS with a large enrichment of these structures relative to random (G-quadruplex and slipped DNA) indeed show a depletion of disruptive variants. The remaining structures are either enriched with disruptive variations in the gene-5′ regions (Z-DNA and cruciform) or show no statistical difference (H-DNA) (Table 1).
Table 1. Enrichment analysis of structure-disrupting nucleotide variants in potential non-B DNA regions in gene-5′ region versus intergenic regions.
| Non-B DNA | Gene-5' | Intergenic | Disruptive enrichment | P-value (χ2 test) | ||||
|---|---|---|---|---|---|---|---|---|
| Disruptive | Total | Fraction | Disruptive | Total | Fraction | |||
| G-quadruplex | 497 | 2323 | 0.21 | 3711 | 15958 | 0.23 | Intergenic | 0.0496 |
| Z-DNA (Z-hunt) | 93 | 826 | 0.11 | 1164 | 13105 | 0.09 | Gene-5′ | 0.0004 |
| Z-DNA (SIBZ) | 36 | 264 | 0.14 | 359 | 7124 | 0.05 | Gene-5′ | 2.55e-9 |
| Slipped DNA | 997 | 3991 | 0.25 | 30024 | 99763 | 0.30 | Intergenic | 4.56e-9 |
| Cruciform | 609 | 1410 | 0.43 | 24195 | 63754 | 0.38 | Gene-5′ | 6.85e-5 |
| H-DNA | 460 | 3194 | 0.14 | 16987 | 115567 | 0.15 | N/A | 0.654 |
P-values were calculated based on chi-square tests of 2 × 2 tables with rows indicating whether a case belongs to a gene-5′ region or an intergenic region, and columns indicating disruptive cases or non-disruptive cases.
Mutagenicity of potential non-B DNA regions
Previous results indicate that potential non-B DNA regions are mutagenic. Since mutagenicity might undermine functionality of these regions, we next analyzed the distribution of nucleotide variations in potential non-B DNA regions stratifying by genomic location. First, we observed that there was an enrichment of nucleotide variants in potential structural non-B DNA regions (Figure 2A). When compared to random regions, known functionally important regions, such as 5′-UTR, 3′-UTR and exon regions, were more conserved with fewer nucleotide variants (Figure 2A). Next, since different types of potential non-B DNA regions showed different patterns near TSS (Figure 1), we asked the two-part question: is the enrichment of nucleotide variants different for different potential types of non-B DNA regions and/or is the enrichment of nucleotide variants different in different genomic regions? Investigating individual non-B DNA types separately and genomic regions separately, we found that for almost all potential non-B DNA types and all genomic region categories, there were significantly more nucleotide variants in potential non-B DNA regions relative to random sequences from the corresponding genomic region category (Figure 2B). Additional analysis (data not shown) indicated that the enrichment of variants is not dependent on the presence or absence of CpG sites. These observations are consistent with high mutagenicity of regions susceptible to forming non-B DNA.
Figure 2.

Mutagenicity of potential non-B DNA regions. (A) Variant densities of different genetic regions compared to randomly selected regions. See Materials and Methods, subsection entitled ‘Genic regions,’ for the detailed definitions of different regions. Variant density was defined as total number of nucleotide variants in a specific region normalized by total length of that region. (B) Variant densities of individual potential non-B DNA regions in different genetic regions compared to randomly selected regions. (C) Variant density of potential non-B DNA regions (not including SIDD) with different conservation levels. The calculation was done based on potential non-B DNA regions in human genome. Potential non-B DNA regions were classified as one of: ‘not aligned,’ ‘aligned but not conserved’ or ‘conserved’ based on genome alignment of human-chimpanzee (see Materials and Methods for details). The neighbor region for a specific non-B DNA region was defined as the upstream and downstream region, with each portion having half the length of the corresponding potential non-B DNA region. (D) Probability density of nucleotide variants as a function of their MAF. The probability density here was defined as number of nucleotide variants with a specific MAF, ranging from 0.05 to 0.5 using 0.01 as the step and smoothed by a window of 0.1 centered at each step, normalized by total number of nucleotide variants. Probability densities for all nucleotide variants (solid curve) and variants only in potential non-B DNA regions (dotted curve, not including SIDD) were shown. The differences between variant densities were evaluated through χ2 tests of 2 × 2 tables (see Materials and Methods for details). Differences between probability densities were evaluated using the Kolmogorov–Smirnov test. The significance level was categorized as: ***P-value < 0.001; **P-value < 0.01; *P-value < 0.05.
The result that potential G-quadruplex regions have a higher frequency of variants than similar non-G-quadrulex regions is not consistent with the results of Nakken et al. (33). We therefore repeated their experiments, albeit with newer versions of several databases. The investigation suggested that the difference is likely due to two factors: the lack of indels in their set of tested variants and their exclusion of repetitive regions (Supplementary Table S2). Their decision to use only SNPs reflects the availability of data when the study was performed; the version of dbSNP (79) used by Nakken et al., had few indels. Our analyses do not support the decision to filter repetitive regions, because we found that potential G-quadruplex regions are often masked as repeats, even when they occur in a genic region and have regulatory potential. We discuss details about the attempted replication of the experiments in Nakken et al. (33) in the Supplementary Data.
Previous studies showed that some functional non-B DNA regions were conserved between different species of yeast (22). The fact that conserved regions are more likely to be functionally important provides an opportunity for an alternative stratification of potential non-B DNA regions. We divided potential non-B DNA regions into three groups based on their conservation utilizing an alignment of human-chimpanzee genomes: not aligned, aligned but not conserved and conserved (see Materials and Methods for details). We observed consistent enrichment of nucleotide variants in potential non-B DNA regions in all three groups (Figure 2C, see Supplementary Figure S1 for similar results based on data from human and mouse). Thus, even potential non-B DNA regions that, based on its conservation, are more likely to contain functionally important elements are more polymorphic than their neighbor regions.
Having confirmed a universal association between nucleotide variants and regions with non-B DNA potential, we graphed the density of the number of nucleotide variants as the function of MAF for all variants (Figure 2D, solid curve) and for variants within potential non-B DNA regions excluding SIDDs (Figure 2D, dotted curve). The analysis uncovered that potential non-B-DNA regions are enriched in nucleotide variants with small MAF values (P-value < 2.2e-16, Kolmogorov–Smirnov test). Such enrichment is considered to be a signature of negative (purifying) selection (56). To make sure that the observed signal is not due to selective sweeps and to assess possible impact of positive selection, we analyzed the data using precomputed integrated Haplotype Scores (iHS) (80), a normalized scoring system based on the test statistic EHH (extended haplotype homozygosity) proposed by Sabeti et al. (81). Specifically, iHS measures selection toward new alleles. Association of potential non-B DNA region associated SNPs with a signature of positive selection would be also interesting from the perspective of a potential role for biased gene conversion in the evolution of these structures. However, the current data do not support enrichment in positive selection (Supplementary Tables S3–S6, see the Supplementary Data for details). No enrichment was observed either when restricting our analysis to only SNPs with a MAF of 5–10% (data not shown).
eQTLs are depleted in potential non-B DNA regions
Formation of non-B DNA structures in several specific regions has been directly linked to gene regulation (47,48,53,82,83). In contrast, arguments behind genome-scale regulatory potential of such structures are typically based on correlation and enrichment studies and thus, remain indirect (23,29,31,73–75,77). Expression quantitative loci analysis, eQTL, allows identification of regulatory regions by linking genetic variations in a region to expression variation of a gene. In what follows, we use the term ‘eQTL variant’ to denote a nucleotide variant linked experimentally with expression of a gene via eQTL analysis, or to denote a variant in LD with an experimentally verified eQTL (see Materials and Methods, subsection entitled ‘Nucleotide variants, eQTLs and expression data,’ for details). Designation as an eQTL variant is based on association and does not indicate that the specific variant is causal; it may only be in LD with a causal variant.
As a cautionary note, eQTL analysis does not establish a mechanistic explanation for differences in expression, and presence of an eQTL variant in a non-B DNA region does not establish that the structure itself is responsible for the differences in expression. For example, it is important to keep in mind that transcription factors such as SP1 and EGR1 bind to runs of guanines (84). Therefore, a polymorphism in a potential G-quadruplex region can affect formation of the G-quadruplex but can also affect binding of a transcription factor. Despite such ambiguity, large-scale association of eQTL variants with potential non-B DNA regions would help to identify candidate regulatory structures. Previous studies identified a number of eQTL variants in potential G-quadruplex regions (53). In this study, we tried to examine how general is this phenomenon.
First, we tested whether eQTL variants were also enriched in potential non-B DNA regions. As would be expected from the higher density of variants in non-B DNA regions and the tendency of nearby variants to be in LD, a higher density of eQTL variants was indeed observed in potential non-B DNA regions compared to other B DNA regions in the same region category (Figure 3A). A more relevant measure, we argue, is the ratio of eQTL variants within a category of region to the total number of variants in the same category, normalized by the genome-wide ratio of eQTL variants to variants. We denote this normalized ratio as the enrichment score. We then asked the question whether the enrichment score of any particular type of region was greater than one?
Figure 3.
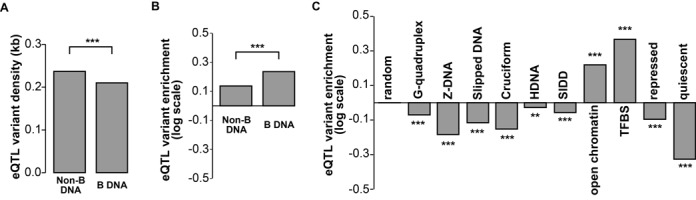
eQTL variants were not enriched in potential non-B DNA regions. (A) eQTL variant density for potential non-B DNA regions and B DNA regions from open chromatin regions. eQTL variant density was defined as number of eQTL variants in a specific region normalized by the length of that region. B DNA regions were regions that were not potential non-B DNA regions. Open chromatin regions were regions identified as chromatin-free regions that may have regulatory roles (see Materials and Methods, subsection entitled ‘Genic regions,’ for details). (B) eQTL variant enrichment for potential non-B DNA regions and B DNA regions within open chromatin regions. eQTL variant enrichment was calculated as the ratio of eQTL variants to nucleotide variants within a specific region normalized by the background ratio of all eQTL variants to all nucleotide variants used in this study. (C) eQTL variant enrichment for individual potential non-B DNA regions and other representative regions including random regions, open chromatin regions, TFBS regions, repressed regions and quiescent regions. See Materials and Methods for detailed definitions of those regions. Differences of eQTL densities or eQTL variant enrichments between two regions (specific regions to random regions for (C)) were also evaluated through χ2 tests of 2×2 tables (see Materials and Methods for details). The significance levels were categorized as: ***P-value < 0.001; **P-value < 0.01; *P-value < 0.05.
As expected, there were enrichments of eQTL variants in regulatory marker and open chromatin regions (Figure 3B, enrichment score > 0 under a log scale) as a whole, counted without considering whether individual variants were within potential non-B DNA intervals. However, when variants were counted separately for potential non-B DNA and B DNA intervals within regulatory marker or open chromatin regions, eQTL variants were less enriched in potential non-B DNA regions than in B DNA regions (Figure 3B). We compared the enrichment scores of individual types of potential non-B DNA regions, open chromatin regions, regulatory marker regions, and TFBS regions, as well as repressed and quiescent regions where eQTL variants are expected to be depleted (see Materials and Methods for details). As a control, we computed the enrichment scores of 500 000 regions randomly selected from the autosomes and found, as expected, no enrichment of eQTL variants (enrichment score close to 0 under a log scale). For potential non-B DNA regions, there was a depletion of eQTL variants, although we observed some differences between different potential non-B DNA regions (Figure 3C). Stranger et al. (57) defined cis eQTL to be those within 1 Mb around a TSS. However, stress due to supercoiling assumed to be the main force behind formation of non-B DNA does not propagate over such big distances (85). Thus, eQTLs affecting non-B DNA might be preferentially located in bases fairly close to the TSS. We evaluated whether restricting attention to regions within 1 kb of the TSS, or asymmetrically within 1 kb upstream or downstream of the TSS, might reveal an enrichment of eQTL, but no such enrichment was seen (Supplementary Figure S2).
The depletion of eQTL variants in potential non-B DNA regions might be interpreted as an argument against a broad impact of non-B DNA structures on gene expression. One possible explanation for depletion of eQTL variants in potential non-B DNA regions is that most variants do not change drastically the region's potential to form the non-B DNA structure. Among structures that are enriched near TSS, estimation of the stabilizing energy (as a proxy for Z-DNA potential) is possible for Z-DNA only, and it can be done with the SIBZ program (62). We restricted attention to regions where SIBZ and Z-hunt II predictions agreed in predicting a Z-DNA region. Then, we used SIBZ to identify variants that disable (reduce the probability to below 0.5) Z-DNA formation. We found weakly significant (P-value = 0.0284) enrichment of eQTLs among variants that disable Z-DNA formation relative to all variants that occur in Z-DNA regions (Supplementary Table S7).
Expression variability of genes directly downstream of potential non-B DNA regions
The depletion of eQTL variants in potential non-B DNA regions might also have an evolutionary explanation. To test if this might be the case, we computed the Spearman correlation between the number of potential non-B DNA regions and expression variation, and the partial Spearman correlation controlled for expression mean, in the gene-5′ regions of protein coding genes in human. As expected, randomly selected regions were not correlated to either expression mean or expression variation, even after controlling for expression mean.
Indeed, potential G-quadruplex, Z-DNA and slipped DNA regions, which were enriched near TSS (Figure 1), were all correlated to expression variation, even after controlling for expression mean (Table 2). It is possible that the correlation between potential non-B DNA regions and expression variation was caused merely by the numbers of nucleotide variants in gene-5′ regions of corresponding genes. We excluded this possibility via an additional test that showed less significant correlation between number of nucleotide variants in gene-5′ regions and expression variation of corresponding genes (Table 2). Taken together, our analyses of gene expression variation indicated that the presence of certain types of potential non-B DNA regions was related to expression variation. A notable exception to this rule were SIDDs. Indeed, SIDDs are not so mutagenic as other non-B DNA region types (Figure 2B). In addition, a previous study suggested a role of the FUSE region, which is a SIDD, upstream of c-MYC in tight regulation expression of this gene (86).
Table 2. Correlation between potential non-B DNA regions and gene expression.
| Regions | Expression mean | Expression variation | Expression variation (control for mean) |
|---|---|---|---|
| Random | 0.01 | −0.01 | −0.01 |
| G-quadruplex | 0.04*** | 0.08*** | 0.07*** |
| Z-DNA | 0.09*** | 0.11*** | 0.06*** |
| Slipped DMA | −0.01 | 0.04*** | 0.06*** |
| Cruciform | −0.02** | 0.01 | 0.04*** |
| H-DNA | 0.02** | 0.02** | 0.01 |
| SIDD | −0.02 | −0.02** | −0.00 |
| Nucleotide variants | −0.07*** | −0.03*** | 0.02* |
Spearman rank-order correlations were calculated between the number of potential non-B DNA regions in gene-5′ region of a gene and its expression mean or variation. Random regions and nucleotide variants in gene-5′ regions were used collectively as controls. Significance levels for correlations are categorized as: ***P-value < 0.001; **P-value < 0.01; *P-value < 0.05.
DISCUSSION
It has been proposed, and in several cases experimentally verified (47,48,53,80,81) that non-B DNA structures can regulate gene expression. Consistent with their proposed regulatory role, non-B DNA compatible sequences are conserved and enriched in functionally important regions (23,26,29,31,76). In particular, we demonstrated that the enrichment of potential G-quadruplex, Z-DNA and slipped DNA regions that can be observed in the promoter region could not be fully explained by the GC content alone. Specifically, the accumulation of non-B DNA in these regions was higher than expected by chance based on the nucleotide frequency, with the following partial exception. For potential Z-DNA regions, the excess occurs only for the region in the immediate vicinity of TSS; for regions further from the TSS, the increase of these potential Z-DNA regions is consistent with what is expected by chance. Interestingly, in our previous studies in E. coli we showed that potential Z-DNA regions were depleted in the promoter region, and this depletion could also be explained by nucleotide composition alone (87). In addition, genes with higher GC content had more potential non-B DNA regions in their promoter regions. Since GC-rich mammalian genes have on average higher transcription rates than GC-poor genes (88), this suggests that non-B DNA structures might particularly impact highly transcribed genes.
A hallmark of functional regions is their evolutionary conservation. However, using genome-wide human nucleotide variants from the 1000 Genomes Project, we demonstrated that potential non-B DNA regions contain a disproportionate number of nucleotide variants. Specifically, we showed that the density of nucleotide variants was higher in potential non-B DNA regions relative to the corresponding control B DNA regions; this observation held for any category of genic regions, even for potential non-B DNA regions conserved between human and chimpanzee. However, we observed that potential non-B DNA regions contain more polymorphic sites with small MAF compared to the background of all polymorphic sites suggesting that the mutagenicity of non-B DNA structures is, at least in part, counterbalanced by negative selection.
To gain more insights into this apparent contradiction between mutagenicity and proposed functional role, we analyzed nucleotide variants in potential non-B DNA regions as putative causes of expression variability for downstream genes. Surprisingly, an eQTL analysis revealed a depletion of eQTL variants in potential non-B DNA regions. In principle, one might expect that if non-B DNA structures regulate the expression of downstream genes, regions with non-B DNA forming potential should be enriched in eQTL variants, which is not what we found. These observations suggest several important properties of potential non-B DNA regions. The limited impact of mutations in these regions on gene expression is consistent with several non-mutually exclusive explanations. First, most nucleotide variants are expected to change only slightly the stability of non-B DNA structure and have a small impact on whether or not the structure will form. Utilizing the SIBZ program, we indeed found an enrichment of eQTL variants among variants that disable Z-DNA formation, although the statistical significance was not strong, possibly due to small sample size. Since mutations in non-B DNA regions may also be frequent, there may not have been enough evolutionary time for negative selection to reduce the prevalence of mutations with modest deleterious effect from the population.
Alternatively, it is possible that the preponderance of respective potential structures has a limited regulatory role on gene expression at least in the specific condition for which the expression data have been gathered. Indeed, our analysis indicates that most of the potential Z-DNA regions in gene promoters would be observed by chance given nucleotide frequencies in this region. Thus, it is possible that most of potential non-B DNA regions have emerged as a by-product of evolutionary processes other than the evolution of gene expression. If so, the roles of potential non-B DNA regions as gene regulators could have emerged later and limited to only a subset of potential non-B DNA regions and nearby genes.
The main physical force leading to formation of non-B DNA structures is negative supercoiling. Currently, there are computational models for supercoiling driven formation of alternative structures for SIDDs, Z-DNA and cruciforms (19). Thus, a second possible general reason for formation of these non-B DNA structures upstream of transcriptionally active genes is that they would provide torsional strain relief. Thus, formation of non-B DNA structures may facilitate efficient gene expression, serve as a gene expression sensor or be utilized for expression fine-tuning. Currently there is support, albeit not always direct, for all these roles (23,47,77,86,89). We have observed a correlation between expression and mean and the number of potential non-B DNA regions for Z-DNA and G-quadruplex, but not for SIDDs.
Interestingly, with the notable exceptions of SIDD and H-DNA, we observed a positive correlation between the number of potential non-B DNA regions in the promoter region and expression variation of the downstream gene. This suggests a third explanation for the depletion of eQTL variants in potential non-B DNA regions. Specifically, if the expression levels of these genes are noisy, then the cell could have evolved a capability of buffering this noise and thus damping the effect of subtle changes in the stability of non-B DNA structure on gene expression. In contrast, presence of SIDDs was correlated with reduced expression variability. This suggests that SIDDs might act more broadly as expression noise suppressors, as the FUSE segment near c-MYC does (86).
In summary, our results suggest that some potential non-B DNA regions emerged in gene promoters as a by-product of evolutionary processes not necessarily concerning gene expression. The role of potential non-B DNA regions as gene regulators emerged later and is likely to be limited to only a subset of these regions. This would explain the diversity of regulatory functions proposed for potential non-B DNA regions. In addition, the high mutagenicity of these structures might have been fundamental for speeding up the evolution of these diverse functions. It remains an open question how many of non-B DNA structures actually form, and out of those that form, how many have a regulatory role in gene expression.
SUPPLEMENTARY DATA
Supplementary Data are available at NAR Online.
Footnotes
The authors wish it to be known that, in their opinion, the first two authors should be regarded as Joint First Authors.
FUNDING
Intramural Research Program of the US National Institutes of Health, National Library of Medicine (XD, DW, TMP); Intramural Research Program of the US National Institutes of Health, National Cancer Institute, Center for Cancer Research (DL); NSF DBI 08-50214 (CB).
Conflict of interest statement. None declared.
REFERENCES
- 1.Watson J.D., Crick F.H. Genetical implications of the structure of deoxyribonucleic acid. Nature. 1953;171:964–967. doi: 10.1038/171964b0. [DOI] [PubMed] [Google Scholar]
- 2.Watson J.D., Crick F.H. Molecular structure of nucleic acids: a structure for deoxyribose nucleic acid. Nature. 1953;171:737–738. doi: 10.1038/171737a0. [DOI] [PubMed] [Google Scholar]
- 3.Mirkin S.M. Discovery of alternative DNA structures: a heroic decade (1979–1989) Front. Biosci. 2008;13:1064–1071. doi: 10.2741/2744. [DOI] [PubMed] [Google Scholar]
- 4.Wells R.D. Unusual DNA structures. J. Biol. Chem. 1988;263:1095–1098. [PubMed] [Google Scholar]
- 5.Sen D., Gilbert W. Formation of parallel four-stranded complexes by guanine-rich motifs in DNA and its implications for meiosis. Nature. 1988;334:364–366. doi: 10.1038/334364a0. [DOI] [PubMed] [Google Scholar]
- 6.Lipps H.J., Rhodes D. G-quadruplex structures: in vivo evidence and function. Trends Cell Biol. 2009;19:414–422. doi: 10.1016/j.tcb.2009.05.002. [DOI] [PubMed] [Google Scholar]
- 7.Mitsui Y., Langridge R., Shortle B.E., Cantor C.R., Grant R.C., Kodama M., Wells R.D. Physical and enzymatic studies on poly d(I-C).poly d(I-C), an unusual double-helical DNA. Nature. 1970;228:1166–1169. doi: 10.1038/2281166a0. [DOI] [PubMed] [Google Scholar]
- 8.Wang A.H.J., Quigley G.J., Kolpak F.J., Crawford J.L., van Boom J.H., van der Marel G., Rich A. Molecular structure of a left-handed double helical DNA fragment at atomic resolution. Nature. 1979;282:680–686. doi: 10.1038/282680a0. [DOI] [PubMed] [Google Scholar]
- 9.Sinden R.R., Pytlos-Sinden M.J., Potaman V.N. Slipped strand DNA structures. Front. Biosci. 2007;12:4788–4799. doi: 10.2741/2427. [DOI] [PubMed] [Google Scholar]
- 10.Panayotatos N., Wells R.D. Cruciform structures in supercoiled DNA. Nature. 1981;289:466–470. doi: 10.1038/289466a0. [DOI] [PubMed] [Google Scholar]
- 11.Htun H., Dahlberg J. Topology and formation of triple-stranded H-DNA. Science. 1989;243:1571–1576. doi: 10.1126/science.2648571. [DOI] [PubMed] [Google Scholar]
- 12.Jain A., Wang G., Vasquez K.M. DNA triple helices: biological consequences and therapeutic potential. Biochimie. 2008;90:1117–1130. doi: 10.1016/j.biochi.2008.02.011. [DOI] [PMC free article] [PubMed] [Google Scholar]
- 13.Benham C.J., Bi C. The analysis of stress-induced duplex destabilization in long genomic DNA sequences. J. Comput. Biol. 2004;11:519–543. doi: 10.1089/cmb.2004.11.519. [DOI] [PubMed] [Google Scholar]
- 14.Ambrus A., Chen D., Dai J., Bialis T., Jones R.A., Yang D. Human telomeric sequence forms a hybrid-type intramolecular G-quadruplex structure with mixed parallel/antiparallel strands in potassium solution. Nucleic Acids Res. 2006;34:2723–2735. doi: 10.1093/nar/gkl348. [DOI] [PMC free article] [PubMed] [Google Scholar]
- 15.Lam E.N.Y., Beraldi D., Tannahill D., Balasubramanian S. G-quadruplex structures are stable and detectable in human genomic DNA. Nat. Commun. 2013;4:1796. doi: 10.1038/ncomms2792. [DOI] [PMC free article] [PubMed] [Google Scholar]
- 16.Biffi G., Tannahill D., McCafferty J., Balasubramanian S. Quantitative visualization of DNA G-quadruplex structures in human cells. Nat. Chem. 2013;5:182–186. doi: 10.1038/nchem.1548. [DOI] [PMC free article] [PubMed] [Google Scholar]
- 17.Kouzine F., Gupta A., Baranello L., Wojtowicz D., Ben-Aissa K., Liu J., Przytycka T.M., Levens D. Transcription-dependent dynamic supercoiling is a short-range genomic force. Nat. Struct. Mol. Biol. 2013;20:396–403. doi: 10.1038/nsmb.2517. [DOI] [PMC free article] [PubMed] [Google Scholar]
- 18.Levens D., Benham C.J. DNA stress and strain, in silico, in vitro and in vivo. Phys. Biol. 2011;8:035011. doi: 10.1088/1478-3975/8/3/035011. [DOI] [PubMed] [Google Scholar]
- 19.Zhabinskaya D., Benham C.J. Competitive superhelical transitions involving cruciform extrusion. Nucleic Acids Res. 2013;41:9610–9621. doi: 10.1093/nar/gkt733. [DOI] [PMC free article] [PubMed] [Google Scholar]
- 20.Dai X., Rothman-Denes L.B. DNA structure and transcription. Curr. Opin. Microbiol. 1999;2:126–130. doi: 10.1016/S1369-5274(99)80022-8. [DOI] [PubMed] [Google Scholar]
- 21.Zhao J., Bacolla A., Wang G., Vasquez K.M. Non-B DNA structure-induced genetic instability and evolution. Cell. Mol. Life Sci. 2010;67:43–62. doi: 10.1007/s00018-009-0131-2. [DOI] [PMC free article] [PubMed] [Google Scholar]
- 22.Capra J.A., Paeschke K., Singh M., Zakian V.A. G-quadruplex DNA sequences are evolutionarily conserved and associated with distinct genomic features in Saccharomyces cerevisiae. PLoS Comput. Biol. 2010;6:e1000861. doi: 10.1371/journal.pcbi.1000861. [DOI] [PMC free article] [PubMed] [Google Scholar]
- 23.Champ P.C., Maurice S., Vargason J.M., Camp T., Ho P.S. Distributions of Z-DNA and nuclear factor I in human chromosome 22: a model for coupled transcriptional regulation. Nucleic Acids Res. 2004;32:6501–6510. doi: 10.1093/nar/gkh988. [DOI] [PMC free article] [PubMed] [Google Scholar]
- 24.Hamada H., Petrino M.G., Kakunaga T. A novel repeated element with Z-DNA-forming potential is widely found in evolutionarily diverse eukaryotic genomes. Proc. Natl Acad. Sci. U.S.A. 1982;79:6465–6469. doi: 10.1073/pnas.79.21.6465. [DOI] [PMC free article] [PubMed] [Google Scholar]
- 25.Hershman S.G., Chen Q., Lee J.Y., Kozak M.L., Yue P., Wang L.S., Johnson F.B. Genomic distribution and functional analyses of potential G-quadruplex-forming sequences in Saccharomyces cerevisiae. Nucleic Acids Res. 2008;36:144–156. doi: 10.1093/nar/gkm986. [DOI] [PMC free article] [PubMed] [Google Scholar]
- 26.Huppert J.L., Balasubramanian S. G-quadruplexes in promoters throughout the human genome. Nucleic Acids Res. 2007;35:406–413. doi: 10.1093/nar/gkl1057. [DOI] [PMC free article] [PubMed] [Google Scholar]
- 27.Mullen M.A., Olson K.J., Dallaire P., Major F., Assmann S.M., Bevilacqua P.C. RNA G-quadruplexes in the model plant species Arabidopsis thaliana: prevalence and possible functional roles. Nucleic Acids Res. 2010;38:8149–8163. doi: 10.1093/nar/gkq804. [DOI] [PMC free article] [PubMed] [Google Scholar]
- 28.Rawal P., Kummarasetti V.B.R., Ravindran J., Kumar N., Halder K., Sharma R., Mukerji M., Das S.K., Chowdhury S. Genome-wide prediction of G4 DNA as regulatory motifs: role in Escherichia coli global regulation. Genome Res. 2006;16:644–655. doi: 10.1101/gr.4508806. [DOI] [PMC free article] [PubMed] [Google Scholar]
- 29.Schroth G.P., Ho P.S. Occurrence of potential cruciform and H-DNA forming sequences in genomic DNA. Nucleic Acids Res. 1995;23:1977–1983. doi: 10.1093/nar/23.11.1977. [DOI] [PMC free article] [PubMed] [Google Scholar]
- 30.Strawbridge E.M., Benson G., Gelfand Y., Benham C.J. The distribution of inverted repeat sequences in the Saccharomyces cerevisiae genome. Curr. Genet. 2010;56:321–340. doi: 10.1007/s00294-010-0302-6. [DOI] [PMC free article] [PubMed] [Google Scholar]
- 31.Wang H., Noordewier M., Benham C.J. Stress-induced DNA duplex destabilization (SIDD) in the E. coli genome: SIDD sites are closely associated with promoters. Genome Res. 2004;14:1575–1584. doi: 10.1101/gr.2080004. [DOI] [PMC free article] [PubMed] [Google Scholar]
- 32.Xiao S., Zhang J.Y., Zheng K.W., Hao Y.H., Tan Z. Bioinformatic analysis reveals an evolutional selection for DNA:RNA hybrid G-quadruplex structures as putative transcription regulatory elements in warm-blooded animals. Nucleic Acids Res. 2013;41:10379–10390. doi: 10.1093/nar/gkt781. [DOI] [PMC free article] [PubMed] [Google Scholar]
- 33.Nakken S., Rognes T., Hovig E. The disruptive positions in human G-quadruplex motifs are less polymorphic and more conserved than their neutral counterparts. Nucleic Acids Res. 2009;37:5749–5756. doi: 10.1093/nar/gkp590. [DOI] [PMC free article] [PubMed] [Google Scholar]
- 34.Lopes J., Piazza A., Bermejo R., Kriegsman B., Colosio A., Teulade-Fichou M.P., Foiani M., Nicolas A. G-quadruplex-induced instability during leading-strand replication. EMBO J. 2011;30:4033–4046. doi: 10.1038/emboj.2011.316. [DOI] [PMC free article] [PubMed] [Google Scholar]
- 35.Inagaki H., Ohye T., Kogo H., Kato T., Bolor H., Taniguchi M., Shaikh T.H., Emanuel B.S., Kurahashi H. Chromosomal instability mediated by non-B DNA: cruciform conformation and not DNA sequence is responsible for recurrent translocation in humans. Genome Res. 2009;19:191–198. doi: 10.1101/gr.079244.108. [DOI] [PMC free article] [PubMed] [Google Scholar]
- 36.Wang G., Christensen L.A., Vasquez K.M. Z-DNA-forming sequences generate large-scale deletions in mammalian cells. Proc. Natl Acad. Sci. U.S.A. 2006;103:2677–2682. doi: 10.1073/pnas.0511084103. [DOI] [PMC free article] [PubMed] [Google Scholar]
- 37.Wang G., Vasquez K.M. Naturally occurring H-DNA-forming sequences are mutagenic in mammalian cells. Proc. Natl Acad. Sci. U.S.A. 2004;101:13448–13453. doi: 10.1073/pnas.0405116101. [DOI] [PMC free article] [PubMed] [Google Scholar]
- 38.Bacolla A., Jaworski A., Larson J.E., Jakupciak J.P., Chuzhanova N., Abeysinghe S.S., O'Connell C.D., Cooper D.N., Wells R.D. Breakpoints of gross deletions coincide with non-B DNA conformations. Proc. Natl Acad. Sci. U.S.A. 2004;101:14162–14167. doi: 10.1073/pnas.0405974101. [DOI] [PMC free article] [PubMed] [Google Scholar]
- 39.Cooper D.N., Bacolla A., Férec C., Vasquez K.M., Kehrer-Sawatzki H., Chen J.M. On the sequence-directed nature of human gene mutation: the role of genomic architecture and the local DNA sequence environment in mediating gene mutations underlying human inherited disease. Hum. Mutat. 2011;32:1075–1099. doi: 10.1002/humu.21557. [DOI] [PMC free article] [PubMed] [Google Scholar]
- 40.Kondo H., Osborne M.L., Kolhouse J.F., Binder M.J., Podell E.R., Utley C.S., Abrams R.S., Allen R.H. Nitrous oxide has multiple deleterious effects on cobalamin metabolism and causes decreases in activities of both mammalian cobalamin-dependent enzymes in rats. J. Clin. Invest. 1981;67:1270–1283. doi: 10.1172/JCI110155. [DOI] [PMC free article] [PubMed] [Google Scholar]
- 41.Raghavan S.C., Swanson P.C., Ma Y., Lieber M.R. Double-strand break formation by the RAG complex at the bcl-2 major breakpoint region and at other non-B DNA structures in vitro. Mol. Cell. Biol. 2005;25:5904–5919. doi: 10.1128/MCB.25.14.5904-5919.2005. [DOI] [PMC free article] [PubMed] [Google Scholar]
- 42.Bacolla A., Temiz N.A., Yi M., Ivanic J., Cer R.Z., Donohue D.E., Ball E.V., Mudunuri U.S., Wang G., Jain A., et al. Guanine holes are prominent targets for mutation in cancer and inherited disease. PLoS Genet. 2013;9:e1003816. doi: 10.1371/journal.pgen.1003816. [DOI] [PMC free article] [PubMed] [Google Scholar]
- 43.Chuzhanova N., Chen J.M., Bacolla A., Patrinos G.P., Férec C., Wells R.D., Cooper D.N. Gene conversion causing human inherited disease: evidence for involvement of non-B-DNA-forming sequences and recombination-promoting motifs in DNA breakage and repair. Hum. Mutat. 2009;30:1189–1198. doi: 10.1002/humu.21020. [DOI] [PMC free article] [PubMed] [Google Scholar]
- 44.Wells R.D. Non-B DNA conformations, mutagenesis and disease. Trends Biochem. Sci. 2007;32:271–278. doi: 10.1016/j.tibs.2007.04.003. [DOI] [PubMed] [Google Scholar]
- 45.Brooks T.A., Hurley L.H. The role of supercoiling in transcriptional control of MYC and its importance in molecular therapeutics. Nat. Rev. Cancer. 2009;9:849–861. doi: 10.1038/nrc2733. [DOI] [PubMed] [Google Scholar]
- 46.Kouzine F., Liu J., Sanford S., Chung H.J., Levens D. The dynamic response of upstream DNA to transcription-generated torsional stress. Nat. Struct. Mol. Biol. 2004;11:1092–1100. doi: 10.1038/nsmb848. [DOI] [PubMed] [Google Scholar]
- 47.Kouzine F., Levens D. Supercoil-driven DNA structures regulate genetic transactions. Front. Biosci. 2007;12:4409–4423. doi: 10.2741/2398. [DOI] [PubMed] [Google Scholar]
- 48.Davis T.L., Firulli A.B., Kinniburgh A.J. Ribonucleoprotein and protein factors bind to an H-DNA-forming c-myc DNA element: possible regulators of the c-myc gene. Proc. Natl Acad. Sci. U.S.A. 1989;86:9682–9686. doi: 10.1073/pnas.86.24.9682. [DOI] [PMC free article] [PubMed] [Google Scholar]
- 49.Kinniburgh A.J. A cis-acting transcription element of the c-myc gene can assume an H-DNA conformation. Nucleic Acids Res. 1989;17:7771–7778. doi: 10.1093/nar/17.19.7771. [DOI] [PMC free article] [PubMed] [Google Scholar]
- 50.Rangan A., Fedoroff O.Y., Hurley L.H. Induction of duplex to G-quadruplex transition in the c-myc promoter region by a small molecule. J. Biol. Chem. 2001;276:4640–4646. doi: 10.1074/jbc.M005962200. [DOI] [PubMed] [Google Scholar]
- 51.Wittig B., Wölfl S., Dorbic T., Vahrson W., Rich A. Transcription of human c-myc in permeabilized nuclei is associated with formation of Z-DNA in three discrete regions of the gene. EMBO J. 1992;11:4653–4663. doi: 10.1002/j.1460-2075.1992.tb05567.x. [DOI] [PMC free article] [PubMed] [Google Scholar]
- 52.Siddiqui-Jain A., Grand C.L., Bearss D.J., Hurley L.H. Direct evidence for a G-quadruplex in a promoter region and its targeting with a small molecule to repress c-MYC transcription. Proc. Natl Acad. Sci. U.S.A. 2002;99:11593–11598. doi: 10.1073/pnas.182256799. [DOI] [PMC free article] [PubMed] [Google Scholar]
- 53.Baral A., Kumar P., Halder R., Mani P., Yadav V.K., Singh A., Das S.K., Chowdhury S. Quadruplex-single nucleotide polymorphisms (Quad-SNP) influence gene expression difference among individuals. Nucleic Acids Res. 2012;40:3800–3811. doi: 10.1093/nar/gkr1258. [DOI] [PMC free article] [PubMed] [Google Scholar]
- 54.Verma A., Yadav V.K., Basundra R., Kumar A., Chowdhury S. Evidence of genome-wide G4 DNA-mediated gene expression in human cancer cells. Nucleic Acids Res. 2009;37:4194–4204. doi: 10.1093/nar/gkn1076. [DOI] [PMC free article] [PubMed] [Google Scholar]
- 55.Fernando H., Sewitz S., Darot J., Tavaré S., Huppert J.L., Balasubramanian S. Genome-wide analysis of a G-quadruplex-specific single-chain antibody that regulates gene expression. Nucleic Acids Res. 2009;37:6716–6722. doi: 10.1093/nar/gkp740. [DOI] [PMC free article] [PubMed] [Google Scholar]
- 56.The 1000 Genomes Project Consortium. An integrated map of genetic variation from 1092 human genomes. Nature. 2012;491:56–65. doi: 10.1038/nature11632. [DOI] [PMC free article] [PubMed] [Google Scholar]
- 57.Stranger B.E., Montgomery S.B., Dimas A.S., Parts L., Stegle O., Ingle C.E., Sekowska M., Smith G.D., Evans D., Gutierrez-Arcelus M., et al. Patterns of cis regulatory variation in diverse human populations. PLoS Genet. 2012;8:e1002639. doi: 10.1371/journal.pgen.1002639. [DOI] [PMC free article] [PubMed] [Google Scholar]
- 58.NCBI Resource Coordinators. Database resources of the National Center for Biotechnology Information. Nucleic Acids Res. 2014;42:D7–D17. doi: 10.1093/nar/gkt1146. [DOI] [PMC free article] [PubMed] [Google Scholar]
- 59.Pruitt K.D., Brown G.R., Hiatt S.M., Thibaud-Nissen F., Astashyn A., Ermolaeva O., Farrell C.M., Hart J., Landrum M.J., McGarvey K.M., et al. RefSeq: an update on mammalian reference sequences. Nucleic Acids Res. 2014;42:D756–D763. doi: 10.1093/nar/gkt1114. [DOI] [PMC free article] [PubMed] [Google Scholar]
- 60.Huppert J.L., Balasubramanian S. Prevalence of quadruplexes in the human genome. Nucleic Acids Res. 2005;33:2908–2916. doi: 10.1093/nar/gki609. [DOI] [PMC free article] [PubMed] [Google Scholar]
- 61.Ho P.S., Ellison M.J., Quigley G.J., Rich A. A computer aided thermodynamic approach for predicting the formation of Z-DNA in naturally occurring sequences. EMBO J. 1986;5:2737–2744. doi: 10.1002/j.1460-2075.1986.tb04558.x. [DOI] [PMC free article] [PubMed] [Google Scholar]
- 62.Zhabinskaya D., Benham C.J. Theoretical analysis of the stress induced B-Z transition in superhelical DNA. PLoS Comput. Biol. 2011;7:e1001051. doi: 10.1371/journal.pcbi.1001051. [DOI] [PMC free article] [PubMed] [Google Scholar]
- 63.Benson G. Tandem repeats finder: a program to analyze DNA sequences. Nucleic Acids Res. 1999;27:573–580. doi: 10.1093/nar/27.2.573. [DOI] [PMC free article] [PubMed] [Google Scholar]
- 64.Warburton P.E., Giordano J., Cheung F., Gelfand Y., Benson G. Inverted repeat structure of the human genome: the X-chromosome contains a preponderance of large, highly homologous inverted repeats that contain testes genes. Genome Res. 2004;14:1861–1869. doi: 10.1101/gr.2542904. [DOI] [PMC free article] [PubMed] [Google Scholar]
- 65.Hon J., Martínek T., Rajdl K., Lexa M. Triplex: an R/Bioconductor package for identification and visualization of potential intramolecular triplex patterns in DNA sequences. Bioinformatics. 2013;29:1900–1901. doi: 10.1093/bioinformatics/btt299. [DOI] [PubMed] [Google Scholar]
- 66.Rustici G., Kolesnikov N., Brandizi M., Burdett T., Dylag M., Emam I., Farne A., Hastings E., Ison J., Keays M., et al. ArrayExpress update—trends in database growth and links to data analysis tools. Nucleic Acids Res. 2013;41:D987–D990. doi: 10.1093/nar/gks1174. [DOI] [PMC free article] [PubMed] [Google Scholar]
- 67.Rosenbloom K.R., Sloan C.A., Malladi V.S., Dreszer T.R., Learned K., Kirkup V.M., Wong M.C., Maddren M., Fang R., Heitner S.G., et al. ENCODE data in the UCSC Genome Browser: year 5 update. Nucleic Acids Res. 2013;41:D56–D63. doi: 10.1093/nar/gks1172. [DOI] [PMC free article] [PubMed] [Google Scholar]
- 68.Hoffman M.M., Ernst J., Wilder S.P., Kundaje A., Harris R.S., Libbrecht M., Giardine B., Ellenbogen P.M., Bilmes J.A., Birney E., et al. Integrative annotation of chromatin elements from ENCODE data. Nucleic Acids Res. 2013;41:827–841. doi: 10.1093/nar/gks1284. [DOI] [PMC free article] [PubMed] [Google Scholar]
- 69.ENCODE Project Consortium. An integrative encyclopedia of DNA elements in the human genome. Nature. 2012;489:57–74. doi: 10.1038/nature11247. [DOI] [PMC free article] [PubMed] [Google Scholar]
- 70.Benson D.A., Cavanaugh M., Clark K., Karsch-Mizrachi I., Lipman D.J., Ostell J., Sayers E.W. GenBank. Nucleic Acids Res. 2013;41:D36–D42. doi: 10.1093/nar/gks1195. [DOI] [PMC free article] [PubMed] [Google Scholar]
- 71.Meyer L.R., Zweig A.S., Hinrichs A.S., Karolchik D., Kuhn R.M., Wong M., Sloan C.A., Rosenbloom K.R., Roe G., Rhead B., et al. The UCSC Genome Browser database: extensions and updates 2013. Nucleic Acids Res. 2013;41:D64–D69. doi: 10.1093/nar/gks1048. [DOI] [PMC free article] [PubMed] [Google Scholar]
- 72.R Core Team. R: A Language and Environment for Statistical Computing. Vienna, Austria: R foundation for Statistical Computing; 2013. [Google Scholar]
- 73.Zhabinskaya D., Benham C.J. Theoretical analysis of competing conformational transitions in superhelical DNA. PLoS Comput. Biol. 2012;8:e1002484. doi: 10.1371/journal.pcbi.1002484. [DOI] [PMC free article] [PubMed] [Google Scholar]
- 74.Huppert J.L., Bugaut A., Kumari S., Balasubramanian S. G-quadruplexes: the beginning and end of UTRs. Nucleic Acids Res. 2008;36:6260–6268. doi: 10.1093/nar/gkn511. [DOI] [PMC free article] [PubMed] [Google Scholar]
- 75.Schroth G.P., Chou P.J., Ho P.S. Mapping Z-DNA in the human genome. Computer-aided mapping reveals a nonrandom distribution of potential Z-DNA-forming sequences in human genes. J. Biol. Chem. 1992;267:11846–11855. [PubMed] [Google Scholar]
- 76.Sawaya S., Bagshaw A., Buschiazzo E., Kumar P., Chowdhury S., Black M.A., Gemmell N. Microsatellite tandem repeats are abundant in human promoters and are associated with regulatory elements. PLoS One. 2013;8:e54710. doi: 10.1371/journal.pone.0054710. [DOI] [PMC free article] [PubMed] [Google Scholar]
- 77.Du Z., Zhao Y., Li N. Genome-wide analysis reveals regulatory role of G4 DNA in gene transcription. Genome Res. 2008;18:233–241. doi: 10.1101/gr.6905408. [DOI] [PMC free article] [PubMed] [Google Scholar]
- 78.Eddy J., Maizels N. Conserved elements with potential to form polymorphic G-quadruplex structures in the first intron of human genes. Nucleic Acids Res. 2008;36:1321–1333. doi: 10.1093/nar/gkm1138. [DOI] [PMC free article] [PubMed] [Google Scholar]
- 79.Sherry S.T., Ward M.H., Kholodov M., Baker J., Phan L., Smigielski E.M., Sirotkin K. dbSNP: the NCBI database of genetic variation. Nucleic Acids Res. 2001;29:308–311. doi: 10.1093/nar/29.1.308. [DOI] [PMC free article] [PubMed] [Google Scholar]
- 80.Voight B.F., Kudaravalli S., Wen X., Pritchard J.K. A map of recent positive selection in the human genome. PLoS Biol. 2006;4:e72. doi: 10.1371/journal.pbio.0040072. [DOI] [PMC free article] [PubMed] [Google Scholar]
- 81.Vitti J.J., Grossman S.R., Sabeti P.C. Detecting natural selection in genomic data. Annu. Rev. Genet. 2013;47:97–120. doi: 10.1146/annurev-genet-111212-133526. [DOI] [PubMed] [Google Scholar]
- 82.Dai X., Greizerstein M.B., Nadas-Chinni K., Rothman-Denes L.B. Supercoil-induced extrusion of a regulatory DNA hairpin. Proc. Natl Acad. Sci. U.S.A. 1997;94:2174–2179. doi: 10.1073/pnas.94.6.2174. [DOI] [PMC free article] [PubMed] [Google Scholar]
- 83.Oh D.B., Kim Y.G., Rich A. Z-DNA-binding proteins can act as potent effectors of gene expression in vivo. Proc. Natl Acad. Sci. U.S.A. 2002;99:16666–16671. doi: 10.1073/pnas.262672699. [DOI] [PMC free article] [PubMed] [Google Scholar]
- 84.Khachigian L.M., Williams A.J., Collins T. Interplay of Sp1 and Egr-1 in the proximal platelet-derived growth factor A-chain promoter in cultured vascular endothelial cells. J. Biol. Chem. 1995;270:27679–27686. doi: 10.1074/jbc.270.46.27679. [DOI] [PubMed] [Google Scholar]
- 85.Kouzine F., Gupta A., Baranello L., Wojtowicz D., Ben-Aissa K., Liu J., Przytycka T., Levens D. Transcription-dependent dynamic supercoiling is a short-range genomic force. Nat. Struct. Biol. 2013;20:396–403. doi: 10.1038/nsmb.2517. [DOI] [PMC free article] [PubMed] [Google Scholar]
- 86.Chung H.J., Levens D. c-myc expression: keep the noise down! Mol. Cells. 2005;20:157–166. [PubMed] [Google Scholar]
- 87.Du X., Wojtowicz D., Bowers A.A., Levens D., Benham C.J., Przytycka T.M. The genome-wide distribution of non-B DNA motifs is shaped by operon structure and suggests the transcriptional importance of non-B DNA structures in Escherichia coli. Nucleic Acids Res. 2013;41:5965–5977. doi: 10.1093/nar/gkt308. [DOI] [PMC free article] [PubMed] [Google Scholar]
- 88.Kudla G., Lipinski L., Caffin F., Helwak A., Zylicz M. High guanine and cytosine content increases mRNA levels in mammalian cells. PLoS Biol. 2006;4:e180. doi: 10.1371/journal.pbio.0040180. [DOI] [PMC free article] [PubMed] [Google Scholar]
- 89.Ray B.K., Dhar S., Shakya A., Ray A. Z-DNA-forming silencer in the first exon regulates human ADAM-12 gene expression. Proc. Natl Acad. Sci. U.S.A. 2001;4:103–108. doi: 10.1073/pnas.1008831108. [DOI] [PMC free article] [PubMed] [Google Scholar]
Associated Data
This section collects any data citations, data availability statements, or supplementary materials included in this article.