Abstract
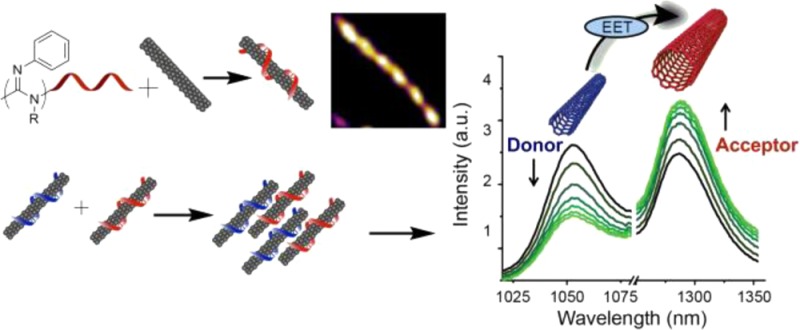
The use of single-walled carbon nanotubes (SWCNTs) as near-infrared optical probes and sensors require the ability to simultaneously modulate nanotube fluorescence and functionally derivatize the nanotube surface using noncovalent methods. We synthesized a small library of polycarbodiimides to noncovalently encapsulate SWCNTs with a diverse set of functional coatings, enabling their suspension in aqueous solution. These polymers, known to adopt helical conformations, exhibited ordered surface coverage on the nanotubes and allowed systematic modulation of nanotube optical properties, producing up to 12-fold differences in photoluminescence efficiency. Polymer cloaking of the fluorescent nanotubes facilitated the first instance of controllable and reversible internanotube exciton energy transfer, allowing kinetic measurements of dynamic self-assembly and disassembly.
Introduction
Semiconducting single-walled carbon nanotubes emit photostable fluorescence in the near-infrared (nIR) region (ca. 900–1600 nm) of the electromagnetic spectrum.100 Due to their unique photophysical properties, interest exists in using SWCNTs for biological applications.2 Noncovalent functionalization of SWCNTs via encapsulation in amphiphilic polymers preserves the optical properties of SWCNTs in solution. Biopolymers, such ssDNA,3 peptides,4 and proteins,5 and synthetic polymers, such as polyfluorenes,6 polycarbazoles,7 aryleneethynylene polymers8 polyethylene glycol (PEG) derivatives,9 and dextran-based polymers,10 have been investigated to encapsulate nanotubes for diverse applications, including their use as optical probes1 and bioanalytical sensors.11 The ease of synthesis, scale-up, and greater control over functionalization of synthetic polymers, as compared to nucleic acids and peptides, allows the development of functionally diverse polymer–nanotube complexes for a wide range of applications. We endeavor to rationally design encapsulating materials to produce nanotube suspensions resulting in environmentally responsive, multiplexed, and photostable nIR probes.
Synthetic helical polymers incorporate similar structural motifs as the biomolecules used to encapsulate carbon nanotubes; however, they allow for greater structural modularity.12 We explored a helical polymer system, polycarbodiimides, with a semirigid backbone that allows a large degree of control over size and pendant groups,13 to develop stable and water-soluble polymer–nanotube complexes. Recent studies on polycarbodiimides demonstrated precise control over the polymer microstructure14,15 and postmodifications, resulting in a polymer chain with a regular array of functional side groups.16 The tunable nature of the system permits the synthesis of polycarbodiimides to promote multivalent π–π interactions between the polymer and the nanotube surface to form stable, photoluminescent, polymer-cloaked nanotube complexes with diverse functionalities.
Experimental Section
Synthesis of Polymers
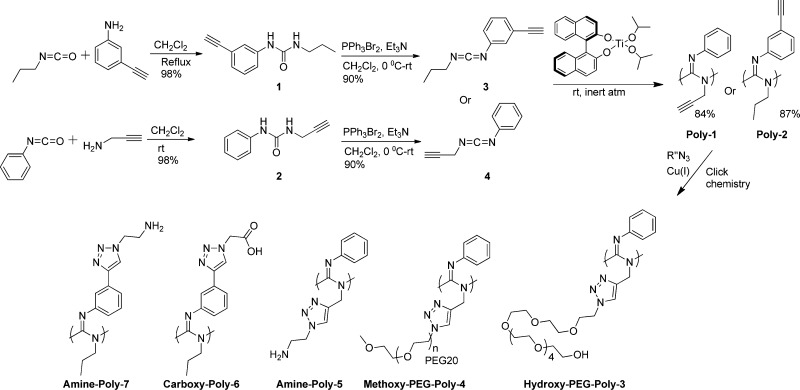
Polymers were synthesized following the reported procedure17 with slight modifications [details in the Supporting Information (SI)]. Briefly, the catalyst, R-BINOL-titanium(IV)-diisopropoxide, either neat or dissolved in chloroform (0.2 mL per 500 mg of monomer), was added to the alkyne-substituted monomer at room temperature and under inert atmosphere. The reaction mixture turned into a dark red viscous liquid and solidified to an orange red solid (ca. 24 h). The completion of the polymerization process was confirmed by disappearance of IR signals from carbodiimide (∼2140–2120 cm–1) and appearance of new IR absorption at ∼1620–1640 cm–1 due to formation of the polymer backbone. The solid polymer was dissolved in chloroform, precipitated in methanol, separated, and dried to obtain a light yellow solid. The alkyne-substituted polymers were then postmodified via a Cu(I)-catalyzed alkyne–azide cycloaddition reaction to couple organic azide compounds (details in the SI).
Amine-Poly-5 and Amine-Poly-7 were acidified with a few drops of dilute HCl to increase water solubility. Carboxy-Poly-6 was treated with a few drops of a saturated solution of NaHCO3. Acidic and basic polymer solutions were then filtered through centrifugal filters (Amicon Ultracel, MWCO 3K Da, Merck Millipore Ltd.) to remove residual small molecules and washed with water until free from free acid or base, as tested with litmus paper. The polymers were then used to suspend SWCNTs in water.
Preparation and Characterization of Polycarbodiimide–SWCNT Complexes in Water
SWCNTs (1 mg, Unidym HiPCO SWCNTs) were added to aqueous solutions of polymer (4 mg in 1.0 mL water), and the mixture was probe sonicated (eight-tip probe, 750 W, 20 kHz, 40% Amplitude, SONICS VibraCell) at low temperature for 20 min using a CoolRack M30 PF (BioCision) kept at −20 °C prior to use. The solution was centrifuged (SORVALL Discovery 90SE, HITACHI) at 280 000 g for 30 min at room temperature to remove unsuspended nanotubes and carbon impurities. After centrifugation, ca. 80% of the supernatant was collected and filtered through a 100 kDa molecular weight cutoff centrifugal filter (Millipore Amicon) to remove excess of polymer, washed with water two more times, and resuspended in water. Solutions were diluted with water as required prior to characterization by ultraviolet–visible–near-infrared (UV–vis–nIR) absorbance and fluorescence spectroscopies. Absorption and fluorescence spectra were compared to those from sodium deoxycholate (SDC)-suspended SWCNTs. Ultrapure water (18.2 mΩ) was used for all aqueous solutions.
The UV–vis–nIR absorption spectra were measured with a JASCO V-670 spectrophotometer. Near infrared fluorescence measurements were performed on a home-built instrument consisting of an IsoPlane SCT 320 spectrograph and PioNIR InGaAs detector (both Princeton Instruments) connected to an Olympus IX71 inverted microscope. A 20× objective was used. SWCNTs were excited using a SuperK Extreme supercontinuum laser connected to a Varia variable bandpass filter (both NKT Photonics), and emission from 915 to 1354 nm was recorded. LightField software (Princeton Instruments) was used to collect and process data. Photoluminescence excitation/emission (PL) measurements were performed (details in the SI) on the same spectrograph. The excitation wavelength was varied from 491 to 824 nm, and the emission was recorded from 915 to 1354 nm. Data were collected using a custom Labview (National Instruments) automation program. These data were then analyzed and plotted using Matlab (The MathWorks) code.
Internanotube Exciton Energy Transfer (INEET) in Polycarbodiimide–SWCNTs
Amine-Poly-5–SWCNTs (18 mg/L nanotubes, 100 μL) was mixed with Carboxy-Poly-6–SWCNTs (18 mg/L nanotubes, 100 μL) in a 96-well plate (96W plate, μClear, chimney style, clear bottom, TC, sterile, Greiner Bio-One) at room temperature. 2D PL measurements were performed prior to mixing, immediately after mixing, and after incubation for 40 h (Figure 3). In dynamic studies (Figure 4A–C), photoluminescence (PL) from nanotubes was continuously monitored (excitation 669 nm) for a specified time period. To disaggregate the nanotubes, an aqueous solution of amine-functionalized polycarbodiimide hydrochloride salt solution (0.5 mg/mL) was added to the mixture of polycarbodiimide–SWCNT complexes and the suspension was mixed thoroughly by pipetting it up and down.
Figure 3.
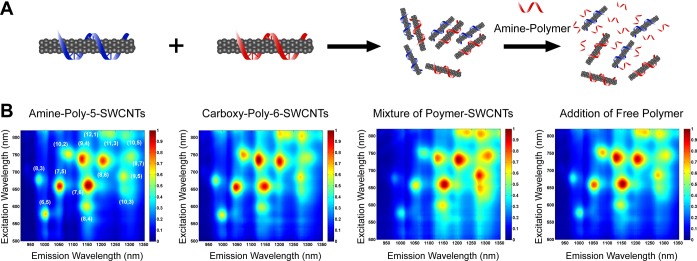
Reversible internanotube exciton energy transfer (INEET) in polycarbodiimide–SWCNTs. (A) Schematic representation of the EET process and its reversal upon addition of amine-functionalized polycarbodiimide. (B) Photoluminescence excitation–emission (PL) map of Amine-Poly-5–SWCNTs, Carboxy-Poly-6–SWCNTs, a mixture of Amine-Poly-5–SWCNTs and Carboxy-Poly-6–SWCNTs, and the mixture after subsequent addition of amine-polymer.
Figure 4.

Observation of INEET dynamics in polycarbodiimide-encapsulated SWCNTs. (A) Individual spectra acquired during a time-course acquisition of EET kinetic data. Intensity was normalized to the area under the curve. (B) EET dynamics show a monotonic relative PL intensity increase in small band gap nanotubes (peaks 4 and 5) and simultaneous relative PL intensity decrease in large band gap nanotubes (peaks 1–3). (C) INEET ratio, plotted using peak 5 as the acceptor and peak 1 as the donor. The final data point was acquired after initiating disaggregation using an amine-polymer.
TEM
A 2–4 μL aqueous solution of polymer–SWCNTs (∼5 mg/L, nanotube concentration) was dropped onto a carbon-coated copper TEM grid (Ted Pella) and allowed to stand for 10 min. SWCNTs on air-dried grids were observed using a JEOL 1200 EX transmission electron microscope operated at 80 kV.
AFM
A 10 μL aqueous solution of polymer–SWCNTs (2–5 mg/L, nanotube concentration) was dropped onto a freshly cleaved mica surface (Pelco Mica Disc, V1, Ted Pella) and allowed to stand for 45 s. The mica surface was rinsed with deionized water two times to remove unbound carbon nanotubes. The mica surface was air-dried at room temperature prior to AFM imaging. AFM images were collected using an Asylum MFD-3D-BIO in ac mode using AC240TS and AC160TS tips (Asylum Research). The typical scan size was 2–5 μm and the scan rate was 0.25 Hz–0.5 Hz. The images were processed with Igor software.
Results and Discussion
Alkyne polycarbodiimides (Poly-1, Mn = 13 kDa, PDI = 1.29, and Poly-2, Mn = 36 kDa, PDI = 1.35; see the SI) were synthesized and organic azides were subsequently coupled to terminal alkyne groups in these polymers via Cu(I)-catalyzed alkyne–azide cycloaddition, as depicted in Scheme 1, following a previously reported procedure.17 Side chains in these polymers, such as primary amines, carboxylic acids, and oligoethylene glycols, were incorporated to mimic side chains in biopolymers, such as polylysines and polyglutamic acids, and to increase water solubility. In addition, aromatic groups were incorporated on each monomer substituent 3 and 4 (Scheme 1) to promote multivalent π–π interactions18 between the polymer and the graphitic sidewall of SWCNTs.
Scheme 1. Synthesis of Polycarbodiimide Polymers (Poly-1–7).
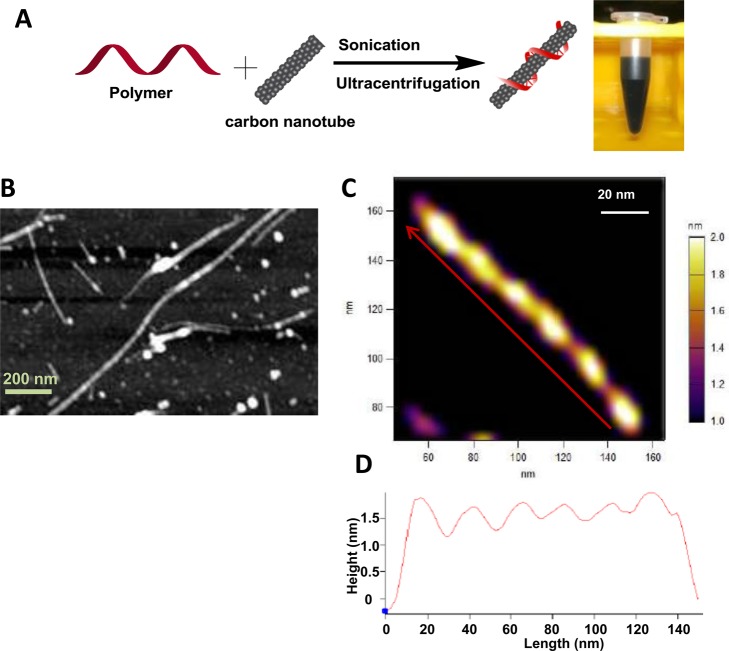
Raw SWCNTs (Unidym, HiPCO) were sonicated in the presence of a polycarbodiimide from the library (Poly-3–7) to render them soluble in an aqueous solution. The insoluble materials were pelleted via ultracentrifugation and removed, yielding a dark, aqueous supernatant (Figure 1A). Excess free polymer was then removed from the suspensions by centrifugal filtration. The aqueous suspensions were stable under ambient conditions for several months, with no visible aggregation. Atomic force microscopy (AFM) and transmission electron microscopy (TEM) were conducted to characterize polycarbodiimide–SWCNT morphology. Images from both TEM and AFM microscopies showed well-dispersed nanotubes (SI, Figure S1). AFM images of Amine-Poly-7–SWCNTs (Figure 1B,C), deposited and dried on freshly cleaved mica surface, showed a distinct, periodic banding pattern along the nanotube surface. The patterns exhibited a periodic spacing of ∼20 nm along the nanotube axis and band heights up to ∼0.8–0.5 nm above the surface of the nanotubes (Figure 1D). A similar periodic pattern is observed in nanotube complexes dispersed using carboxy- and PEG-functionalized polycarbodiimides as well (SI, Figure S1). These observations, coupled with the long-term stability of the polymer–nanotube suspension, suggest a uniform conformation of these aromatic polymers along the SWCNTs. These AFM micrographs are comparable to those from DNA-encapsulated SWCNTs, for which a regular banding pattern of DNA strands with a pitch of 14–20 nm along the nanotubes has been reported.19 On the basis of this regular pattern and the similarity to the pattern of DNA–SWCNTs, which are predicted [by all atom molecular dynamics (MD) simulations] to helically wrap nanotubes via the π–π interactions,20 we suggest that the polymer also likely helically encapsulated the nanotubes.
Figure 1.
Polycarbodiimide encapsulation of SWCNTs. (A) Scheme showing the preparation of polymer–SWCNT aqueous suspensions. (B) Atomic force micrograph of Amine-Poly-7–SWCNT complexes showing periodic banding along the nanotube surface. (C) Magnified AFM image of a single Amine-Poly-7–SWCNT complex. (D) Height profile of a single polymer–nanotube complex; direction is denoted by the red arrow in image C.
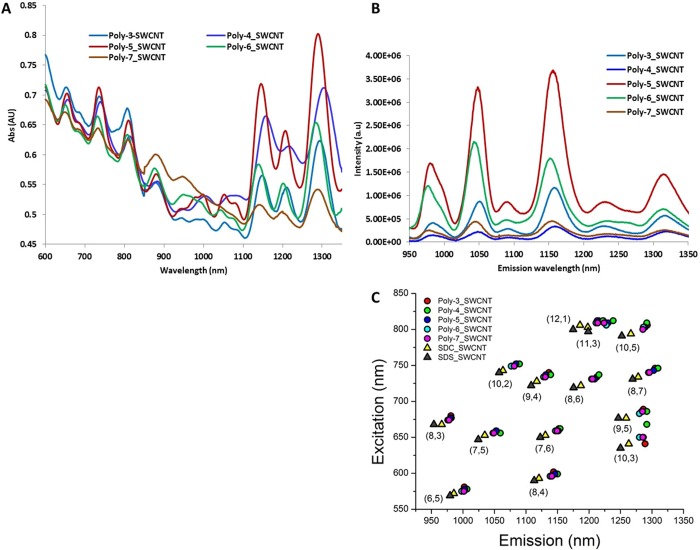
Absorption spectra of all polycarbodiimide–SWCNT complexes (Figure 2A) showed characteristic E22 and E11 transition features of semiconducting SWCNTs.21 Sharp, discrete peaks in the absorption spectra are indicative of well-dispersed nanotubes. The photoluminescence efficiencies of the polymer–nanotube complexes varied with the encapsulating polymer. Photoluminescence intensities from polycarbodiimide–SWCNTs (16 mg/L nanotubes, in all cases with identical exposure conditions) differed by up to 12-fold, depending on the polymer substituent functional group as well as the polymer microstructure (Figure 2B). Such trends are similar to findings reported for DNA-encapsulated SWCNTs.22
Figure 2.
Optical properties of polycarbodiimide–SWCNTs. (A) Vis–nIR absorption spectra, (B) nIR emission spectra of polycarbodiimide–SWCNTs excited at 659 nm, and (C) center wavelengths of nanotube emission peaks collected from photoluminescence excitation/emission profiles of polycarbodiimide–SWCNTs and surfactant-suspended SWCNTs.
Two-dimensional photoluminescence excitation/emission (PL) spectroscopy was conducted on polycarbodiimide–SWCNTs by recording emission spectra upon varying the excitation wavelength (details in the SI). Fourteen distinct nanotube species detected in 2D PL plots for polycarbodimide–SWCNT complexes (SI, Figure S2) were assigned (n,m) chirality indices according to Bachilo et al.21 and Weisman and Bachilo.23 Excitation and emission wavelength maxima, collected from the PL plots, fell within a narrow range that was red-shifted relative to surfactant-suspended SWCNT emission (Figure 2C).
Exciton energy transfer (EET) in SWCNTs has been observed between adjacent semiconducting nanotubes in van der Waals contact wherein large band gap donors transfer energy to smaller band gap acceptors.24 In small bundles, a center to center distance of 1–4 nm between nanotubes was shown to optimize energy transfer.25 Recent studies have shown that exciton energy transfer rates in SWCNTs vary depending on a number of factors, including surface functionalization,26 and ranges from picoseconds27 to femtoseconds.28 With a functionally diverse set of polymer–SWCNTs in hand, we first investigated the possibility of initiating internanotube exciton energy transfer (INEET) events. Figure 3A illustrates a schematic representation of the process. Figure 3B shows 2D PL plots of two oppositely charged polymer–nanotube complexes (ζ-potential values 67.93 ± 2.73 mV for Amine-Poly-5–SWCNTs and −62.93 ± 1.28 mV for Carboxy-Poly-6–SWCNTs) and the resulting mixture after incubation for 40 h at room temperature. Complexes were chosen to take advantage of strong Coulombic attraction between primary amine groups (cationic protonated form, SI) and carboxylic acid groups (anionic carboxylate form, SI) to bring nanotubes encapsulated in corresponding polymers into a favorable distance for INEET, without creating irreversible van der Waals bundles. Mixing the two polymer–SWCNT complexes resulted in an overall emission decrease in PL measurements (SI, Figure S3A), yet the emission of smaller band gap SWCNTs [e.g.; (8,7) and (9,5) species] increased with respect to that of large band gap SWCNTs [e.g.; (8,3), (6,5), and (7,5) species, Figure 3B], suggesting exciton energy transfer from large band gap donor nanotubes to smaller band gap acceptor nanotubes. The relative intensity increase was found to exhibit an (n,m) dependence that was virtually monotonic with emission wavelength (SI, Figure S3B). Photoluminescence quenching in the SWCNT-EET process has been reported24 and was attributed to the presence of metallic SWCNTs.29 In our study, charge-induced clustering of the two polymer–SWCNT complexes in the mixture likely brought metallic tubes closer to semiconducting tubes, resulting in the overall decrease in photoluminescence intensity. Upon mixing the suspensions, nanotubes coalesced into free-floating aggregates that remained for several days without precipitating. In separate experiments, we confirmed that fluorescent aggregates of various sizes were formed upon mixing the two polymer–SWCNT suspensions (SI, Figure S4 and Movie S1). After mixing, emission peaks in the short-wavelength excitation/long-wavelength emission range, which could not be assigned to known (n,m) species, were enhanced (SI, Figure S5), a signature of energy transfer in semiconducting SWCNTs as described in the literature.29 In order to disrupt the aggregation, amine-functionalized polycarbodiimide polymer was introduced. Addition of the free polymer resulted in a recovery of the original relative PL intensities (Figure 3B and SI, Figure S3A) concomitant with the disappearance of large aggregates (SI, Movie S2). Plotting the net recovery of (n,m) intensities showed a semimonotonic trend with emission wavelength (SI, Figure S3C). The results from these experiments demonstrated that inter-nanotube EET can be triggered between nanotubes that are individually encapsulated with their own functional coatings.
Next, we investigated transient INEET events in aqueous suspensions of polymer–SWCNT complexes. Dynamic measurements of INEET dynamics (Figure 4) illustrate that the process is spontaneous, controllable, and reversible. Upon mixing the aforementioned oppositely charged nanotubes, the photoluminescence intensities of large band gap nanotubes exhibited a monotonic decrease [e.g., (8,3), (6,5), etc. species, peaks 1–3], while small band gap nanotube emission exhibited a simultaneous relative increase [e.g., (8,7), (9,5), etc. species, peaks 4 and 5; Figure 4A). The relative fluorescence intensities of each peak, plotted over time, illustrate INEET dynamics between large and small band gap nanotubes (Figure 4B).
Each intensity–time curve was fit with the logistic function as this function has been used to approximate the kinetics of protein aggregation (SI, Figure S6A).30 The kinetics of peaks 1 and 5 also fit well as the reactant and the final product in a series of first-order forward reactions, respectively (SI, Figure S6B). The first-order behavior suggests that the larger band gap nanotubes within peak 1 act almost purely as energy donors and the smaller band gap nanotubes within peak 5 as energy acceptors. Using the above information, the INEET ratio, plotted as Ia/(Ia + Id), where Ia is the acceptor intensity and Id is the donor intensity, was obtained using peak 5 as the acceptor and peak 1 as the donor (Figure 4C). The INEET ratio shows a gradual increase and apparent plateauing after ca 80 min. To test reversibility, amine-functionalized polycarbodiimide polymer salt solution (0.5 mg/mL) was added at 110 min time point and the reaction was gently mixed. A near-instantaneous reversal of INEET back to the initial ratio occurred. Movies confirm the gradual aggregation upon mixing polymer–nanotube complexes and the rapid disaggregation upon addition of a free polymer (SI, Movies S1 and S2).
Conclusions
We report the noncovalent functionalization of SWCNTs through encapsulation in helical polycarbodiimides to form water-soluble, well-dispersed polymer–nanotube complexes with nIR emission that are stable under ambient conditions. The polymers facilitated the intensity modulation of nanotube fluorescence and enabled INEET between individually encapsulated nanotubes. This is the first instance of EET produced spontaneously between nanotubes due to Coulombic attraction between the encapsulating polymers and displays directed reversibility. The finding portends the measurement of dynamic processes and a potential mechanism for switchable molecular probes and sensors.
Acknowledgments
This work was supported by the NIH Director’s New Innovator Award (DP2-HD075698), the Louis V. Gerstner Jr. Young Investigator’s Fund, the Frank A. Howard Scholars Program, the Alan and Sandra Gerry Metastasis Research Initiative, and the Center for Molecular Imaging and Nanotechnology at Memorial Sloan Kettering Cancer Center. D.R. was supported by an American Cancer Society 2013 Roaring Fork Valley Research Fellowship. The authors would like to thank core facilities at Memorial Sloan Kettering Cancer Center: the Molecular Cytology Core Facility for AFM imaging (Core Grant P30 CA008748), the Electron Microscopy Core facility for TEM imaging, and the Analytical Core Facility for NMR data, FTIR instruments, and HRMS data.
Supporting Information Available
Supporting figures, movies, and methods, including material synthesis and characterization. This material is available free of charge via the Internet at http://pubs.acs.org.
The authors declare no competing financial interest.
Funding Statement
National Institutes of Health, United States
Supplementary Material
References
- O'Connell M. J.; Bachilo S. M.; Huffman C. B.; Moore V. C.; Strano M. S.; Haroz E. H.; Rialon K. L.; Boul P. J.; Noon W. H.; Kittrell C.; Ma J.; Hauge R. H.; Weisman R. B.; Smalley R. E. Science 2002, 2975581593–596. [DOI] [PubMed] [Google Scholar]
- Gong H.; Peng R.; Liu Z. Adv. Drug Delivery Rev. 2013, 65151951–1963. [DOI] [PubMed] [Google Scholar]
- Zheng M.; Jagota A.; Semke E. D.; Diner B. A.; Mclean R. S.; Lustig S. R.; Richardson R. E.; Tassi N. G. Nat. Mater. 2003, 25338–342. [DOI] [PubMed] [Google Scholar]
- Arnold M. S.; Guler M. O.; Hersam M. C.; Stupp S. I. Langmuir 2005, 21104705–4709. [DOI] [PubMed] [Google Scholar]
- Karajanagi S. S.; Yang H.; Asuri P.; Sellitto E.; Dordick J. S.; Kane R. S. Langmuir 2006, 2241392–5. [DOI] [PubMed] [Google Scholar]
- Hwang J.-Y.; Nish A.; Doig J.; Douven S.; Chen C.-W.; Chen L.-C.; Nicholas R. J. J. Am. Chem. Soc. 2008, 130113543–3553. [DOI] [PubMed] [Google Scholar]
- Rice N. A.; Adronov A. Macromolecules 2013, 46103850–3860. [Google Scholar]
- Deria P.; Von Bargen C. D.; Olivier J. H.; Kumbhar A. S.; Saven J. G.; Therien M. J. J. Am. Chem. Soc. 2013, 135, 16220–16234. [DOI] [PubMed] [Google Scholar]
- Wang R.; Cherukuri P.; Duque J. G.; Leeuw T. K.; Lackey M. K.; Moran C. H.; Moore V. C.; Conyers J. L.; Smalley R. E.; Schmidt H. K.; Weisman R. B.; Engel P. S. Carbon 2007, 45122388–2393. [Google Scholar]
- Kim J.-H.; Heller D. A.; Jin H.; Barone P. W.; Song C.; Zhang J.; Trudel L. J.; Wogan G. N.; Tannenbaum S. R.; Strano M. S. Nat. Chem. 2009, 16473–481. [DOI] [PubMed] [Google Scholar]
- Heller D. A.; Baik S.; Eurell T. E.; Strano M. S. Adv. Mater. 2005, 17232793–2799. [Google Scholar]
- Heller D. A.; Jin H.; Martinez B. M.; Patel D.; Miller B. M.; Yeung T.-K.; Jena P. V.; Hobartner C.; Ha T.; Silverman S. K.; Strano M. S. Nat. Nanotechnol. 2009, 42114–120. [DOI] [PubMed] [Google Scholar]
- Yashima E.; Maeda K.; Iida H.; Furusho Y.; Nagai K. Chem. Rev. 2009, 109116102–6211. [DOI] [PubMed] [Google Scholar]
- Kennemur J.; Novak B. Polymer 2011, 5281693–1710. [Google Scholar]
- DeSousa J. D.; Novak B. M. ACS Macro Lett. 2012, 1, 672–675. [DOI] [PubMed] [Google Scholar]
- Reuther J. F.; DeSousa J. D.; Novak B. M. Macromolecules 2012, 45197719–7728. [Google Scholar]
- Budhathoki-Uprety J.; Reuther J. F.; Novak B. M. Macromolecules 2012, 45208155–8165. [Google Scholar]
- Budhathoki-Uprety J.; Novak B. Macromolecules 2011, 44155947–5954. [Google Scholar]
- Zorbas V.; Smith A. L.; Xie H.; Ortiz-Acevedo A.; Dalton A. B.; Dieckmann G. R.; Draper R. K.; Baughman R. H.; Musselman I. H. J. Am. Chem. Soc. 2005, 1273512323–12328. [DOI] [PubMed] [Google Scholar]
- Jin H.; Jeng E. S.; Heller D. A.; Jena P. V.; Kirmse R.; Langowski J.; Strano M. S. Macromolecules 2007, 40186731–6739. [Google Scholar]
- Johnson R. R.; Johnson A. T. C.; Klein M. L. Nano Lett. 2008, 8169–75. [DOI] [PubMed] [Google Scholar]
- Bachilo S. M.; Strano M. S.; Kittrell C.; Hauge R. H.; Smalley R. E.; Weisman R. B. Science 2002, 29856022361–2366. [DOI] [PubMed] [Google Scholar]
- Roxbury D.; Tu X.; Zheng M.; Jagota A. Langmuir 2011, 27138282–8293. [DOI] [PubMed] [Google Scholar]
- Weisman R. B.; Bachilo S. M. Nano Lett. 2003, 3, 1235–1238. [Google Scholar]
- Lefebvre J.; Finnie P. J. Phys. Chem. C 2009, 113187536–7540. [Google Scholar]
- Qian H.; Georgi C.; Anderson N.; Green A. A.; Hersam M. C.; Novotny L.; Hartschuh A. Nano Lett. 2008, 851363–1367. [DOI] [PubMed] [Google Scholar]
- Karachevtsev V. A.; Plokhotnichenko A. M.; Glamazda A. Y.; Leontiev V. S.; Levitsky I. A. Phys. Chem. Chem. Phys. 2014, 162210914–10922. [DOI] [PubMed] [Google Scholar]
- Koyama T.; Asaka K.; Hikosaka N.; Kishida H.; Saito Y.; Nakamura A. J. Phys. Chem. Lett. 2011, 23127–132. [Google Scholar]
- Luer L.; Crochet J.; Hertel T.; Cerullo G.; Lanzani G. ACS Nano 2010, 474265–4273. [DOI] [PubMed] [Google Scholar]
- Tan P. H.; Rozhin A. G.; Hasan T.; Hu P.; Scardaci V.; Milne W. I.; Ferrari A. C. Phys. Rev. Lett. 2007, 9913137402. [DOI] [PubMed] [Google Scholar]
- Linse B.; Linse S. Mol. Biosyst 2011, 772296–2303. [DOI] [PubMed] [Google Scholar]
Associated Data
This section collects any data citations, data availability statements, or supplementary materials included in this article.


