

Summary
Patch-clamp recordings revealed that distal processes of starburst amacrine cells (SACs) received largely excitatory synaptic input from the receptive field center and nearly purely inhibitory inputs from the surround during both stationary and moving light stimulations. The direct surround inhibition was mediated mainly by reciprocal GABAA synapses between opposing SACs, which provided leading and prolonged inhibition during centripetal stimulus motion. Simultaneous Ca2+ imaging and current-clamp recording during apparent-motion stimulation further demonstrated the contributions of both centrifugal excitation and GABAA/C-receptor-mediated centripetal inhibition to the direction-selective Ca2+ responses in SAC distal processes. Thus, by placing GABA release sites in electrotonically semi-isolated distal processes and endowing these sites with reciprocal GABAA synapses, SACs use a radial-symmetric center-surround receptive field structure to build a polar-asymmetric circuitry. This circuitry may integrate at least three levels of interactions—center excitation, surround inhibition, and reciprocal inhibitions that amplify the center-surround antagonism—to generate robust direction selectivity in the distal processes.
Introduction
The detection of movement direction is an essential visual function. The first stage of direction selectivity (DS) is accomplished in the inner plexiform layer of the retina, where synaptic interactions enable On-off and On direction-selective ganglion cells (DSGCs) to respond vigorously to a light stimulus moving in a particular (preferred) direction, but respond minimally to the same stimulus moving in the opposite (null) direction (Barlow and Hill, 1963; Barlow et al., 1964; Barlow and Levick, 1965). While the retinal circuit subserving DS has been used as a classic model system for studying neural computation in the CNS for over four decades (Taylor and Vaney, 2003), the mechanism underlying DS remains elusive. Recent studies have made several important findings. First, the direction-selective response of On-off DSGCs originates mainly from presynaptic interactions because the excitatory and inhibitory inputs to DSGCs are themselves directionally selective (Borg-Graham, 2001; Fried et al., 2002, 2005; Taylor and Vaney, 2002). In particular, starburst amacrine cells (SACs) (Famiglietti, 1983; Tauchi and Masland, 1984; Vaney, 1984) provide spatially asymmetric inhibition to DSGCs (Fried et al., 2002). Ablation of SACs also abolishes DS and optokinetic eye movement (Yoshida et al., 2001; Amthor et al., 2002). Second, because SACs have recently been shown to release GABA by a vesicular mechanism (Zheng et al., 2004), it is likely that the release sites are in the distal varicose zone, where synaptic vesicles are concentrated (Famiglietti, 1991), suggesting that the distal varicose zone is the primary source of the asymmetric GABA inhibition of DSGCs. Third, the distal varicose processes of SACs themselves respond to centrifugal and centripetal stimulus motion with direction-selective Ca2+ signals (Euler et al., 2002). These findings lead to the current theory that DS is mediated mainly by the direction-selective GABA release from SACs, which acts asymmetrically on DSGCs from the null side (Taylor and Vaney, 2003, but see Fried et al., 2005; Oesch et al., 2005 for additional mechanisms). However, a central question in this theory remains unresolved: how are direction-selective responses generated in distal SAC processes at the first place?
Theoretically, direction-selective responses in SAC processes may arise from two sources: intrinsic cellular properties (Tukker et al., 2004) and network interactions (Borg-Graham and Grzywacz, 1992). While much of the current attention focuses on the intrinsic properties of SACs (Euler et al., 2002; Gavrikov et al., 2003; Ozaita et al., 2004), the synaptic basis for direction-selective responses in SACs remains unknown (Fried et al., 2005) and puzzling. On one hand, neighboring SACs overlap extensively, with a dendritic coverage factor (defined as the product of a SAC dendritic field area and the SAC density) as high as 30–70 (Tauchi and Masland, 1984; Vaney, 1984; Famiglietti, 1985). The extraordinarily high degree of cofasciculation and the presence of functional GABAA receptor-mediated synapses between overlapping SACs (Zheng et al., 2004) suggest important synaptic interactions among SACs. On the other hand, because direct GABAergic input to SACs has not been characterized during stimulus motion (Taylor and Wassle, 1995; Peters and Masland, 1996), and because the spatial organization of the GABAergic interaction between SACs is unknown (Zheng et al., 2004), there is as yet no evidence for an important role of any GABAA-mediated synaptic interactions in the formation of DS in SACs (Euler et al., 2002).
The goal of this study was to determine whether synaptic interactions have a role in the direction-selective responses of SACs and, if they do, what the essential synaptic circuitry supporting these interactions is. Patch-clamp and Ca2+ imaging experiments revealed that the reciprocal GABAergic inhibition between SACs provided a robust synaptic mechanism for DS in SACs.
Results
Reciprocal GABAergic Inhibition between Distal Processes of Neighboring SACs
To understand the spatial organization of synaptic interactions between SACs, dual patch-clamp recordings were made from pairs of displaced SACs, whose relative position belonged in one of four configurations: (1) near neighbors separated by an intersoma distance of ≤1/3 SAC dendritic radius (~50 μm at the retinal eccentricity studied; see Experimental Procedures), (2) intermediate neighbors separated by ~1 dendritic radius (~150 μm), (3) distant neighbors separated by five-thirds to 2 dendritic radii (~250–300 μm), and (4) nonoverlapping neighbors separated by >2 dendritic radii (>300 μm) (Figures 1A and 1B). Synaptic transmission was studied by depolarizing one SAC (referred to henceforth as the presynaptic cell) with voltage steps while recording the synaptic responses from the other SAC in the pair (referred to henceforth as the postsynaptic cell) under voltage clamp at −5 mV (~Ecation). Reciprocal synaptic transmission was detected in six out of the eight near pairs, six out of the eight intermediate pairs, four out of the five distant pairs, and zero out of the three nonoverlapping pairs of SACs recorded, demonstrating the existence of reciprocal synapses between SACs in all three overlapping configurations, but not in the nonoverlapping configuration (Figure 1B). The postsynaptic currents recorded from overlapping SAC pairs became undetectable at −75 mV (~ECl, Figure 1C, n = 13 pairs) and were completely blocked by the Ca2+ channel blocker Cd2+ (500 μM, Figure 1D, n = 4 pairs) and the GABAA receptor antagonist SR95531 (50 μM, Figure 1E, n = 6 pairs), consistent with the response being mediated by GABAA receptors. The finding of GABAergic reciprocal synaptic transmission between SACs in the distant configuration had two important implications. First, the distal processes of SACs released GABA in a Ca2+-dependent manner and received GABAergic inhibition from neighboring SACs in a reciprocal manner. Second, the lateral GABAergic inhibition between SACs had a spatial extent (maximum intersoma distance) of twice the SAC dendritic radius (~300 μm).
Figure 1. Spatial Profile of GABAergic Interactions between Starburst Cells.

(A) Fluorescence photomicrographs of SAC pairs recorded in four spatial configurations: near, intermediate, distant, and nonoverlapping pairs. The cells were whole-cell voltage-clamped with pipettes filled with Lucifer yellow. Scale bar, 100 μm.
(B) Step depolarization (from −75 mV to −5 mV or +5 mV, top traces) of presynaptic cells under dual patch-clamp recording evoked postsynaptic responses in a reciprocal manner (Vh = −5 mV, middle and bottom traces) in all three overlapping configurations, but not in the nonoverlapping configuration.
(C) Dual voltage-clamp recordings from another four SAC pairs, showing outward postsynaptic currents at Vh = −5 mV and a lack of detectable response at Vh = −75 mV in the three overlapping configurations. No response was detected at either Vh = −5 mV or Vh = −75 mV in the non-overlapping configuration.
(D) Voltage-clamp recording from an overlapping SAC pair, showing presynaptic current responses to a series of nine depolarizing steps (in 10 mV amplitude increments, Vh = −75 mV) and postsynaptic responses recorded at Vh = −5 mV. Voltage steps to −45 mV and higher elicited voltage-gated Ca2+ currents and Ca2+-activated currents in the presynaptic cell and outward synaptic currents in the postsynaptic cell. CdCl2 (0.5 mM) completely blocked both the presynaptic Ca2+ and Ca2+-activated currents (inset) and the postsynaptic responses.
(E) Relationship between the peak postsynaptic current amplitude and the level of presynaptic depolarization in the control solution (filled symbols) and in the presence of 50 μM SR95531 (open symbols).
SAC Receptive Field Structure under Stationary Light Stimulation
To investigate whether direct (feedforward) GABAergic inhibition to SACs influenced the receptive field properties of the cells, we examined the responses of SACs to stationary light annuli of various radii presented on a dark background (Figure 2A). SACs were voltage-clamped at −75 and −5 mV to isolate light-evoked excitatory and inhibitory currents, respectively. Inhibitory synaptic currents (outward at −5 mV) were evoked by light annuli located both within and outside the SAC dendritic field, whereas excitatory synaptic currents (inward at −75 mV) were evoked mainly within the dendritic field (Figure 2A). The onset of the excitatory response to an annulus (flashed at the distal dendrites) occurred 62 ± 16 ms (n = 6) after the onset of the light step, and the onset of the inhibitory current response was further delayed by 25 ± 10 ms (n = 6) (see Experimental Procedures). To compare the spatial profiles of the light-evoked excitatory and inhibitory inputs to SACs, we plotted the normalized peak amplitude of the excitatory and inhibitory currents against the position of the light annuli (Figure 2B, n = 4). Notably, the outer boundary of the inhibitory input was always larger than that of the excitatory input. The farthest distance at which a light annulus could evoke inhibitory postsynaptic currents (i.e., the radius of the direct inhibitory receptive field) was about twice the SAC dendritic radius (~300 μm, Figure 2B), which closely matched the maximal intersoma distance between two mutually inhibitory SACs recorded under dual patch-clamp (Figure 1). Given that SACs cofasciculate far more extensively with their neighboring SACs than with any other amacrine cell types (Tauchi and Masland, 1984; Vaney, 1984; Famiglietti, 1985), the above results suggest that the majority of the light-evoked inhibitory inputs to a SAC were directly from neighboring starburst cells.
Figure 2. SAC Receptive Field Structure under Stationary Light Illumination.

(A) Responses of a voltage-clamped SAC to 1 s long flashes of light annuli (60 μm in thickness), showing inward (red traces, recorded at −75 mV) and outward (blue traces, recorded at −5 mV) currents evoked by light annuli of various radii (color coded).
(B) Normalized peak inward and outward currents as a function of the annulus position (median radius of the annulus). Data were averaged from four SACs and fitted by a Gaussian function.
(C) Effects of SR95531 (SR, 50 μM), TPMPA (50 μM), and strychnine (STRY, 1 μM) on the outward currents evoked by a light annulus (150 μm in median radius).
(D) Summary of the pharmacological effects of SR (50 μM), TPMPA (50 μM), and strychnine (1 μM) on the initial peak (filled bars) and the late (open symbols, measured at the end of the 1 s long flash) current responses. Numbers in parentheses indicate the number of cells tested.
(E) The spatial profile of the normalized peak inward (red) and outward (blue) currents recorded before (solid curves) and after (broken curves) the application of TPMPA (50 μM) and strychnine (1 μM) (data pooled from five SACs). Error bars, standard deviation.
The inhibitory current inputs to SACs during stationary annulus illumination were largely blocked by SR95531 (50 μM), leaving behind a residual component that had slower onset kinetics and could be blocked by the glycine receptor antagonist strychnine (1 μM) (Figure 2C1). Application of strychnine alone did not change the peak inhibitory current substantially, but markedly reduced a slower component of the outward current (Figure 2C2). Coapplication of SR95531 (50 μM) with strychnine (1 μM) consistently blocked nearly all outward currents (Figures 2C1 and 2C3), whereas the addition of the GABAC antagonist TPMPA (50 μM) to strychnine had little additional effect (Figure 2C4). A quantitative analysis of these pharmacological results (Figure 2D) indicated that the majority of the inhibitory response, particularly the initial peak response, to an annular light stimulus was mediated by GABAA receptors, consistent with the above suggestion that most of the direct inhibition to SACs was mediated by neighboring SACs via GABAA receptors (see Discussion for potential interactions among GABAA/C and glycine systems). In addition to the GABAA component, there was also a slower glycinergic component in the inhibitory response. However, no direct GABAC-mediated response was detected in SACs, consistent with a previous finding that SACs do not express bicuculline-resistant GABA receptors (Zhou and Fain, 1995). Importantly, in the presence of strychnine and TPMPA to isolate the GABAA component, the spatial profiles of the peak inhibitory and excitatory inputs were not systematically different from those in the control solution (Figure 2E, n = 6), demonstrating that the spatial extent of the light-evoked, GABAA-mediated synaptic input to SACs was similar to that of the direct inhibition between SACs. Hence, SACs had a concentric center-surround receptive field structure formed by both direct excitatory inputs to an ~150 μm radius center (similar to the dendritic field) and direct inhibitory inputs from an ~300 μm radius surround (twice the dendritic radius), mediated largely by the GABAA synapses between SACs.
Synaptic Inputs to SACs during Stimulus Movement
To test whether the above center-surround receptive field structure has a role in forming a spatiotemporally asymmetric circuitry during stimulus motion, we examined SAC responses to an annular light stimulus moving either centripetally or centrifugally (Figure 3A1). The speed of annulus movement on the retina was 300 μm/s (except for the experiments shown in Figure 3C). The onset of the inhibitory synaptic input (outward currents measured at −5 mV) preceded that of the excitatory input (inward currents at −75 mV) by 347 ± 93 ms (n = 37 cells) during centripetal (CP) stimulus motion (Figure 3A2, left), whereas no leading inhibition was detected during centrifugal (CF) motion stimulation (Figure 3A2, right). Notably, the temporal delay (347 ms) between the onset of the inhibitory and the excitatory input during CP motion corresponded to a spatial displacement (temporal delay × movement speed) of 104 μm, which matched the spatial offset between the excitatory and inhibitory current profiles measured under stationary light stimulation (Figure 2B), and was close to, but did not exceed, the spatial extent of the direct surround inhibition from neighboring SACs (~150 μm from the dendritic field perimeter). To correlate the temporal and the spatial properties of the excitatory and inhibitory inputs during motion stimulation, we plotted the normalized inhibitory and excitatory currents against the time and location of the stimulus (Figure 3A3). The results showed that, when a CP annulus first entered the distal zone (dashed lines in Figure 3A3, left), the inhibitory currents were already nearly fully activated, while the excitatory currents just began to develop, demonstrating a clear leading inhibition during CP motion. Moreover, the inhibitory current was prolonged, covering the entire duration of the subsequent excitatory input. However, when a CF annulus first entered the distal zone from the center (dashed lines in Figure 3A3, right), the excitatory currents already nearly reached their peak values, whereas the inhibitory currents just began to develop. We did not detect any leading inhibition during CF motion (Figure 3A3, right) (see Discussion).
Figure 3. Spatiotemporal Profile of Synaptic Inputs to SACs during Stimulus Motion.

(A1) Drawings of a light annulus (60 μm in thickness) moving centripetally (left) and centrifugally (right). The centripetal movement started at an inner annulus radius of 840 μm and ended at 0 μm, while the centrifugal movement covered the same path in reverse order. (A2) Inhibitory (outward at −5 mV, black trace) and excitatory (inward at −75 mV, gray trace) currents recorded from a voltage-clamped SAC during centripetal (left) and centrifugal (right) stimulus movement. Vertical dash lines in (A2) and (A3) indicate the time at which the inner edge of the annulus first reached the distal dendritic tip during the centripetal movement (left) and when the outer edge of the annulus first reached the distal varicose zone (2/3 of the SAC radius) during the centrifugal movement (right). The origin of the x axis (0 s) corresponds to the time the annulus first appeared during centrifugal motion or the time the annulus illumination was terminated during centripetal motion (when the inner edge of the annulus first reached the soma). (A3) Comparisons of the inhibitory current (black trace) and excitatory current (gray trace, inverted and scaled to the peak amplitude of the inhibitory current) during centripetal (left) and centrifugal (right) movement (data from the same cell as in [A2]). The inhibitory current preceded the excitatory current during the centripetal, but not the centrifugal, movement.
(B1) Same centrifugal stimulus motion as in (A1), except that the SAC was masked at the center (60 μm in radius). (B2) Inhibitory (outward at −5 mV, black trace) and excitatory (inward at −75 mV, gray trace) responses to the stimulus motion shown in (B1). Arrow indicates the time at which the centrifugally moving annulus first appeared from behind the mask. Dashed line indicates the time at which the outer edge of the annulus first reached the distal zone (2/3 of the SAC radius).
(C) Spatial offset between the inhibitory and excitatory inputs during CP motion as a function of movement speed. The spatial offset was measured as the temporal delay between the onset of the inhibitory and excitatory inputs multiplied by the movement speed. Data were pooled from 14 cells tested for speeds between 100 and 1800 μm/s and from 4 cells tested between 30 and 3000 μm/s.
Error bars = standard deviation.
Because the above CF stimulus began from the SAC soma, it remained possible that the quick onset of the excitatory input seen during CF stimulation was due to bipolar cell inputs located close to the soma, thus not necessarily reflecting the timing of the excitatory input to the distal processes. To partially alleviate this concern, we repeated the same CF stimulation while masking the central region (within a 60 μm radius) of the receptive field center so that the light annulus emerged gradually from behind the mask (Figure 3B1). Under this stimulation condition, the currents recorded were expected to more closely reflect the response of distal processes to local stimulus motion. However, we found that CF stimulation in local distal dendrites still did not evoke a leading inhibition (Figure 3B2), supporting the conclusion that SAC distal processes received a leading inhibition during CP, but not CF, motion (see Discussion).
DSGCs are sensitive to image movement in the preferred direction across a wide range of speeds, with On DSGCs being most sensitive to low speeds (~0.6 degrees/s) and On-off DSGCs more sensitive to high speeds (>3 degrees/s) (Oyster, 1968). We next examined the temporal relationship between the excitatory and inhibitory inputs to SACs during CP image movement at six different image speeds: 33, 100, 300, 900, 1800, and 3000 μm/s (or ~0.3, 1, 3, 9, 18, and 30 degrees/s for P21 rabbits, see Experimental Procedures). A temporal delay between the onset of the inhibitory and the excitatory inputs was clearly resolvable in this speed range. As shown in Figure 3C, the spatial offset (temporal delay × speed) between the inhibitory and excitatory inputs ranged from 50 to 125 μm for CP movement speeds between 30 and 3000 μm/s (see Discussion).
The leading inhibitory synaptic input during CP stimulus motion was blocked nearly completely (94.9% ± 3.6% reduction in peak amplitude, n = 6) by SR95531 (50 μM, Figure 4A, left), leaving behind only a small and much delayed inhibitory current component (see below). However, the peak outward current during CF stimulation was only slightly reduced (8.5% ± 12.2% reduction, n = 6) by SR95531 (50 μM, Figure 4A, right), though an initial, small inhibitory synaptic current was largely blocked by SR95531 (98% ± 15%, n = 6), indicating that GABAA inputs to SACs are dependent on the direction of the stimulus motion (see Discussion). On the other hand, blocking GABAC receptors with TPMPA (50 μM) had little effect on the inhibitory currents during either CP or CF stimulus motion (<5% change in peak amplitude, n = 4), except slightly reducing the decay rate of the inhibitory currents (Figure 4B). When both GABAA/C and glycine receptors were blocked by a combination of SR95531 (50 μM), TPMPA (50 μM), and strychnine (1 μM), the inhibitory synaptic currents were blocked nearly completely during both CP and CF motions (97.5% ± 1.3% and 96.45% ± 1.7%, respectively; n = 4, Figure 4C). These spatiotemporal and pharmacological results were consistent with the conclusion that the asymmetric leading inhibition to SAC distal processes during CP stimulation was mediated predominantly by GABAA synapses, most likely those between SACs.
Figure 4. Pharmacological Properties of Synaptic Inputs during Stimulus Motion.

(A) Inhibitory (outward at −5 mV) and excitatory (inward at −75 mV) synaptic currents from a voltage-clamped SAC in control conditions (black traces) and in the presence of SR95531 (50 μM, gray traces) during centripetal (left) and centrifugal (right) annulus motion (same as in Figure 3A1). SR95531 nearly completely blocked the large leading inhibitory current during centripetal motion; it also blocked the small, initial outward current during centrifugal motion.
(B) Voltage-clamp recording from another SAC, showing that TPMPA (50 μM) had no obvious effect on light-evoked currents during centripetal and centrifugal motion except for a slight prolongation of the inhibitory currents.
(C) Inhibitory currents recorded from a voltage-clamped SAC, showing that the combination of SR (50 μM), STRY (1μM), and TPMPA (50μM) completely blocked the inhibitory currents during both centripetal and centrifugal motions.
Surround Feedback Inhibition during Centripetal Stimulus Motion
In addition to the direct feedforward inhibition from the surround, SACs also received indirect surround inhibition via the inhibition of glutamate input at sites presynaptic to SACs. In the absence of light stimulation, voltage-clamped SACs typically displayed tonic excitatory postsynaptic currents (EPSCs). These tonic EPSCs became suppressed during CP stimulation (Figure 5A). This presynaptic inhibition had a generally broad spatial extent, beginning to develop when the CP annulus was as far as ~870 μm away from the SAC soma, in contrast to the direct feedforward inhibition, which was limited to within a ~300 μm radius (Figure 3). When recorded at the resting potential (~ −45 mV) under current-clamp in a K+-based pipette solution (ECl ~−70 mV, see Experimental Procedures), SACs responded to CP stimulation with an initial hyperpolarization and a reduction in baseline noise (Figure 5B1). This hyperpolarization began to develop when the annulus was also as far as ~870 μm (average distance: 606 ± 145 μm, n = 20) away from the SAC soma and increased in amplitude as the annulus moved closer to the soma. When the same SAC was held at a more negative potential (closer to ECl), the amplitude of the wide-field hyperpolarization increased, suggesting that the hyperpolarization was caused largely by a reduction in glutamate conductance, but not by an increase in chloride conductance, in SACs (Figure 5B2). This hyperpolarizing effect was overcome eventually by a large depolarization when the annulus moved to the edge of the receptive field center (~150 μm from the soma) (Figures 5B1 and 5B2).
Figure 5. Wide-Field Surround Inhibition during Centripetal Stimulus Motion.

(A) Voltage-clamp recording from a SAC, showing a reduction in background excitatory postsynaptic currents at Vh = −75 mV. This reduction began to develop when the light annulus was as far as ~870 μm away from the soma, followed by a strong excitatory (inward) current when the annulus entered the receptive center (~150 μm from soma). Shaded region indicates the spatial extent of this inhibition.
(B1) Whole-cell current-clamp recording (with a K+-based pipette solution) from a SAC at the resting membrane potential (~−45 mV, [B1]), showing a gradually developing hyperpolarization during CP motion. This hyperpolarization began to develop when the annulus was ~870 μm from the soma and was overcome by a depolarization when the annulus entered the receptive field center (~150 μm from the soma). (B2) Holding the same cell as in (B1) at a more negative potential (~−70 mV, or ECl) enhanced the amplitude of the wide-field hyperpolarization during centripetal motion.
(C) Application of TPMPA (50 μM) together with SR95531 (50 μM) blocked the wide-field hyperpolarization during centripetal motion at both the resting (C1) and more hyperpolarized (C2) potentials.
(D) Whole-cell current-clamp recording with a Cs+-based pipette solution from a SAC at three different membrane potentials during a centripetal light stimulus. Traces in the lightly shaded area demonstrated the wide-field (300–870 μm from the soma) surround effect, which was hyperpolarizing and noise-reducing at −55 mV, undetectable at −5 mV, and depolarizing at +25 mV. The traces in the darkly shaded area (150–300 μm from soma) reflected mainly the medium-field surround effect, which was hyperpolarizing at both +25 and −5 mV, but was not associated with an obvious change in membrane potential at ~−70 mV (ECl) (consistent with shunting inhibition). Vertical dashed lines indicate the time at which the leading edge of the annulus entered the center receptive field (150 μm from the soma). Arrows point to the starting time and the initial position of the centripetally moving annulus.
Blocking ionotropic GABA receptors with TPMPA (50 μM) together with SR95531 (50 μM) blocked the wide-field hyperpolarization consistently and nearly completely (95.0% ± 7.7% reduction in amplitude, n = 6) (Figures 5C1 and 5C2), suggesting that this wide-field inhibition of the glutamate input to SACs was mediated mainly by ionotropic GABA receptors. However, application of TPMPA or SR95531 alone had a less consistent effect. TPMPA blocked the hyperpolarization in four of the six cells tested, but did not have a clear effect in the remaining two cells (average blockade in the six cells: 56% ± 32%), whereas SR95531 blocked or reduced the hyperpolarization in five cells, had no effect in three cells, and enhanced the hyperpolarization in two cells (average effect in the ten cells tested: 37% ± 45% blockade). These results suggested that the wide-field inhibition was likely mediated by both GABAC and GABAA receptors, and that additional interactions between the GABAA and GABAC systems might have contributed to the variability associated with the effects of TPMPA and SR95531 when these drugs were applied individually (see Discussion). One likely site of this wide-field inhibition is bipolar cell axon terminals because most GABAC receptors are expressed on the axon, but not on the dendrites, of mammalian bipolar cells (Shields et al., 2000), although surround inhibition in the outer plexiform layer can not be ruled out.
To compare the effects of the direct/feedforward and the indirect/feedback inhibition on the SAC distal processes over a wider range of membrane potentials, we current-clamped SACs using a Cs+-based pipette solution, which blocked most of the KV3 voltage-gated potassium currents (Ozaita et al., 2004) and enabled the cell to be held above −20 mV. The wide-field hyper-polarization during CP stimulation was prominent when the cell was held initially at −55 mV (near the normal resting potential); it was eliminated at ~ −5 mV (~Ecation) and became depolarizing at +25 mV (Figure 5D, lightly shaded region). However, the medium-range (150–300 μm) inhibition (Figure 5D, darkly shaded region) did not show an obvious effect on membrane potential at ~ −70 mV (~ECl) (as expected from a shunting inhibition), but it effectively hyperpolarized the cell near −5 mV and +25 mV. Thus, the feedback and feedforward surround inhibitions had different spatial structures (wide-field versus medium field) and were mediated by different cells (most likely wide-field amacrine cells versus predominantly SACs) and different synaptic receptors (predominantly GABAA/C versus GABAA) (see Discussion).
Light-Evoked Ca2+ Responses in SAC Distal Processes
To determine directly whether asymmetric synaptic interactions mediate the direction-selective Ca2+ responses in SAC distal processes, we measured the distal Ca2+ responses to apparent motion using simultaneous Ca2+ imaging and whole-cell current-clamp with a K+-based pipette solution containing Oregon Green BAPTA-1 488 (OGB, see Experimental Procedures). Apparent motion was generated by flashing two adjacent light spots (conditioning and test) in a quick succession. The conditioning spot (CP or CF, Figure 6A) was projected to the retina through the microscope condenser lens. The test spot (Test, Figure 6A) was projected from the epifluorescence lamp through the objective lens and served as both a visual stimulus for the photoreceptors and the excitation light for Ca2+ imaging (see Experimental Procedures). As shown in Figures 6B and 6C, flashing the test spot alone elicited a transient fluorescence (Ca2+) response from the distal processes, accompanied by a membrane depolarization that was recorded at the soma (Figure 6B, left). However, when preceded by a CP conditioning flash during a simulated CP motion, the Test flash elicited a much smaller fluorescence response (Figure 6B, center). The percent reduction of the peak response amplitude to the Test flash (ΔF/F, where F is the peak response to the Test flash alone, and ΔF is the change in F caused by the CP conditioning flash) was 48% ± 6% (mean ± SD, measured from 36 varicosities in nine cells; 4 varicosities from each cell; Figure 6C, black bars). In contrast, the CF conditioning flash enhanced the peak response to the Test flash (Figure 6B, right) by 20% ± 10% (mean ± SD, n = 36 varicosities in nine cells; 4 varicosities from each cell, Figure 6C, black bars). These results not only confirmed a previous report of directionally asymmetric Ca2+ responses to continuous stimulus motion (Euler et al., 2002), but also revealed that direction selectivity in SAC distal processes was generated by two processes: CP inhibition and CF excitation.
Figure 6. Ca2+ Responses in Distal Processes of SACs during Apparent Stimulus Motion.

(A) (Left) Photomicrograph of a SAC under whole-cell current-clamp with a pipette filled with OGB. Drawings marked CF, CP, and Test show the boundaries of the CF, CP, and Test flash, respectively. The dotted rectangle inside the Test flash indicates the area from which Ca2+ imaging was acquired. (Right) Blown-up view of the area under Ca2+ imaging, with arrowheads indicating the varicosities from which Ca2+ signals were measured. Scale bar, 50 μm.
(B) Simultaneous Ca2+ imaging (top panels) and whole-cell current-clamp (bottom panels) from the cell in (A). Fluorescence responses from the eight varicosities in ([A], right) are shown in different colors, with the average responses shown in black. The timing of the flashes is shown at the top in each panel.
(C) Relative changes in the peak response amplitude to the Test flash caused by CP and CF conditioning flashes. Data were averaged from 36 varicosities in nine cells (4 varicosities per cell). Error bars, standard deviation.
(D) Fluorescence responses of the eight varicosities shown in ([A], right) to a Test flash (top trace), showing an initial step response (Fo) within the first 50 ms of the light onset (the average response is shown in black).
(E) Illustration of the parameters used for calculating relative changes in peak fluorescence responses caused by the apparent motion.
(F) Effects of GABAA and GABAC antagonists on CP inhibition (all traces show averaged results measured from four varicosities). (F1) (Left) CP flash inhibited the peak Ca2+ response to the Test flash. This inhibition (the difference between blue and red traces in the left panel) was abolished by SR95531 (50 μM, center panel) in this cell. TPMPA (100 μM) and SR95531 (50 μM) together slowed down the decay rate of the responses and blocked CP inhibition (right). (F2) CP inhibition in another cell (shown as the difference between the blue and red curves in the left panel) persisted in the presence of TPMPA (100 μM), but was eliminated by the combination of TPMPA (100 μM) and SR95531 (50 μM) (right panel).
(G) Summary of the pharmacological effects of SR95531 (50 μM), TPMPA (100 μM), and strychnine (2 μM) on the CP inhibition of the peak Ca2+ response to the Test flash. n, number of varicosities tested. The number in parentheses indicates the number of cells tested. Error bars, standard deviation.
The total fluorescence response (F) to the Test flash (Figure 6D) consisted of two components: the baseline fluorescence (Fo), which reflected the Ca2+ concentration immediately before the Test flash, and a change in fluorescence intensity (F − Fo) caused by the Ca2+ response that was evoked by the Test flash. Because the onset of light-evoked excitatory currents in a SAC lagged behind the onset of the light stimulus by an average of 62 ms (Figure 2A, also see Peters and Masland, 1996), and because the Ca2+ response in SAC dendrites lagged behind the light stimulus by 60–100 ms (estimated from results in Euler et al., 2002), the fluorescence intensity measured during the initial ~50 ms of the Test flash should reflect mainly Fo (see Experimental Procedures). In most cases, Fo could be measured from the brief step seen at the onset of the fluorescence response traces, when the Ca2+ response to the Test flash had not yet developed (Figure 6D). By correcting for this baseline intensity, we could quantify the effect of apparent-motion stimulation more precisely as ΔF/(F − Fo), where ΔF and (F − Fo) were defined as above (Figure 6E). Using this definition, the CP conditioning flash was found to inhibit the Ca2+ response to the Test flash by 73% ± 6%, and the CF conditioning flash to enhance the Test flash response by 32% ± 16% (mean ± SD, n = 36 varicosities; 4 from each of the nine cells, Figure 6C, gray bars).
To gain an insight into the synaptic mechanism underlying CP inhibition during apparent motion, we examined whether GABAA-mediated synaptic transmission was involved in the CP inhibition. SR95531 (50 μM) reduced the CP inhibition from a ΔF/(F − Fo) of 80% ± 15% down to 34% ± 23% (Figures 6F1 and 6G), suggesting that the GABAA system had a major contribution to the CP inhibition. Application of TPMPA (100 μM) and strychnine (2 μM) on top of SR95531 further decreased the CP inhibition to a ΔF/(F − Fo) value of 11% ± 14% (mean ± SD, Figures 6F1 and 6G), indicating an additional contribution of GABAC and glycine receptors to CP inhibition. However, in the absence of SR95531, TPMPA (100 μM) (or 100 μM TPMPA + 2 μM strychnine) had a smaller effect on the CP inhibition, reducing ΔF/(F − Fo) from 80% ± 15% to 63% ± 17% (Figures 6F2 and 6G). Addition of SR95531 to TPMPA in the same SAC again nearly completely blocked the CP inhibition (Figure 6F2). These results demonstrate that GABAA-mediated synaptic interaction plays a major role in CP inhibition during apparent motion, while GABAC and glycine receptors mediate a smaller part of the CP inhibition at SAC distal processes. The CP inhibition is likely produced by a combination of both a feedforward inhibition of SACs mediated mainly by GABAA receptors and a feedback inhibition of bipolar cells mediated by GABAC, GABAA, and possibly glycine receptors (see Discussion for potential interactions among various inhibitory systems).
Discussion
This study revealed a synaptic circuitry subserving direction selectivity in SACs. We identified four basic components of this circuit. (1) The distal processes of a SAC released GABA in a Ca2+-dependent manner and received GABAA inhibition from neighboring SACs in a reciprocal manner. (2) SACs had a concentric center-surround receptive field, consisting of an excitatory center mediated by glutamatergic inputs and a direct (feed-forward) inhibitory surround mediated predominantly by GABAA inputs. (3) The distal dendrites of SACs received prolonged, leading inhibition from the surround during CP motion. (4) The directionally asymmetric Ca2+ response in SAC distal processes was produced by both CF excitation and CP inhibition, and the CP inhibition was mediated largely by GABAA synapses.
The Basic Synaptic Mechanism Underlying Direction Selectivity in SACs
Based on the above findings, we propose a synaptic mechanism for direction selectivity in SACs (Figure 7). This mechanism has three simple but important features. First, the basic synaptic circuit is built on a classic center-surround receptive field structure. This structure is directionally symmetric to neurons that make integrative decisions at the soma or axon hillock, but fundamentally asymmetric to SACs, whose signal processing units reside in the electrotonically semi-isolated distal processes (Figure 7A). To these distal processing units, inputs are nearly purely inhibitory from one direction (CP) and predominantly excitatory from the opposite direction (CF) (Figure 7A). Second, this structure enables the distal processing units of a SAC to use both CP inhibition and CF excitation to achieve robust direction selectivity. The leading CP inhibition is largely mediated by GABAergic inhibition from surround SACs, while the CF excitation is mediated by glutamatergic input and may involve both intrinsic and synaptic mechanisms to produce a centrifugal preference (Figure 7A). Third, the reciprocal GABAergic inhibition between neighboring SACs enables the center SAC to inhibit the surround SAC during CF stimulus movement, resulting in a suppression of the background inhibition from the surround to the center and hence an enhancement of the center excitation (Figure 7B). Similarly, during CP stimulation, the same reciprocal GABA synapses enable the surround SAC to inhibit the center SAC, thereby suppressing the background inhibition from the center to the surround SAC and resulting in an enhancement of the surround inhibition (Figure 7B). In effect, the reciprocal GABA synapses between SACs create a local positive feedback loop, though the loop is linked by two inhibitory, rather than excitatory, synapses. This positive feedback loop amplifies any imbalance between the center and the surround SACs and enhances the center-surround antagonism. Taken together, our results suggest that at least three levels of interactions (CP inhibition, CF excitation, and reciprocal interactions between CP and CF inputs) are built into the center-surround receptive field structure of SACs to produce a robust mechanism for direction selectivity in the distal processes.
Figure 7. A Synaptic Model of Direction Selectivity at the Distal Processes of SACs.
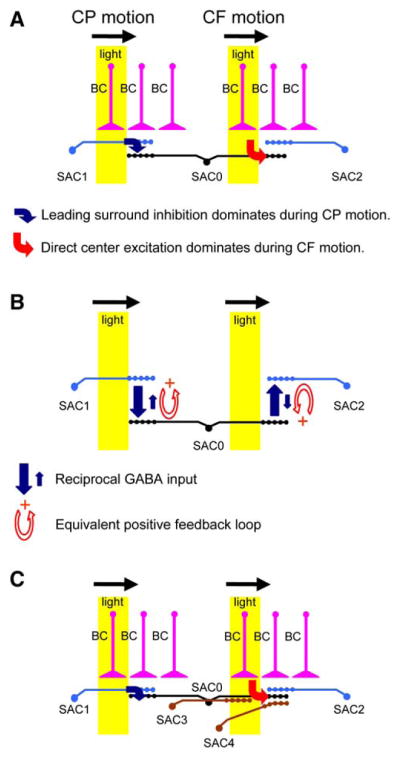
(A) The center-surround receptive field structure of a SAC (SAC0), showing the dominating synaptic inputs to its distal processes during CP and CF movements. The CP light stimulus evokes a leading GABAergic input (blue arrow) to the distal zone from the surround SAC (SAC1), whereas CF light evokes predominantly an excitatory input (red arrow) to the distal unit from the center. BC, cone bipolar cells.
(B) The reciprocal GABAA synapses between opposing SACs create a positive feedback loop, such that during CP movement (with respect to SAC0) GABAergic inhibition from the surround (large blue arrow from SAC1 to SAC0) suppresses the center SAC (SAC0) and reduces the background GABAergic inhibition from the center to the surround (small blue arrow from SAC0 to SAC1). The same feedback loop also operates during CF motion to amplify the inhibition from SAC0 to SAC2 and reduce the inhibition from SAC2 to SAC0.
(C) A more detailed synaptic circuit of a SAC (SAC0), showing potential synaptic contacts from other SACs (SAC3, SAC4) that have dendrites pointing in a parallel direction (rightward). SAC3 is separated from SAC0 by a mean near-neighbor distance of 45 μm, making it less likely to synapse on the distal dendrites of SAC0 along the parallel direction (rightward). SAC4 soma is also separated from SAC0 by 45 μm, but it is off from the axis formed by SAC0 dendrites shown here. SAC4 can potentially synapse on the distal zone of SAC0. However, the rightward dendrites of SAC0 and SAC4 are stimulated simultaneously by the light during the CF movement (in the area highlighted in yellow), making it unlikely for SAC4 to send leading inhibition to the SAC0 distal zone. Not shown in this diagram is the wide-field surround inhibition upstream of SACs, potential feedback from SACs to bipolar cells, and glycinergic input to SACs.
How is the directionally asymmetric response in SAC distal dendrites transmitted to DSGCs to produce direction selectivity? According to recent findings of Werblin and colleagues (Fried et al., 2002), this is achieved by directionally asymmetric synaptic connections between SACs and DSGCs such that DSGC dendrites receive GABAergic synaptic inputs only from SAC dendrites pointing in the null direction. In this model, since only a sector of a SAC’s dendrites is used to inhibit DSGCs of a particular preferred direction, a single SAC can use the rest of its dendritic sectors independently to inhibit DSGCs of other preferred directions, thus providing directional inhibition to potentially all four types of On-off and, in the case of a displaced SAC, possibly all three types of On DSGCs as well (see review by Taylor and Vaney, 2003). Importantly, our results now demonstrate that, in order to receive robust directional GABAergic inhibition from a SAC, a DSGC cannot simply make selective synapses with single SAC dendrites. Rather, it must make selective synapses with SAC dendrites that are synaptically coupled to other SAC dendrites. This may explain the anatomical finding that, in the terminal region, there are virtually no SAC dendrites that do not end in apposition to dendrites of neighboring SACs (Tauchi and Masland, 1985). It may also explain, at least in part, why SACs have such an unusually high degree (up to 70-fold) of dendritic field overlap, and why the overlapping dendrites do not cover the retinal space uniformly or randomly, but only in a honeycomb-shaped meshwork of dendritic fascicles (Vaney, 1984; Famiglietti, 1985; Tauchi and Masland, 1985).
Ca2+-Dependent, Reciprocal GABAergic Inhibition at SAC Distal Processes
Our finding of Ca2+-dependent GABA release and reciprocal GABAA inhibition between distal processes of opposing SACs has several important consequences. First, because of the steep dependence of vesicular release on Ca2+ (Dodge and Rahamimoff, 1967; Sakaba and Neher, 2001) the directionally selective Ca2+ response seen in SAC distal processes during apparent motion (Figure 6) now indicates a far more dramatic directional asymmetry in GABA release than what would be predicted from a transporter-mediated GABA release mechanism. Second, because Ca2+-dependent GABA release from SACs has a threshold for activation (Figure 1D), regulation of membrane potential around the threshold, even by a small amount of CP inhibition, could play a sensitive and pivotal role in controlling GABA release. Third, the GABAergic inhibition between SACs was prolonged, lasting for hundreds of milliseconds after the termination of the voltage pulse (Figure 1). This property may enable the inhibitory input from surround SACs to outlast the subsequent excitatory input from bipolar cells during CP motion.
Synaptic Inputs to SACs during CP and CF Motions
Different from previous patch-clamp studies of SAC light response properties (Taylor and Wassle, 1995; Peters and Masland, 1996), our experiments directly isolated a GABAergic inhibitory input to SACs during CP motion. Several lines of evidence strongly suggest that the majority of this inhibitory input was mediated by the GABAA synapses between SACs. First, the receptive field size of this inhibitory input during both CP motion and stationary illumination matched closely the spatial extent of the GABAergic interaction between overlapping SACs recorded under dual patch-clamp (~300 μm in radius). Second, the inhibitory currents during CP motion were mediated mainly by GABAA receptors, consistent with the pharmacology of the synapses between SACs. Third, all available anatomical evidence indicates that SACs cofasciculate far more extensively among themselves than with any other amacrine cell types (Tauchi and Masland, 1984; Vaney, 1984; Famiglietti, 1985). Since we now know that neighboring SACs make extensive functional GABAA synapses onto each other (Figure 1), it would make sense that during CP motion the majority of the GABAergic input to a SAC came from other SACs. Our results also indicated that other amacrine cells, including some glycinergic amacrine cells, might mediate a delayed portion of light-evoked synaptic inputs to SACs during CP motion.
We found that the inhibitory input to a SAC during CP stimulation preceded the excitatory input across a wide range of movement speeds (0.3–30 degrees/s). This range includes the speeds for eliciting optimum responses from both On (~0.6 degrees/s) and On-off (≥3 degree/s) DSGCs, and it covers the speed range (1–10 degrees/s) in which On-off DSGCs are typically studied (Oyster, 1968). However, because the CP inhibitory input to a SAC needs to go through one more synapse (from SAC to SAC) than does the excitatory input (directly from bipolar cell to SAC), it is expected to take an additional ~25 ms for synaptic transmission, as estimated from the temporal delay between the excitatory and inhibitory responses to stationary flashes (Figure 2). Thus, theoretically, the CP inhibition from the surround SACs would fail to lead the center excitation for CP movements that take less than 25 ms to move across the spatial extent of the effective inhibitory surround (100–150 μm, Figure 3C), or in other words, at speeds above 4–6 mm/s (40–60 degrees/s). A similar speed limit would also apply to the leading inhibition from SACs to On-off DSGCs during null movement (Fried et al., 2002). This theoretical speed limit is close to the highest speed ever tested for On-off DSGCs in rabbit (~60 degrees/s) (Oyster et al., 1972). Because of the technical limitation of our light stimulation system, we could not determine reliably the stimulus timing at speeds higher than those tested in this study. It remains to be determined at what movement speeds SACs and On-off DSGCs fail to give direction-selective responses, and whether additional mechanisms are required to generate direction selectivity at high speeds.
Our recordings did not find a leading inhibitory input to SACs during CF motion. When the annulus moved centrifugally toward the distal zone of a SAC dendrite, the dendrite was directly excited by bipolar cell input. One may speculate that, based on the previous finding that neighboring SACs are separated by a mean nearest-neighbor distance of 45 μm (Masland et al., 1984), parallel dendrites from two neighboring SACs (e.g., the dendrites of SAC0 and SAC3 that point toward the right in Figure 7C) are offset, on average, by at least 45 μm and, therefore, are not expected to form significant inhibitory synapses between their distal zones which are ~50 μm in length. The distal zone of a SAC dendrite (e.g., the right dendrite of SAC0 in Figure 7C) can presumably receive synaptic inputs from neighboring SAC dendrites that are slightly off the parallel direction (e.g., dendrites of SAC4 in Figure 7C), but synapses with these processes are not expected to produce a significant leading inhibition at the distal zone of SAC0 because the dendrites of both SAC0 and SAC4 (the region highlighted in yellow in Figure 7C) would be excited simultaneously by the direct input from bipolar cells during CF movement (Figure 7C). Thus, direct leading inhibition at the SAC distal zone during CF motion is not expected to be significant (or at least, it would be much weaker than the inhibition during CP motion), though we cannot rule out the possibility that some leading inhibition might come from wide-field amacrine cells.
Notably, the exact nature of the inhibitory inputs to a SAC during CF motion is currently unclear. In particular, we do not know whether/how the dendrites of neighboring SACs (e.g., SAC0, SAC3, and SAC4 in Figure 7C) that point in the same direction synapse on each other. It is also difficult to determine the local inhibitory input to SAC distal dendrites during CF motion based on patch-clamp recordings from the soma. We found SR95531 had a much smaller blocking effect on the inhibitory current component during CF motion than during CP motion (Figure 4A). This result may be explained, in part, by the reciprocal inhibitory synapses between opposing SACs (Figure 7B). It may also be caused by asymmetric synaptic wiring between parallel and anti-parallel SAC dendrites. However, it should be emphasized that, regardless of the details of the inhibitory input, the dominating input to the distal zone during CF motion was excitatory (Figure 7A), which produced a robust distal Ca2+ response as demonstrated in Figure 6B. In contrast, the dominating input to the distal zone during CP motion was the leading inhibition from the surround (Figure 7A). As shown by our Ca2+ imaging during apparent-motion stimulation (Figure 6C), either CF excitation or CP inhibition was able to produce a certain degree of directional asymmetry at the distal zone; however, the integration of the two produces a synergistic and far more robust direction-selective mechanism (see below).
In addition to the direct feedforward inhibition from the surround SACs, we also found a long-range surround inhibition during CP motion, similar to that reported for stationary light stimulation (Taylor and Wassle, 1995; Peters and Masland, 1996). The long-range hyperpolarization from the resting membrane potential and the subsequent depolarization we observed during CP motion (Figure 5B) seemed similar to those reported by Gavrikov et al. (2003). However, our data suggest that this long-range hyperpolarization was due, mainly, to the surround inhibition of the background glutamate input, and that the subsequent depolarizing phase was due to the stimulation of the SAC receptive field center during CP motion.
Light-Evoked Ca2+ Responses at SAC Distal Processes
Our results demonstrated that Ca2+ responses to patterned light stimulation could be measured reliably from SAC processes in the whole-mount retina with conventional Ca2+ imaging. Simultaneous patch-clamp and Ca2+ imaging allowed us to monitor the membrane potential of cells during imaging. Our experimental approach was particularly useful for two-spot apparent-motion stimulation, which allowed the separation of the effects of CF excitation and CP inhibition on distal Ca2+ responses. The identification of the leading CP inhibitory contribution to direction selectivity is crucial. Without this mechanism, it has been difficult to explain the finding that a stationary light spot could elicit a strong Ca2+ response in the distal zone, but that the same light spot was unable to do so when it moved into the same distal zone from the surround (Figure 6B, also see Euler et al., 2002). We found that the CP inhibition of distal Ca2+ responses was mediated by a mixture of GABAA, GABAC, and glycine receptors (Figure 6G). Consistent with a prominent role of the SAC-SAC interaction in the surround inhibition during CP movement, SR95531 blocked a majority (~60%) of the surround inhibition (Figure 6G). However, CP inhibition also included GABAC- and glycine receptor-mediated contribution, possibly involving feedback on bipolar cells (Figure 6G). Moreover, because of the interactions among the GABAA, GABAC, and glycine systems, the net effect of SR95531 on the SAC response during CP motion was complicated and sometimes variable. For example, it is possible that blocking GABAA receptors on amacrine cells may disinhibit amacrine cells and enhance the feedback inhibition on bipolar cells (Vigh et al., 2005; Eggers and Lukasiewicz, 2006), an effect that may also vary in magnitude depending on the degree to which GABAA, in addition to GABAC, receptors on bipolar cells contribute to the feedback inhibition. The surround inhibition of the glutamate input to SACs during CP motion, together with the potential enhancement of this inhibition by SR95531, might explain, in part, why directional asymmetry in the Ca2+ response in SAC distal processes could still be observed in the presence of SR95531 (Euler et al., 2002). Another possible explanation is that CF excitation alone could already produce a certain degree of directional asymmetry as indicated by our CF apparent-motion experiment (Figures 6B and 6C). Thus, under certain experimental conditions, a SAC might be too weak to respond to a stationary stimulus at distal dendrites, but it might still respond to CF motion because of centrifugal facilitation. Under these conditions, there would not be much of a response to be inhibited during the CP motion; hence, the contribution of the GABAA-mediated surround inhibition could not be detected.
We found that the CF conditioning flash enhanced the response of distal dendrites to the Test flash (Figure 6). The mechanism of this CF enhancement is currently unclear, but it may involve both intrinsic mechanisms, such as those that rely on voltage-gated ion channels and ion transporters on SAC dendrites (Gavrikov et al., 2003; Ozaita et al., 2004; Tukker et al., 2004; see also S. Hausselt et al., 2004, Society for Neuroscience, abstract), and synaptic mechanisms (Muench and Werblin, 2006), such as the positive feedback interaction between opposing SACs described above. In a preliminary experiment, we also found that the percent increase in the distal Ca2+ response to the Test flash during CF apparent motion was reduced by SR95531 or SR95531 together with TPMPA and strychnine (n = 5 cells), suggesting the possibility of a synaptic (particularly GABAA-mediated) contribution to the CF enhancement. However, the nature of GABAergic interaction during CF motion requires future investigation. It should also be emphasized that our finding of the synaptic mechanism for the DS light responses in SACs does not contradict or exclude potentially additional mechanisms based on intrinsic properties of SACs. Instead, intrinsic mechanisms that contribute to CF facilitation are expected to work synergistically with the synaptic mechanism to produce more robust direction selectivity.
In conclusion, our results suggest that network interactions play a critical role in the formation of direction selectivity at the signal processing units on SAC distal processes. These interactions are integrated by a center-surround synaptic circuitry, which employs at least three levels of asymmetry (center excitation, surround inhibition, and reciprocal interactions that amplify the center-surround antagonism) to produce a robust direction-selective mechanism.
Experimental Procedures
Retinal Preparation and Electrophysiology
Retinas from eyes of New Zealand white rabbits aged P17–P29, which were killed by an overdose of sodium pentobarbital (200 mg/kg, i.v.), were dissected under dim illumination (Zhou and Fain, 1995). The axial length of the eyes was ~11 mm at P21. Based on the axial length (18 mm) and the posterior nodal distance (PND, 9.9 mm) of adult New Zealand white rabbit eyes (Hughes, 1972), the PND of P21 rabbit eyes should be ~6 mm, assuming that rabbit eyes grow approximately proportionally in all dimensions between P21 and adult. Thus, a 1 degree visual angle should correspond to a lateral distance of ~100 μm on a P21 rabbit retina.
Flat-mount pieces of the retina, obtained from the ventral retina within 5 mm of the visual streak, were prepared for whole-cell patch-clamp recording as described (Zhou, 1998; Zheng et al., 2004, 2006). In brief, a piece of retina was held down to the bottom of a recording chamber by a nylon mesh glued on a platinum ring and continuously superfused (2–4 ml/min) with Ames medium (Sigma; pH 7.4, equilibrated with 95% CO2 and 5% O2) at 34°C–36°C. Single and double patch-clamp recordings were made from displaced SACs using a dual patch-clamp amplifier (Multiclamp 700A, Molecular Devices, Union City, CA) after the overlaying extra-cellular matrices and Müller cell end feet were removed mechanically by a patch pipette. Three different pipette solutions were used for recordings. A Cs+-based solution, which contained (in mM) 110 CsMeSO4, 15 CsOH, 5 NaCl, 0.5 CaCl2, 2 MgCl2, 5 EGTA, 2 adenosine 5′-triphosphate (disodium salt), 0.5 guanosine 5′-triphosphate (trisodium salt), 10 HEPES, and 2 ascorbate (pH 7.2), was used for all voltage-clamp recordings and the current-clamp recording shown in Figure 5D. A K+-based solution, which contained (in mM) 105 Kgluconate, 5 KCl, 5 NaOH 0.5, 15 KOH, CaCl2, 2 MgCl2, 5 EGTA, 2 adenosine 5′-triphosphate (disodium salt), 0.5 guanosine 5′-triphosphate (trisodium salt), 10 HEPES, and 2 ascorbate (pH 7.2), was used for the current-clamp recordings shown in Figures 5B and 5C. An OGB-containing solution, which was made of (in mM) 104 Kgluconate, 6 KCl, 15 KOH, 5NaOH, 2 MgCl2, 2 adenosine 5′-triphosphate (disodium salt), 0.5 guanosine 5′-triphosphate (trisodium salt), 10 HEPES, 2 ascorbate, and 0.2 Oregon Green 488 BAPTA-1 (pH 7.2), was used for simultaneous patch-clamp and Ca2+ imaging. Lucifer yellow (0.1%–0.3%, w/v) was always included in the pipette solution (except in the the OGB-containing solution) to facilitate morphological identification of SACs at the end of the recording. Liquid junction potential (10.1 mV between Ames medium and the Cs+-based solution, and 8.3 mV between Ames medium and the K+-based solution) was calculated using pClamp software (Molecular Devices) and corrected from the measured membrane potentials.
Light Stimulation and Ca2+ Imaging
Light stimuli were presented on a miniature black-and-white LCD (SVGA4LCD, CRL OPTO, Dalgety Bay, Scotland), which was placed under the condenser lens of an upright microscope (Olympus BX50, Olympus, New York) and trans-illuminated by the microscope light (100W halogen lamp). Light stimulus patterns were generated by the software PatGen (written by Gary Zhou) and projected to the photoreceptor layer of the retina via the condenser lens. Patch-clamp recordings were made under the illumination of a white background shown on the LCD. Immediately after the formation of a whole-cell patch-clamp configuration, a dark background was displayed on the LCD, and the retina was dark-adapted for 2–3 min before light stimuli (white patterns on a dark background) were used to elicit light responses from the cells under patch-clamp. The images on the LCD display had a contrast level of 100:1 and a refresh rate of 60 Hz. The position of a stimulus during motion was determined by the starting position, the time elapsed since the start of the motion, and the motion speed. The onset of a light response (either current or voltage) was determined by fitting the initial segment of the response with a straight line and finding the intersection between this straight line and the baseline.
Ca2+ imaging of light responses from SAC distal processes was made simultaneously with whole-cell current-clamp using the OGB-containing pipette solution. The dye (OGB) diffused into the distal processes within 5–8 min of the establishment of a whole-cell configuration. A light spot (a 60 μm × 100 μm rectangular image formed by a field diaphragm) was projected onto the retina from the epifluorescence lamp (100 W mercury lamp, filtered by 450–480 nm band-pass and neutral density filters) via a 60 × water immersion objective lens (NA/0.9). This light was used both to excite OGB in SAC processes and to elicit light responses from the retina (Test flash in Figure 6A). Images of a central rectangular region of the 60 × 60 μm spot were acquired at a rate of 40 frames/s using a cooled frame-transfer CCD camera (Cascade, Roper Scientific Instruments, Tucson, AZ) operating in the “stream mode” (continuous acquisition without online display) under the control of MetaFluo (Molecular Device, Downingtown, PA). The timing of the Test flash (880 ms in duration) was controlled by a Uniblitz shutter (Vincent Associates, Rochester, NY).
To generate apparent motion, two light flashes (conditioning and test) were delivered to the retina in quick succession. The Test flash was delivered from the epifluorescence lamp as described above. The conditioning flash (100 ms in duration, turned on 210 ms before the Test flash) was generated on the LCD and projected to an area immediately next to the region stimulated by the Test flash on either the surround or the center side to simulate CP or CF motion, respectively (see Figure 6). The Ca2+ indicator (OGB) was excited only during a Test flash, and dye bleaching during the brief flash was negligible. Light responses to the Test flash recovered fully within 45 s. The cells typically remained light-responsive for 15 to 45 min under this condition. Prolonged (>1 hr) recording and imaging were avoided because they often resulted in deterioration of cell health, as indicated by an increase in baseline OGB fluorescence (presumably due to increased resting Ca2+) and poor light responses.
Acknowledgments
We thank Jijian Zheng for helpful scientific discussions and Gary Zhou for making the light stimulus software (PatGen). This work was supported by NIH grants EY017353 and EY10894 (to Z.J.Z.), unrestricted funds from Research to Prevent Blindness, Inc., and the University of Arkansas for Medical Sciences Tobacco Fund.
References
- Amthor FR, Keyser KT, Dmitrieva NA. Effects of the destruction of starburst-cholinergic amacrine cells by the toxin AF64A on rabbit retinal directional selectivity. Vis Neurosci. 2002;19:495–509. doi: 10.1017/s0952523802194119. [DOI] [PubMed] [Google Scholar]
- Barlow HB, Hill RM. Selective sensitivity to direction of movement in ganglion cells of the rabbit retina. Science. 1963;139:412–414. doi: 10.1126/science.139.3553.412. [DOI] [PubMed] [Google Scholar]
- Barlow HB, Levick WR. The mechanism of directionally selective units in rabbit’s retina. J Physiol. 1965;178:477–504. doi: 10.1113/jphysiol.1965.sp007638. [DOI] [PMC free article] [PubMed] [Google Scholar]
- Barlow HB, Hill RM, Levick WR. Retinal ganglion cells responding selectively to direction and speed of image motion in the rabbit. J Physiol. 1964;173:377–407. doi: 10.1113/jphysiol.1964.sp007463. [DOI] [PMC free article] [PubMed] [Google Scholar]
- Borg-Graham LJ. The computation of directional selectivity in the retina occurs presynaptic to the ganglion cell. Nat Neurosci. 2001;4:176–183. doi: 10.1038/84007. [DOI] [PubMed] [Google Scholar]
- Borg-Graham L, Grzywacz NM. A model of the directional selectivity circuit in retina: transformations by neurons singly and in concert. In: McKenna T, Davis JL, Zoenetzer SF, editors. Single Neuron Computation. London: Academic Press; 1992. pp. 347–375. [Google Scholar]
- Dodge FA, Jr, Rahamimoff R. Co-operative action a calcium ions in transmitter release at the neuromuscular junction. J Physiol. 1967;193:419–432. doi: 10.1113/jphysiol.1967.sp008367. [DOI] [PMC free article] [PubMed] [Google Scholar]
- Eggers ED, Lukasiewicz PD. GABA(A), GABA(C) and glycine receptor-mediated inhibition differentially affects light-evoked signaling from mouse retinal rod bipolar cells. J Physiol. 2006;572:215–225. doi: 10.1113/jphysiol.2005.103648. Published online January 26, 2006. [DOI] [PMC free article] [PubMed] [Google Scholar]
- Euler T, Detwiler PB, Denk W. Directionally selective calcium signals in dendrites of starburst amacrine cells. Nature. 2002;418:845–852. doi: 10.1038/nature00931. [DOI] [PubMed] [Google Scholar]
- Famiglietti EV. Starburst amacrine cells: morphological constancy and systematic variation in the anisotropic field of rabbit retinal neurons. J Neurosci. 1985;5:562–577. doi: 10.1523/JNEUROSCI.05-02-00562.1985. [DOI] [PMC free article] [PubMed] [Google Scholar]
- Famiglietti EV. Synaptic organization of starburst amacrine cells in rabbit retina: analysis of serial thin sections by electron microscopy and graphic reconstruction. J Comp Neurol. 1991;309:40–70. doi: 10.1002/cne.903090105. [DOI] [PubMed] [Google Scholar]
- Famiglietti EV., Jr ‘Starburst’ amacrine cells and cholinergic neurons: mirror-symmetric on and off amacrine cells of rabbit retina. Brain Res. 1983;261:138–144. doi: 10.1016/0006-8993(83)91293-3. [DOI] [PubMed] [Google Scholar]
- Fried SI, Munch TA, Werblin FS. Mechanisms and circuitry underlying directional selectivity in the retina. Nature. 2002;420:411–414. doi: 10.1038/nature01179. [DOI] [PubMed] [Google Scholar]
- Fried SI, Munch TA, Werblin FS. Directional selectivity is formed at multiple levels by laterally offset inhibition in the rabbit retina. Neuron. 2005;46:117–127. doi: 10.1016/j.neuron.2005.02.007. [DOI] [PubMed] [Google Scholar]
- Gavrikov KE, Dmitriev AV, Keyser KT, Mangel SC. Cation–chloride cotransporters mediate neural computation in the retina. Proc Natl Acad Sci USA. 2003;100:16047–16052. doi: 10.1073/pnas.2637041100. [DOI] [PMC free article] [PubMed] [Google Scholar]
- Hughes A. A schematic eye for the rabbit. Vision Res. 1972;12:123–138. doi: 10.1016/0042-6989(72)90143-5. [DOI] [PubMed] [Google Scholar]
- Masland RH, Mills JW, Hayden SA. Acetylcholine-synthesizing amacrine cells: identification and selective staining by using radioautography and fluorescent markers. Proc R Soc Lond B Biol Sci. 1984;223:79–100. doi: 10.1098/rspb.1984.0084. [DOI] [PubMed] [Google Scholar]
- Muench TA, Werblin FS. Symmetric interactions within a homogeneous starburst cell network can lead to robust asymmetries in dendrites of starburst amacrine cells. J Neurophysiol. 2006;91:471–477. doi: 10.1152/jn.00628.2005. Published online April 5, 2006. [DOI] [PubMed] [Google Scholar]
- Oesch N, Euler T, Taylor WR. Direction-selective dendritic action potentials in rabbit retina. Neuron. 2005;47:739–750. doi: 10.1016/j.neuron.2005.06.036. [DOI] [PubMed] [Google Scholar]
- Oyster CW. The analysis of image motion by the rabbit retina. J Physiol. 1968;199:613–635. doi: 10.1113/jphysiol.1968.sp008671. [DOI] [PMC free article] [PubMed] [Google Scholar]
- Oyster CW, Takahashi E, Collewijn H. Direction-selective retinal ganglion cells and control of optokinetic nystagmus in the rabbit. Vision Res. 1972;12:183–193. doi: 10.1016/0042-6989(72)90110-1. [DOI] [PubMed] [Google Scholar]
- Ozaita A, Petit-Jacques J, Volgyi B, Ho CS, Joho RH, Bloom-field SA, Rudy B. A unique role for Kv3 voltage-gated potassium channels in starburst amacrine cell signaling in mouse retina. J Neurosci. 2004;24:7335–7343. doi: 10.1523/JNEUROSCI.1275-04.2004. [DOI] [PMC free article] [PubMed] [Google Scholar]
- Peters BN, Masland RH. Responses to light of star-burst amacrine cells. J Neurophysiol. 1996;75:469–480. doi: 10.1152/jn.1996.75.1.469. [DOI] [PubMed] [Google Scholar]
- Sakaba T, Neher E. Quantitative relationship between transmitter release and calcium current at the calyx of held synapse. J Neurosci. 2001;21:462–476. doi: 10.1523/JNEUROSCI.21-02-00462.2001. [DOI] [PMC free article] [PubMed] [Google Scholar]
- Shields CR, Tran MN, Wong RO, Lukasiewicz PD. Distinct ionotropic GABA receptors mediate presynaptic and post-synaptic inhibition in retinal bipolar cells. J Neurosci. 2000;20:2673–2682. doi: 10.1523/JNEUROSCI.20-07-02673.2000. [DOI] [PMC free article] [PubMed] [Google Scholar]
- Tauchi M, Masland RH. The shape and arrangement of the cholinergic neurons in the rabbit retina. Proc R Soc Lond B Biol Sci. 1984;223:101–119. doi: 10.1098/rspb.1984.0085. [DOI] [PubMed] [Google Scholar]
- Tauchi M, Masland RH. Local order among the dendrites of an amacrine cell population. J Neurosci. 1985;5:2494–2501. doi: 10.1523/JNEUROSCI.05-09-02494.1985. [DOI] [PMC free article] [PubMed] [Google Scholar]
- Taylor WR, Vaney DI. Diverse synaptic mechanisms generate direction selectivity in the rabbit retina. J Neurosci. 2002;22:7712–7720. doi: 10.1523/JNEUROSCI.22-17-07712.2002. [DOI] [PMC free article] [PubMed] [Google Scholar]
- Taylor WR, Vaney DI. New directions in retinal research. Trends Neurosci. 2003;26:379–385. doi: 10.1016/S0166-2236(03)00167-X. [DOI] [PubMed] [Google Scholar]
- Taylor WR, Wassle H. Receptive field properties of starburst cholinergic amacrine cells in the rabbit retina. Eur J Neurosci. 1995;7:2308–2321. doi: 10.1111/j.1460-9568.1995.tb00652.x. [DOI] [PubMed] [Google Scholar]
- Tukker JJ, Taylor WR, Smith RG. Direction selectivity in a model of the starburst amacrine cell. Vis Neurosci. 2004;21:611–625. doi: 10.1017/S0952523804214109. [DOI] [PubMed] [Google Scholar]
- Vaney DI. ‘Coronate’ amacrine cells in the rabbit retina have the ‘starburst’ dendritic morphology. Proc R Soc Lond B Biol Sci. 1984;220:501–508. doi: 10.1098/rspb.1984.0016. [DOI] [PubMed] [Google Scholar]
- Vigh J, Li GL, Hull C, von Gersdorff H. Long-term plasticity mediated by mGluR1 at a retinal reciprocal synapse. Neuron. 2005;46:469–482. doi: 10.1016/j.neuron.2005.03.027. [DOI] [PMC free article] [PubMed] [Google Scholar]
- Yoshida K, Watanabe D, Ishikane H, Tachibana M, Pastan I, Nakanishi S. A key role of starburst amacrine cells in originating retinal directional selectivity and optokinetic eye movement. Neuron. 2001;30:771–780. doi: 10.1016/s0896-6273(01)00316-6. [DOI] [PubMed] [Google Scholar]
- Zheng J, Lee S, Zhou ZJ. A transient network of intrinsically bursting starburst cells underlies the generation of retinal waves. Nat Neurosci. 2006;9:363–371. doi: 10.1038/nn1644. [DOI] [PubMed] [Google Scholar]
- Zheng JJ, Lee S, Zhou ZJ. A developmental switch in the excitability and function of the starburst network in the Mammalian retina. Neuron. 2004;44:851–864. doi: 10.1016/j.neuron.2004.11.015. [DOI] [PubMed] [Google Scholar]
- Zhou ZJ. Direct participation of starburst amacrine cells in spontaneous rhythmic activities in the developing mammalian retina. J Neurosci. 1998;18:4155–4165. doi: 10.1523/JNEUROSCI.18-11-04155.1998. [DOI] [PMC free article] [PubMed] [Google Scholar]
- Zhou ZJ, Fain GL. Neurotransmitter receptors of starburst amacrine cells in rabbit retinal slices. J Neurosci. 1995;15:5334–5345. doi: 10.1523/JNEUROSCI.15-07-05334.1995. [DOI] [PMC free article] [PubMed] [Google Scholar]