

Abstract
Epileptic seizures are characterized by periods of hypersynchronous, hyperexcitability within brain networks. Most seizures involve two stages: an initial tonic phase, followed by a longer clonic phase that is characterized by rhythmic bouts of synchronized network activity called afterdischarges (ADs). Here we investigate the cellular and network mechanisms underlying hippocampal ADs in an effort to understand how they maintain seizure activity. Using in vitro hippocampal slice models from rats and mice, we performed electrophysiological recordings from CA3 pyramidal neurons to monitor network activity and changes in GABAergic signaling during epileptiform activity. First, we show that the highest synchrony occurs during clonic ADs, consistent with the idea that specific circuit dynamics underlie this phase of the epileptiform activity. We then show that ADs require intact GABAergic synaptic transmission, which becomes excitatory as a result of a transient collapse in the chloride (Cl−) reversal potential. The depolarizing effects of GABA are strongest at the soma of pyramidal neurons, which implicates somatic-targeting interneurons in AD activity. To test this, we used optogenetic techniques to selectively control the activity of somatic-targeting parvalbumin-expressing (PV+) interneurons. Channelrhodopsin-2-mediated activation of PV+ interneurons during the clonic phase generated excitatory GABAergic responses in pyramidal neurons, which were sufficient to elicit and entrain synchronous AD activity across the network. Finally, archaerhodopsin-mediated selective silencing of PV+ interneurons reduced the occurrence of ADs during the clonic phase. Therefore, we propose that activity-dependent Cl− accumulation subverts the actions of PV+ interneurons to perpetuate rather than terminate pathological network hyperexcitability during the clonic phase of seizures.
Keywords: chloride, epilepsy, GABAA, hippocampus, optogenetics, parvalbumin
Introduction
Epilepsy is a debilitating condition characterized by recurrent seizures that reflect periods of enhanced excitability and synchronization within brain networks. Most seizures involve two stages: an initial tonic phase, followed by a longer period of rhythmic afterdischarges (ADs) known as the clonic phase (McCormick and Contreras, 2001). Previous studies have focused primarily on the initiation of the tonic phase and how a network may generate, or succumb to, an ictal event (Trevelyan et al., 2006, 2007a,b; Ziburkus et al., 2006; Zhang et al., 2012; Cammarota et al., 2013). In comparison, less is known about the cellular and network mechanisms that maintain the continuing dynamics of the clonic phase. This phase manifests as ADs during which the network exhibits almost perfectly synchronous activity, typically in the form of depolarizing bursts (Trevelyan et al., 2007a; Isomura et al., 2008; Ilie et al., 2012). Experiments in humans and animal models support the idea that synchronous network activity increases during a seizure, becoming highest during the clonic phase (Schindler et al., 2007; Trevelyan et al., 2007a; Kramer et al., 2012; Schevon et al., 2012; Jiruska et al., 2013). These changes suggest that specific circuit dynamics underlie clonic ADs, but the mechanisms underlying the increased synchrony are not understood.
GABAAR activation via different GABAergic interneuron subtypes plays a crucial role in synchronizing network activity (Somogyi and Klausberger, 2005). However, in the context of seizure activity, the effects of GABAAR activation may be quite different. Intense GABAAR activity can result in large chloride (Cl−) influxes (Isomura et al., 2003; Fujiwara-Tsukamoto et al., 2006, 2007), which can result in a collapse in the transmembrane Cl− gradient and depolarizing shift in the reversal potential of the GABAAR (EGABAA; Thompson and Gahwiler, 1989; Staley et al., 1995; Kaila et al., 1997). This depolarizing shift has been suggested to contribute to synchronized activity patterns observed in epileptiform activity (Michelson and Wong, 1991; Fujiwara-Tsukamoto et al., 2010). Indeed, GABAAR activation can be sufficient to induce ADs (Fujiwara-Tsukamoto et al., 2003), and the activity of subpopulations of interneurons, specifically fast-spiking interneurons, correlates tightly with ADs (Fujiwara-Tsukamoto et al., 2006, 2010). However, it is unknown whether somatic and dendritic compartments exhibit similar depolarizing GABA effects during ADs and how this might influence the contribution of interneurons that target specific subcellular domains.
Using in vitro models of hippocampal epileptiform activity, we demonstrate that GABAergic transmission becomes depolarizing and excitatory during the clonic phase. The transient depolarizing shift in GABAergic signaling is most pronounced at the soma of hippocampal pyramidal neurons, which means that somatic-targeting interneurons are well placed to synchronize excitatory effects across the network. Indeed, selective optogenetic activation of somatic-targeting parvalbumin-expressing (PV+) interneurons is sufficient to trigger and entrain ADs. In contrast, optogenetically silencing PV+ interneurons during the clonic phase reduces the incidence of ADs. Our results suggest that, once a seizure is established, GABA released perisomatically by PV+ interneurons can perpetuate the seizure through the direct generation of clonic ADs.
Materials and Methods
Animals.
Experiments were performed on Wistar rats and PV–Cre mice, which were bred and housed in accordance with the United Kingdom Animals (Scientific Procedures) Act (1986) and the Society for Neuroscience policy on the use of animals in neuroscience research. PV–Cre mice express Cre recombinase in all PV+ neurons and were obtained from The Jackson Laboratory (http://jaxmice.jax.org/strain/008069.html) and maintained as a homozygous breeding line.
Viral delivery.
Adeno-associated virus serotype 2 (AAV2) carrying fusion genes for channelrhodopsin-2 (ChR2) or archaerhodopsin (Arch) were injected into the ventral hippocampus of PV–Cre mice between postnatal days 14 and 21. Typical coordinates from bregma were 2.55 mm lateral, 2.65 mm posterior, and 3.25 mm depth from the surface of the brain. During the injection, the needle was retracted to a depth of 2.25 mm from the surface of the brain to maximize the spread of virus throughout the hippocampus. Viral DNA included the double-floxed sequence for ChR2(H134R)–EYFP driven by the elongation factor 1 promoter or the double-floxed sequence for Arch–GFP driven by the CAG promoter. AAV2 particles were produced at the University of North Carolina Gene Therapy Center Vector Core and at the University of Pennsylvania Penn Vector Core. Typical titers were ∼1012 IU/ml, and injection volumes were 300–600 nl. After allowing 4–8 weeks for ChR2 or Arch expression, acute hippocampal slices were prepared.
Slice preparation.
Acute mouse hippocampal slices were prepared from 2- to 4-month-old virus-injected PV–Cre mice. Animals were anesthetized with isoflurane or an intraperitoneal injection of pentobarbital and then decapitated. Transverse 400 μm slices were cut using a vibrating microtome (Microm HM650V). Slices were prepared in artificial CSF (aCSF) containing the following (in mm): 65 sucrose, 85 NaCl, 2.5 KCl, 1.25 NaH2PO4, 7 MgCl2, 0.5 CaCl2, 25 NaHCO3, and 10 glucose, pH 7.2–7.4 [bubbled with carbogen gas (95% O2/5% CO2)]. Slices were immediately transferred to a storage chamber containing aCSF (in mm): 130 NaCl, 3.5 KCl, 1.2 NaH2PO4, 0.5 MgCl2, 3 CaCl2, 24 NaHCO3, and 10 glucose, pH 7.2–7.4, at 32°C (bubbled with carbogen gas until used for recording). Organotypic rat hippocampal slice cultures were prepared using a method similar to that described by Stoppini et al. (1991). Briefly, 7-d-old male Wistar rats were killed, and the brains were extracted and placed in cold (4°C) Gey's balanced salt solution, supplemented with d-glucose (34.7 mm). The hemispheres were separated, and individual hippocampi were removed and immediately sectioned into 350-μm-thick slices on a McIlwain tissue chopper. Slices were rinsed in cold dissection media, placed onto Millicell-CM membranes, and maintained in culture media containing 25% EBSS, 50% MEM, 25% heat-inactivated horse serum, glucose, and B27 (Invitrogen). All drugs were obtained from Tocris Biosciences and Sigma-Aldrich.
Recording conditions.
Hippocampal slices were transferred to a recording chamber and continuously superfused with aCSF bubbled with carbogen gas with the same composition as the storage solution (32–35°C and perfusion speed of 2 ml/min). Neurons within the CA3 pyramidal cell layer of the hippocampus were visualized under 20× or 60× water-immersion objectives (Olympus) and targeted for recording. Visualization of cells was facilitated with infrared differential interference contrast or dot contrast microscopy. For the optogenetic experiments, we used epifluorescence microscopy to select slices that exhibited strong expression throughout the CA3 region. Arch–GFP experiments were only conducted in slices that exhibited widespread somatic expression in PV+ interneurons throughout the CA3 region. Whole-cell current-clamp and voltage-clamp recordings from hippocampal CA3 pyramidal neurons were performed using glass pipettes, pulled from standard wall borosilicate glass capillaries and containing the following: 110 mm potassium gluconate, 40 mm HEPES, 2 mm ATP-Mg, 0.3 mm Na-GTP, 4 mm NaCl, and 4 mg/ml biocytin, pH 7.2–7.3, 290–300 mOsm/l osmolarity. Recordings were made using Multiclamp 700A, Multiclamp 700B, and Axoclamp 2B amplifiers and acquired using pClamp9 (Molecular Devices) or WinWCP (University of Strathclyde, Glasgow, UK) software. Gramicidin perforated-patch recordings (Kyrozis and Reichling, 1995) were performed using glass pipettes containing the following: 135 mm KCl, 4 mm Na2ATP, 0.3 mm Na3GTP, 2 mm MgCl2, 10 mm HEPES, and 80 μg/ml gramicidin (Calbiochem), pH 7.38, 290 mOsm/l osmolarity. After obtaining a cell-attached patch, the gramicidin perforation process was evaluated by continuously monitoring the decrease in access resistance. Recordings were started once the access resistance had stabilized between 20 and 50 MΩ (mean Ra ∼35 MΩ), which usually occurred 20–40 min after gigaseal formation. A series resistance correction of 70% was used.
Stimulation and recording protocols.
Hippocampal organotypic slices have been established as a posttraumatic model of epileptogenesis (Dyhrfjeld-Johnsen et al., 2010; Berdichevsky et al., 2012). Epileptiform activity was induced in the organotypic hippocampal slices using four different models: (1) 0 Mg2+ model; (2) 0 Cl− model; (3) 4-aminopyridine (4-AP) model; and (4) spontaneous model. In the 0 Mg2+ model, epileptiform activity was induced by switching the perfusate to nominally Mg2+-free aCSF (in mm): 120 NaCl, 3 KCl, 1.2 NaH2PO4, 2 CaCl2, 23 NaHCO3, and 11 glucose, pH 7.35–7.40. In the 0 Cl− model, epileptiform activity was induced by switching the perfusate to nominally Cl−-free aCSF (in which NaCl, MgCl2, and CaCl2 of standard aCSF were replaced with 120 mm sodium d-gluconate, 1 mm MgSO4, and 3 mm calcium d-gluconate, respectively). In the 4-AP model, epileptiform activity was elicited by adding 50 μm 4-AP to the standard aCSF (Perreault and Avoli, 1992). The spontaneous model involved using hippocampal organotypic slice cultures that had been maintained for >2 weeks in culture and that are known to generate spontaneous epileptiform activity in standard aCSF (Dyhrfjeld-Johnsen et al., 2010; Berdichevsky et al., 2012; Lillis et al., 2012). In a subset of experiments, picrotoxin (100 μm) or gabazine (SR95531 [6-Imino-3-(4-methoxyphenyl)-1(6H)-pyridazinebutanoic acid hydrobromide], 20 μm) was added to block GABAARs. To study epileptiform activity in acute slices, aCSF containing 0 mm MgCl2 and 5 mm KCl was superfused at a speed of 6 ml/min (to facilitate sufficient delivery of oxygen and increase excitability; Hájos et al., 2009), and epileptiform activity was initiated by delivering a train of electrical stimuli via a stimulating electrode positioned in CA3 stratum pyramidale (20 pulses at 100 Hz; Etherington and Frenguelli, 2004).
GABAARs were activated using a Picospritzer (General Valve; 20 psi for 20 ms) to deliver focal “puffs” of GABA (100 μm) via a patch pipette placed close to either the soma or the dendrites (∼150 μm from the soma). To prevent activation of GABABRs, the experiments were conducted in the presence of CGP55845 [(2S)-3-[(15)-1-(3,4-dichlorophenyl)ethyl]amino-2-hydroxypropyl)(phenylmethyl)phosphinic acid] (5 μm). Photoactivation of ChR2 (Zhang et al., 2006) was achieved using 1-ms-duration light pulses via a diode-pumped solid-state laser (473 nm peak wavelength; Shanghai Laser & Optics Century). The laser was coupled to a 200- or 1000-μm-diameter mulitimode optic fiber via a collimating lens (Thorlabs). The tip of the optic fiber was positioned at an image plane in the microscope in the center of the optical axis and directed into a 20×/1.0 numerical aperture objective lens via a dichroic mirror. This resulted in a spot of light at the brain slice whose diameter was 40 or 200 μm, respectively, assuming zero tissue scattering. Photoactivation of Arch (Chow et al., 2010) was achieved via a wide-field, ultra-bright green LED (530 nm peak; Luxeon) placed directly under the slice chamber.
Analysis of intracellular recordings.
Data were analyzed offline using custom-written programs in Igor Pro (Wavemetrics) or MATLAB (MathWorks). Postsynaptic potentials (PSPs) were defined as upward or downward deflections of >2 SDs from baseline. ADs were defined as large-amplitude (>2 SDs above baseline noise) upward deflections of >200 ms in duration in 0.1 Hz high-pass and 10 Hz low-pass filtered intracellular recordings. When using focal puffs of GABA, the value of GABA potentials was defined as the peak GABA-induced membrane potential deviation (excluding action potentials). When optically activating ChR2-expressing PV+ interneurons, the value of postsynaptic GABAergic responses was defined as the average induced membrane potential deviation during a 200 ms period immediately after optical activation. To measure the EGABAA during epileptiform activity, recordings were rapidly alternated between current-clamp and voltage-clamp modes. The current-clamp periods allowed the monitoring of epileptiform activity, whereas the periods in voltage clamp (2 s duration) were used to measure EGABAA with voltage ramp protocols. Each period in voltage clamp consisted of two consecutive voltage ramps (500 ms duration, ramping from −90 to −40 mV). The first ramp was applied under baseline conditions, and the second ramp was applied during activation of GABAARs by local application of GABA. This made it possible to construct I–V plots of the holding current generated by the first ramp and the total current generated by the second ramp (reflecting the holding current plus the current through the activated GABAARs). EGABAA was defined as the voltage at which the holding current and the total current intersected.
To compare Cl− accumulation in different subcellular compartments, Cl− loads were elicited by stepping the membrane voltage to different potentials for 2 s and activating GABAARs with a GABA “loading” puff directed at either the soma or the dendrite (100 ms after the start of the voltage step). Larger depolarizing voltage steps resulted in stronger driving forces on the GABAAR and therefore larger Cl− loads, which were defined as the area under the GABAAR current (expressed in picocoulombs), after adjusting for the holding current associated with the voltage step. Current–voltage curves were then generated by plotting the peak GABAAR current as a function of holding potential, from which resting the EGABAA was defined as the x-intercept value and the peak GABAAR conductance (gGABAA) as the slope. To measure the effect of Cl− loads on EGABAA, a second “test” puff was then delivered 100 ms after the end of the voltage step and therefore 2 s after the first GABA puff. To estimate EGABAA from the test puff, we assumed a constant gGABAA across the two GABA puffs and used the resting EGABAA and gGABAA (calculated as described above) to solve the following equation:
To assess the degree of synchronous activity, Pearson's correlation coefficients were calculated from simultaneous current-clamp recordings in two CA3 pyramidal neurons. Recording epochs were compared during the period before epileptiform activity, the tonic phase, the AD phase, and the period after the epileptiform activity. Correlation coefficients were calculated across 8 s time windows in each case, except for the tonic phase in acute slice recordings in which the entire phase was used (mean duration, 2.0 ± 0.3 s; n = 17).
Modeling.
To investigate the effects of estimating EGABAA from somatic recordings, a multicompartmental model of a rat CA1 hippocampal pyramidal neuron at postnatal day 14 was constructed in the NEURON simulation environment (Carnevale and Hines, 2006). The morphology of the neuron was sourced from NeuroMorpho.Org (Ascoli, 2006) and based on a reconstruction performed by Scorza et al. (2011) (NeuroMorpho.Org identification number NMO_07263). Model parameters were assigned as follows: (1) membrane capacitance, Cm = 1 μF/cm2; (2) axial resistance, Ra = 150 Ω/cm; (3) passive membrane reversal potential, epas = −70 mV; and (4) passive membrane conductance, gpas = 61.0 μS/cm2. This equated to a total input resistance (Ri) of 233 MΩ, as measured by simulated voltage clamp at the soma and that matched the experimentally observed Ri recorded under baseline conditions (233.1 ± 23.7 MΩ, n = 8; see Fig. 3D–F). To simulate a drop in Ri during the AD phase, gpas was increased to 157.2 μS/cm2, which equated to an Ri of 110 MΩ and matched the experimentally observed Ri recorded during the putative AD phase (110.3 ± 6.6 MΩ, n = 8; see Fig. 3D–F). Activation of GABAARs via a GABA puff was simulated by placing 20 GABAAR-containing synapses within a 10 μm radius of either the center of the soma (“simulated somatic GABA”) or within a 10 μm radius of a point on the apical dendrite, 150 μm from the soma (“simulated dendritic GABA”). The GABA response was simulated by using an alpha function with a tau of 250 ms, and the cumulative peak conductance of all 20 GABA synapses (whether at the soma or dendrite) was set to 9.09 nS, reflecting the fact that the experimentally measured peak GABA conductance when puffing over the soma was 9.09 ± 1.35 nS (n = 8; see Fig. 3D–F). No active conductances were included in the model. To recreate the experimental measurements of EGABAA, a simulated voltage clamp was placed at the soma of the modeled neuron, and two consecutive voltage ramps were then applied: one before and one during the simulated activation of GABAARs. The resulting traces were then used to construct I–V plots, and EGABAA was defined in the same way as for the experimental recordings (see above).
Figure 3.
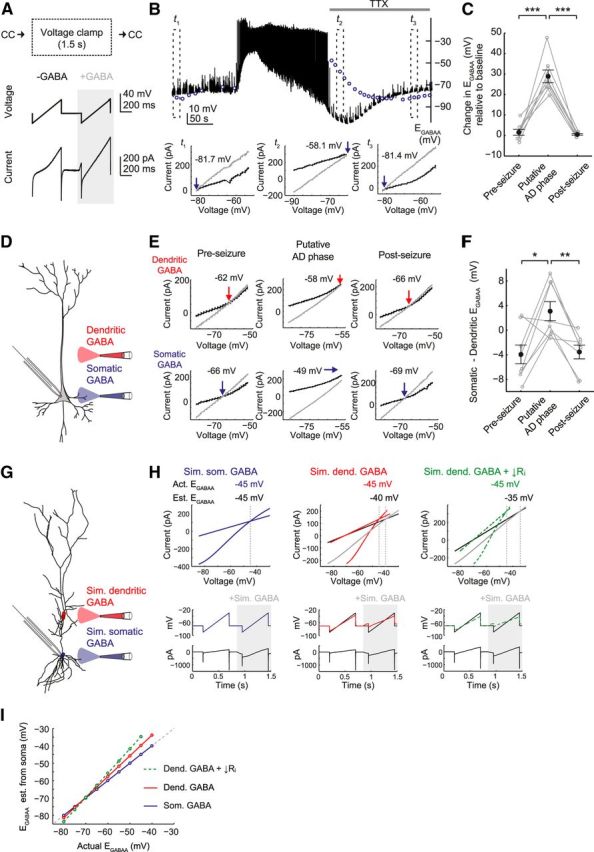
Epileptiform activity causes a transient depolarizing shift in EGABAA that is most pronounced at the somatic compartment. A, To measure EGABAA during epileptiform activity, gramicidin perforated patch-clamp recordings were performed and the mode was rapidly switched from current-clamp (CC) to brief periods in voltage clamp (1.5 s duration) every 10 s. While in voltage clamp, two consecutive voltage ramps were applied: (1) the first without GABA application (−GABA); and (2) the second paired with GABA application (+GABA; see Materials and Methods). B, A representative recording from a CA3 pyramidal neuron (top) in which EGABAA was estimated during the AD phase. To eliminate the effects of ongoing spiking activity on EGABAA measurements, TTX (1 μm) was applied after SLE onset (horizontal gray bar). Because this blocked ADs, we refer to this as the putative AD phase. EGABAA values are indicated by the blue circles, and the dashed boxes highlight periods during the pre-SLE period (t1), putative AD phase (t2), and post-SLE period (t3). I–V plots (bottom) were used to define EGABAA as the voltage at which the holding current (from the first ramp; black line) and the total current (from the second ramp and reflecting the holding current plus the current through GABAARs; gray line) intersect. Note that EGABAA was at hyperpolarized values in the pre-SLE period, switched to depolarizing values during the putative AD phase, before eventually recovering post-SLE. C, Population data showing that EGABAA is significantly more depolarized during the putative AD phase than during the pre-SLE or post-SLE periods (***p < 0.001, paired t test). D, Using a similar recording configuration, SLE-induced depolarizing shifts in EGABAA were compared along the somatodendritic axis of CA3 pyramidal neurons by locally applying GABA to either the dendritic (red) or somatic (blue) compartment. E, I–V plots in which dendritic (top) and somatic (bottom) EGABAA was measured during the pre-SLE period (left), putative AD phase (middle), and post-SLE period (right). Note that, during the putative AD phase, both somatic and dendritic EGABAA had become depolarizing but that the EGABAA shift was greater at the soma. F, Population data showing that SLE-induced depolarizing shifts in EGABAA are more pronounced at the soma. Somatic EGABAA tends to be more negative than dendritic EGABAA in the pre- and post-seizure periods, but this relationship is inverted during the putative AD phase (*p < 0.05 and **p < 0.01, paired t test). G, A multicompartmental model of a rat hippocampal pyramidal neuron with GABAARs at the soma (blue circles) and dendrite (red circles) was generated in the NEURON simulation environment and used to assess the effect of estimating dendritic EGABAA from somatic recordings. H, To parallel the experimental recordings, EGABAA was calculated from voltage ramp protocols delivered to the soma of the model neuron before and during the simulated activation of GABAARs. The simulated GABA conductance was delivered to the soma (left), to the dendrite under baseline conditions (middle; Ri = 233 mΩ), or to the dendrite when the Ri was reduced to match that observed during the AD phase (right; Ri = 110 mΩ). In the example shown, EGABAA was set to −45 mV throughout the somatic and dendritic compartments. The traces (bottom) show the membrane potential and current recorded from the soma of the model neuron (black traces) and the membrane potential actually achieved in the compartment where the simulated GABA conductance was delivered (colored traces). Note that, for somatic GABA, the membrane potential shows no space clamp error (left; blue trace overlaps black trace). In contrast, a voltage ramp in the soma is not able to fully clamp the dendrite (middle; red trace), and this is accentuated when the Ri is reduced (right; green trace). The effects on estimates of EGABAA are illustrated in the corresponding I–V plots (top). In each case, the intersection of the gray and black lines indicates the EGABAA estimated from the soma, whereas the intersection of the colored traces shows the actual EGABAA in the relevant compartment (i.e., after accounting for space clamp). Note that, for the somatic GABA (left), the estimate of EGABAA overlaps with the actual EGABAA. In contrast, estimates of dendritic EGABAA from the soma are more depolarized than the actual EGABAA (middle), and this is accentuated when Ri decreases (right). I, For depolarized EGABAA values, estimates of dendritic EGABAA made from the soma are more depolarized than the actual dendritic E.
To simulate the effect of compartment size on intracellular Cl− concentration [Cl−]i changes, a single-compartment model was generated in MATLAB (MathWorks). This compartment was modeled as a cylinder with a length of 50 μm. The volume of the cylinder was altered by adjusting its radius from 1 to 10 μm. Initial [Cl−]i was set to 4.0 mm, equivalent to an initial EGABAA of −80 mV. Cl− loads of between 0 and 400 pC were applied, and the resulting change in [Cl−]i was determined. No Cl− extrusion mechanisms were included in the model.
Histological analyses.
After intracellular recording, the slices were fixed overnight in 4% paraformaldehyde and 15% saturated picric acid in 0.1 m phosphate buffer, pH 7.4, at 4°C. For immunofluorescence, the slices were washed and embedded in 5% agar and resectioned at 50 μm on a vibrating microtome (VT1000S; Leica). All sections were preincubated in 10–20% normal donkey serum (NDS; Vector Laboratories) in PBS for >1 h at room temperature. Biocytin-filled cells were visualized by incubating sections in 1:10,000 streptavidin-405 conjugate (Invitrogen) in PBS containing 0.3% Triton X-100 (PBS-Tx) overnight at 4°C. YFP expression was visualized by incubating sections in 1:1000 chicken anti-GFP (Aves Labs) in PBS-Tx and 1% NDS overnight at 4°C, followed by 1:500 donkey anti-chicken-488 fluophore (Jackson ImmunoResearch) in PBS-Tx for 2 h at room temperature. Finally, all sections were mounted in Vectashield (Vector Laboratories), and images were captured with an LSM 710 (Zeiss) confocal microscope using ZEN software (Zeiss) or Leica DM5000B epifluorescence microscope using Openlab software (PerkinElmer Life and Analytical Sciences). For DAB immunocytochemistry, the slices were processed using standard protocols, and images of biocytin-filled cells were captured with a Leica DM5000B microscope. The distance between pairs of DAB-labeled CA3 pyramidal neurons was measured as the linear distance between the center of their somata.
Statistics.
All data are presented as means ± SEMs. Student's t test were performed using SPSS 17.0 (IBM SPSS statistics) or GraphPad Prism version 5.0 (GraphPad Software; *p < 0.05, **p < 0.01, ***p < 0.001).
Results
Highly synchronous epileptiform ADs in the hippocampus depend on GABAergic transmission
Epilepsy is characterized by periods of hypersynchronous, hyperexcitability within brain networks (Jiruska et al., 2013). To investigate the cellular basis of hypersynchronous activity during epileptiform activity in the hippocampus, we performed dual whole-cell current-clamp recordings from pairs of pyramidal neurons in the CA3 region of hippocampal organotypic slices and induced epileptiform activity by removing Mg2+ from the slice perfusate (Anderson et al., 1986; Mody et al., 1987; Gutiérrez et al., 1999; Avoli et al., 2002; Fig. 1A). In accordance with previous studies, the resulting epileptiform activity displayed a characteristic tonic–clonic structure. The tonic phase was characterized by a strong and sustained depolarization of the membrane potential (>40 mV), on which occurred high-frequency, low-amplitude discharges (Fig. 1B,C,E). This then transitioned into the clonic or AD phase (Higashima et al., 1996; Trevelyan et al., 2007a; Isomura et al., 2008), which was characterized by a relatively hyperpolarized membrane potential with overlying high-amplitude rhythmic bursts (i.e., ADs), each lasting >200 ms. We refer to the period of activity encompassing both the tonic and AD phase as the seizure-like event (SLE).
Figure 1.

Synchronous ADs depend on GABAergic transmission. A, Diagram of the experimental setup (top), which involved simultaneous whole-cell patch-clamp recordings from two pyramidal neurons at either end of the CA3 region of an organotypic hippocampal brain slice. Image of a slice (bottom) showing the location of the two CA3 pyramidal neurons targeted for recording. B, Dual whole-cell current-clamp recordings of an SLE induced by removing Mg2+ from the slice perfusate (0 Mg2+ seizures). Four epochs representing the pre-SLE period (t1), tonic phase (t2), AD phase (t3), and post-SLE period (t4) are denoted by dashed rectangles. C, Insets show the four epochs in B, with recordings from the two neurons superimposed to reveal the extent of synchronous activity. The Pearson's coefficient (r) was calculated from a direct linear correlation of the two raw traces during each epoch (8 s duration). The values demonstrate that the degree of correlation increased significantly during the SLE and peaked during the AD phase. D, Population data showing a significant increase in correlated activity between pairs of CA3 pyramidal neurons during the AD phase compared with the tonic phase of 0 Mg2+-induced seizures (***p < 0.001, t test). E, Representative current-clamp recordings from CA3 pyramidal neurons during epileptiform activity evoked under three different conditions: (1) a 0 Mg2+ SLE (top, black trace); (2) an SLE elicited by removing Cl− from the aCSF (0 Cl− SLE; middle, blue trace); and (3) an SLE elicited in 0 Mg2+ + picrotoxin (bottom, green trace). Note that the latter two SLEs lack ADs. F, Models of epileptiform activity that reduce or abolish GABAergic signaling lack ADs (***p < 0.001, t test).
Our dual recordings enabled us to assess the degree of synchronization during epileptiform activity. Using linear correlation as a measure of synchronization (Jiruska et al., 2013), we compared (1) the pre-seizure period before the SLE had initiated, (2) the tonic phase of the SLE, (3) the AD phase, and (4) the post-seizure period after the SLE had ended (Fig. 1B,C). Consistent with previous work, the correlation and hence synchrony observed during the tonic and AD phases were markedly increased compared with pre- and post-SLE levels (pre-SLE, r = 0.10 ± 0.05; tonic, r = 0.80 ± 0.03; AD, r = 0.95 ± 0.01; and post-SLE, r = 0.06 ± 0.04; p < 0.001, paired t-tests, n = 18; Fig. 1C,D). Furthermore, the degree of correlated activity was observed to increase as the epileptiform activity progressed, with the level of correlation reaching its highest levels during the AD phase and being significantly greater than during the tonic phase (r = 0.95 vs 0.80; p < 0.001, paired samples t test). Therefore, the AD activity that constitutes the clonic phase represents a particularly synchronous form of network activity that emerges during epileptiform activity.
GABAergic transmission has been shown to play a central role in the synchronization of neuronal activity during physiological and pathological network states (Michelson and Wong, 1991; Cobb et al., 1995; Klausberger et al., 2003; Aradi and Maccaferri, 2004; Zsiros et al., 2007; Ellender et al., 2010). To test whether GABAergic transmission plays an important role during the highly synchronous AD phase, we examined two models in which GABAergic signaling was disrupted. First, GABAARs were blocked with picrotoxin (100 μm) during the induction of epileptiform activity with the 0 Mg2+ model. Second, epileptiform activity was induced using a 0 mm Cl− model in which the driving force for GABAARs is removed by eliminating Cl− from the aCSF (Yamamoto and Kawai, 1967; Chamberlin and Dingledine, 1988). Both of these models resulted in shorter SLEs that almost entirely lacked ADs (0 Mg2+ model, 30.3 ± 6.2 ADs per SLE, n = 36; 0 Mg2+ model + 100 μm picrotoxin, 0.7 ± 0.1 ADs per SLE, n = 26; 0 Cl− model, 0.4 ± 0.2 ADs per SLE, n = 31; p < 0.001, t tests; Fig. 1E,F). We next set out to determine how GABAergic activity might contribute to the generation of highly synchronous ADs.
GABAergic transmission becomes excitatory during the AD phase of epileptiform activity
Strong activation of GABAARs can lead to intracellular Cl− accumulation and a change in the driving force for GABAARs (Staley and Proctor, 1999). To examine potential changes in GABAergic transmission during the AD phase of hippocampal seizure activity, we performed gramicidin perforated patch-clamp recordings from the soma of CA3 pyramidal neurons during 0 Mg2+-induced epileptiform activity. This recording configuration avoids disruption of the [Cl−]i of the neuron (Kyrozis and Reichling, 1995). The membrane potential was measured in current-clamp mode, and GABAARs were activated by delivering brief puffs of GABA (100 μm) to the soma of the recorded neuron every 10 s in the presence of a GABAB receptor antagonist (CGP55845, 5 μm). GABA-mediated potentials were defined as the change in membrane potential after GABAAR activation (excluding action potentials) relative to resting membrane potential before SLE onset. Before the start of SLEs, GABA-mediated potentials were hyperpolarizing compared with the resting membrane potential, with a mean value of −3.9 ± 0.6 mV (n = 11). However, during the AD phase of SLEs, GABA-mediated potentials became significantly depolarizing (23.8 ± 1.6 mV, p < 0.001, paired samples t test, n = 11). Indeed, during the AD phase, GABAAR activation could independently generate action potentials, revealing that EGABAA exceeded the action potential threshold (Fig. 2B). This recovered in the post-SLE period when GABAAR potentials returned to pre-SLE levels (−3.5 ± 0.6 mV; Fig. 2A–C, left).
Figure 2.

Transient depolarizing shifts in postsynaptic GABAergic signaling are a general feature of epileptiform activity. A, The postsynaptic response to GABAAR activation was investigated in three in vitro models of epileptiform activity: (1) a 0 Mg2+ model (left); (2) a 4-AP model (middle); and (3) a spontaneous model (right). Gramicidin perforated patch-clamp recordings in current-clamp mode were made from CA3 pyramidal neurons, and GABAAR-mediated responses were elicited every 10 s by delivering a puff of GABA (100 μm) to the cell soma. When individual responses to GABA could be clearly identified on the background activity, the effect on the membrane potential was calculated and defined as the GABA-mediated potential (blue circles). Note how GABA-mediated potentials became depolarizing during all three models of epileptiform activity. B, Representative GABA-mediated potentials corresponding to the dashed boxes in A. In many cases, the depolarizing effect of the GABA puff was sufficient to generate action potentials. C, Population data demonstrate that GABAAR activation had a pronounced depolarizing effect on the membrane potential during the AD phase (***p < 0.001, paired t test).
A similar SLE-induced depolarizing shift in GABAergic transmission was observed in two additional in vitro models of seizure activity: (1) the 4-AP model in which the voltage-gated K+ channel antagonist 4-AP (50 μm) was added to the bath solution (Perreault and Avoli, 1992); and (2) the spontaneous model in which hippocampal organotypic slices are maintained in culture until they spontaneously generate epileptiform activity in standard aCSF (Dyhrfjeld-Johnsen et al., 2010; Berdichevsky et al., 2012; Lillis et al., 2012). For the 4-AP model, GABAAR potentials shifted from −1.0 ± 2.1 mV in the pre-SLE period to 28.5 ± 0.7 mV during the AD phase (p < 0.001, n = 5). Meanwhile, for spontaneously generated SLEs, GABAAR potentials shifted from −5.0 ± 0.9 mV during the pre-SLE period to 18.0 ± 1.7 mV (p < 0.001, n = 15) during the AD phase (Fig. 2A–C, middle and right). This demonstrates that pronounced depolarizing shifts in GABAAR potentials are a general feature of the AD phase during epileptiform activity.
Epileptiform activity causes transient depolarizing shifts in EGABAA that are most pronounced within the somatic compartment of pyramidal neurons
To confirm that the depolarizing GABAergic potentials observed during the AD phase were attributable to a transient collapse in the driving force for the GABAAR, we used gramicidin recordings to perform measurements of EGABAA during epileptiform activity. The recording configuration was rapidly switched between current-clamp mode and brief periods in voltage-clamp mode, during which a voltage ramp protocol was used to generate a rapid estimate of EGABAA (Fig. 3A). Because large membrane potential changes interfered with the estimate of EGABAA, measurements were made immediately after the tonic phase or in SLEs in which the ADs were abolished by fast superfusion of tetrodotoxin (TTX; 1 μm). Therefore, we refer to our EGABAA measurements as relating to the putative AD phase. As shown in Figure 3, B and C, epileptiform activity produced a pronounced shift in EGABAA of 28.8 ± 3.1 mV (p < 0.001; n = 8) during the putative AD phase. Within 60–80 s after SLE offset, EGABAA had recovered to baseline levels (p = 0.3 compared with pre-SLE levels, t test). Because intracellular Cl− is the major determinant of EGABAA, the observed depolarizing shift in EGABAA is consistent with an SLE-induced accumulation of intracellular Cl− that is evident during the AD phase.
Hippocampal pyramidal neurons receive GABAergic synaptic input across their somatodendritic axis (Klausberger and Somogyi, 2008). To determine whether SLE-induced shifts in GABAAR signaling might differ between subcellular compartments, we performed gramicidin perforated patch-clamp experiments in which we selectively activated either somatic or dendritic GABAARs. By rapidly switching from current-clamp to voltage-clamp mode and by puffing GABA at two independent locations on the postsynaptic neuron, EGABAA could be calculated at both somatic and dendritic locations (∼150 μm from the soma; Fig. 3D,E). The SLE-induced depolarizing shift in EGABAA was more pronounced in the somatic compartment than in the dendritic compartment of CA3 hippocampal pyramidal neurons. Although both compartments experienced a depolarizing shift in EGABAA (Fig. 3E), the shift in EGABAA during the putative AD phase was 7.1 ± 1.6 mV greater at the soma than at the dendrites (p < 0.01; n = 8; Fig. 3F). This somatodendritic difference cannot be accounted for by space-clamp effects associated with somatic voltage-clamp recordings. Computer simulations using a multicompartmental model of a rat hippocampal pyramidal neuron (Fig. 3G; see Materials and Methods) demonstrated that, for measurements made from the soma, depolarized dendritic EGABAA values tend to be overestimated in terms of the degree of depolarizing shift and that this effect increases when the Ri of a neuron drops, as occurs during the putative AD phase (Fig. 3H,I; see Materials and Methods). Therefore, our observed somatodendritic difference in EGABAA shifts is best explained by either increased activity of soma-targeting GABAergic inputs during SLEs or biophysical differences in compartment susceptibility to Cl− loads.
Compared with the soma, dendrites are intrinsically more prone to Cl− accumulation and a collapse in EGABA
To investigate whether subcellular compartments of a neuron differ in their ability to deal with an exogenous Cl− load, we performed gramicidin perforated patch-clamp recordings from hippocampal pyramidal cells while GABA was locally applied by puffer pipette either to the soma or the dendrites (Fig. 4A). An initial loading GABA puff was followed by a subsequent test GABA puff (both 20 ms). The amount of Cl− entering the cell during the loading puff could be varied by changing the membrane potential at which the GABA puff was applied. More positive membrane potentials, by being farther from resting EGABAA, served to increase the driving force for Cl− across activated GABAARs. The test GABA puff was always applied at the same membrane potential and allowed EGABAA and hence [Cl−]i to be calculated (see Materials and Methods). Although Cl− influx elicited by puffing over the dendrites had an obvious effect on the size and direction of the current evoked by the test puff (Fig. 4B), a much reduced effect was seen when Cl− was loaded over the soma (Fig. 4C). Population data confirmed this difference (Fig. 4D,E). The slope of the linear fit between Cl− load and change in [Cl−]i was significantly steeper for GABAAR currents elicited over the dendrites (37.84 ± 4.38 mm/nC) as opposed to the soma (5.85 ± 0.89 mm/nC; p < 0.0001, t test; Fig. 4D) in organotypic hippocampal slices. Similarly in acute slices, the slope of the linear fit between Cl− load and change in [Cl−]i was significantly steeper for the dendritic compartment (72.20 ± 10.46 mm/nC) compared with the somatic compartment (16.02 ± 1.040 mm/nC; p < 0.0001, t test; Fig. 4E). These data are consistent with the idea that the volume of the subcellular compartment affects the rate of Cl− accumulation. To confirm this, we simulated the effect of Cl− loads on [Cl−]i changes using a single-compartment cylindrical model of different volumes. For a given Cl− load, a smaller volume compartment resulted in larger increases in [Cl−]i (Fig. 4F).
Figure 4.

Because of their larger volume, the somatic compartments of neurons are more resistant to Cl− accumulation than dendritic compartments. A, Gramicidin voltage-clamp recordings from hippocampal CA3 pyramidal neurons in which GABAARs were activated by puffing 100 μm GABA to either the dendritic compartment (red) or somatic compartment (blue). Different sized Cl− loads were elicited by depolarizing the membrane potential (for 2 s in increasing 2.5 mV depolarizing steps) and simultaneously activating GABAARs (100 ms after the start of the step). Larger depolarizing voltage steps resulted in stronger driving forces on the GABAAR and therefore larger Cl− loads. At 100 ms after the end of the voltage step (and therefore 2 s after the loading GABA puff), a second test GABA puff was delivered to estimate whether EGABAA had changed. B, When the puffer pipette was positioned over the dendritic compartment, increasing amounts of Cl− loaded by the first puff affected the size and direction of GABAAR currents to the test puff. C, This effect was not as evident when similar Cl− loads were generated at the somatic compartment. D, Population data from organotypic hippocampal slices showed that the dendritic compartment of hippocampal pyramidal neurons is more susceptible to a Cl− load than the somatic compartment. E, A similar relationship between the dendritic and somatic compartments was evident in acute slices. F, A single-compartment model was used to simulate the effect of compartment volume on Cl− accumulation. The compartment was modeled as a cylinder with a length of 50 μm and radius varying from 1 to 10 μm. Smaller-volume compartments (warmer colors) resulted in larger increases in [Cl−]i for a given Cl− load.
These observations support the conclusion that the dendritic compartment is generally more susceptible to Cl− loads than the somatic compartment. Therefore, the larger depolarizing shift in EGABAA observed at the soma during epileptiform activity cannot be accounted for by biophysical differences between these two compartments. Rather, it is consistent with previous evidence that somatic-targeting GABAergic inputs are relatively more active during epileptiform activity than their dendritic-targeting counterparts (Fujiwara-Tsukamoto et al., 2010).
GABAergic inputs from PV+ interneurons become excitatory during epileptiform activity and can elicit ADs in pyramidal neurons
The large depolarizing shift in EGABAA observed at the soma of pyramidal neurons suggests that somatic-targeting GABAergic interneurons would be well placed to coordinate excitatory activity during the AD phase. To investigate this, we used an optogenetic approach to isolate and selectively activate PV+ interneurons during different phases of epileptiform activity. PV is expressed by a large proportion of somatic-targeting interneurons in the hippocampus, including basket cells and axo-axonic cells (Klausberger et al., 2003; Somogyi and Klausberger, 2005). To express ChR2–YFP in PV+ interneurons, we used injections of AAV2 containing the double-floxed sequence for the light activatable channel ChR2–YFP in the ventral hippocampus of PV–Cre mice (Fig. 5A). After a survival time of 4–8 weeks, which enabled sufficient expression of ChR2–YFP in the somata and axonal arbors of the PV+ interneurons, transverse hippocampal slices were prepared. Fluorescence illumination revealed a dense network of YFP-positive fibers localized to stratum pyramidale and consistent with a perisomatic axonal projection pattern (Fig. 5C). We found that short, 1 ms blue laser (470 nm) light pulses delivered to stratum pyramidale of the slice generated single action potentials in fast-spiking YFP+ neurons (Fig. 5B). Conversely, whole-cell current-clamp recordings from postsynaptic CA3 pyramidal neurons showed pronounced IPSPs after blue laser light pulses (1 ms, 470 nm), which were mediated by GABAARs because they could be blocked by bath application of the GABAAR antagonist SR95531 (200 nm; n = 3; Fig. 5C).
Figure 5.

GABAergic inputs from PV+ interneurons become excitatory during epileptiform activity and can elicit ADs in pyramidal neurons. A, The experimental setup consisted of a hippocampal slice containing PV+ interneurons expressing ChR2–YFP. Individual CA3 pyramidal neurons were patched and epileptiform activity was initiated via a stimulating electrode placed in the pyramidal cell layer. B, Recordings from the ChR2–YFP cells confirmed that they exhibit the characteristic I–V relationship and spiking activity of PV+ fast spiking interneurons (top right) and that optical activation with blue laser pulses (473 nm, 1 ms duration) elicited action potentials in these cells (bottom left). C, Activating PV+ ChR2-expressing interneurons elicited an IPSP in nearby CA3 pyramidal neurons (bottom left), which was blocked by application of a GABAAR antagonist (SR95531, 200 nm). Here the CA3 pyramidal neuron was filled with biocytin during recording and revealed post hoc using streptavidin-405 (red). Note the restricted localization of YFP+ fibers (green) in the pyramidal cell layer, as delineated by Nissl staining (blue). D, Representative recording (top) from a CA3 pyramidal neuron in which electrical stimulation led to the initiation of an SLE (black trace) and a control trial in which the stimulation intensity was reduced below the threshold for eliciting an SLE (gray trace). Every 10 s, PV+ ChR2-expressing interneurons were optically activated, and example postsynaptic responses (bottom) are shown for different time points (L1–L5). Note the change in the postsynaptic response after activation of the PV+ interneurons from a hyperpolarizing response in the pre-SLE period, to depolarizing and excitatory responses during the AD phase, and back to hyperpolarizing in the post-SLE period. E, The mean postsynaptic response after optical activation of PV+ interneurons was depolarizing during the AD phase but hyperpolarizing during the pre- and post-SLE periods (**p < 0.01, t test). F, Activation of PV+ interneurons evokes ADs during the AD phase. Histogram (200 ms bin width) shows the AD probability recorded when PV+ interneurons were optically activated (top; blue bars) and when there was no laser activation of ChR2 (bottom). G, Optical activation of PV+ interneurons entrains ADs and recruits endogenous AD mechanisms. Activation of PV+ interneurons every 10 s caused an immediate fivefold increase in the probability of an AD (0–200 ms after activation; **p < 0.01, t test), which was then followed by an immediate decrease in the probability of an AD (200–400 ms after ChR2 activation; *p < 0.05, t test).
To investigate how the postsynaptic effects of PV+ interneurons change during epileptiform activity, we elicited SLEs and optically activated PV+ interneurons in stratum pyramidale (Fig. 5A,D). SLEs were facilitated in acute slices by superfusion with aCSF containing 0 mm Mg2+ and 5 mm K+ at a rate of 6 ml/min (Anderson et al., 1986; Mody et al., 1987; Gutiérrez et al., 1999). The onset of SLEs was controlled by delivering a brief train of electrical stimuli (20 pulses at 100 Hz) via a stimulating electrode positioned in CA3 stratum pyramidale (Etherington and Frenguelli, 2004). Once the correct stimulation intensity was identified, SLEs could be elicited every 10 min. Whole-cell patch-clamp recordings from CA3 pyramidal neurons (Fig. 5D) confirmed that the epileptiform activity exhibited an initial tonic component (characterized by a pronounced depolarization of the membrane potential), which again transitioned into a clonic phase characterized by a relatively hyperpolarized membrane potential with rhythmic high-amplitude bursts (ADs) that were hypersynchronous across the CA3 region (Fig. 6D). Optical activation of PV+ interneurons (with 1 ms laser pulses every 10 s for the duration of the recording) enabled us to investigate the postsynaptic effects of PV+ interneurons before, during, and after epileptiform activity. PV+ interneuron-mediated PSPs were hyperpolarizing in the pre-SLE period but became robustly depolarizing during the AD phase (pre-SLE, −1.73 ± 0.35 mV; AD phase, 12.08 ± 1.00 mV; p < 0.01, paired samples t test; n = 26) and then returned to hyperpolarizing after the SLE (post-SLE, −1.63 ± 0.42 mV; p < 0.01, paired samples t test; n = 26; Fig. 5D,E). In control trials in which the stimulation intensity was below the threshold for eliciting epileptiform activity, PV+ interneuron-mediated PSPs remained hyperpolarizing throughout (−2.16 ± 0.24, −1.82 ± 0.20, and −1.87 ± 0.24 mV; corresponding to the pre-SLE period, AD phase, and post-SLE period, respectively; n = 23; Fig. 5D,E). Finally, in a subset of slices in which spontaneous epileptiform activity occurred without electrical stimulation, the PV+ interneuron-mediated PSPs again became depolarizing during the AD phase (pre-SLE, −0.5 ± 0.1 mV; AD phase, 10.1 ± 0.6 mV; and post-SLE, −0.2 ± 0.04 mV; p < 0.01, paired samples t test; n = 5).
Figure 6.

PV+ interneuron activation can recruit and synchronize excitation across the CA3 region during the AD phase. A, In hippocampal slices containing PV+ interneurons expressing ChR2–YFP, simultaneous recordings were made from two spatially separated pyramidal neurons at opposite ends of the CA3 region. Localized activation of PV+ ChR2-expressing interneurons was only performed close to one of the pyramidal neurons, the local pyramidal neuron (black), by delivering spatially targeted blue laser pulses (40 μm spot size; see Materials and Methods). The pyramidal neuron that was distant to the region of ChR2 activation was referred to as the distal neuron (red). Epileptiform activity was initiated via a stimulating electrode placed equidistant between the pyramidal neurons. B, Two representative neurons that were filled with biocytin during recording and subsequently reacted with DAB. C, Membrane potential traces (middle) recorded simultaneously from a local (black) and a distal (red) CA3 pyramidal neuron. Four different epochs (t1–t4) are denoted by dashed rectangles and were used to calculate the degree of correlated activity over the course of the SLE. Correlation coefficients were calculated across 8 s time windows, except for the tonic phase in which the entire phase was used (mean duration, 2.0 ± 0.3 s; n = 17).The corresponding expanded traces and Pearson's correlation coefficients are shown (top insets). The highest correlated activity occurred during the AD phase (t3) (**p < 0.01, t test). Also indicated are three time points (L1–L3, blue) at which PV+ interneurons close to the local neuron were optically activated and for which the corresponding expanded traces are shown (bottom insets). Note that the distal neuron did not show a response to PV+ interneuron activation in the pre-SLE (L1) or post-SLE (L3) periods. However, activating the same PV+ interneurons during the AD phase (L2) elicited an AD in both the local and distal pyramidal neurons. D, Population data showing that the highest level of correlated activity between pairs of distant CA3 pyramidal neurons occurred during the AD phase (**p < 0.01, t test). E, Activation of PV+ interneurons during the AD phase recruits excitatory effects across the CA3 region. During the pre-SLE period, pyramidal neurons that are distal to the activated PV+ interneurons did not show any postsynaptic response. However, activating the same PV+ interneurons during the AD phase caused ADs that were evident in both the local and distal pyramidal neurons (**p < 0.01, t test).
Not only did we observe that PV+ interneuron-mediated PSPs became depolarizing during the epileptiform activity but also that ChR2 activation could induce ADs in the majority of cases (Fig. 5D). An analysis of the ADs revealed that optically activating PV+ interneurons did not increase the mean AD frequency during SLEs (no ChR2 activation, 0.77 ± 0.08 Hz compared with ChR2 activation, 0.80 ± 0.05 Hz; p > 0.05, independent-samples t test; n = 10 and n = 33). However, PV+ interneuron activation generated a robust entrainment in the timing of ADs (Fig. 5F). Overall, the probability of an AD occurring was five times higher in the 200 ms immediately after PV+ interneuron activation (mean probability of 0.49 ± 0.05 × 10⁻²; 0–200 ms after ChR2 activation) than in the 200 ms preceding ChR2 activation (mean probability of 0.11 ± 0.05 × 10⁻²; p < 0.01, paired-samples t test; n = 26; Fig. 5G). Furthermore, consistent with the idea that optically evoked ADs recruited the same network mechanisms as endogenous ADs, the probability of an AD occurring dropped to 0.05 ± 0.03 × 10⁻² in the period 200–400 ms after ChR2 activation, which was significantly lower than the probability before ChR2 activation (p < 0.05, paired-samples t test; n = 26; Fig. 5G).
In summary, selective activation of PV+ interneurons generated IPSPs before the epileptiform activity, but these became strongly depolarizing by the clonic AD phase of the epileptiform activity. Moreover, the depolarization mediated by the PV+ interneurons was sufficient to elicit and entrain clonic ADs in the hippocampal network.
PV+ interneurons recruit and synchronize excitation across distant pyramidal neurons during the AD phase
Clonic ADs are large-amplitude events that recruit synchronous network activity across the tissue (Trevelyan et al., 2007a; Jiruska et al., 2013). To investigate the extent to which PV+ interneurons can recruit synchronous network activity during the AD phase, we performed dual whole-cell patch-clamp recordings from a “local” and a “distal” pyramidal neuron in the CA3 region (Fig. 6A,B). In the majority of cases, subsequent histological analysis enabled us to confirm the distance between the somata of the recorded neurons as 474 ± 25 μm (n = 5 pairs). First, and consistent with our observations in organotypic hippocampal slices (Fig. 1), our dual recordings in acute slices revealed that synchrony (as measured using linear correlation; see Materials and Methods) between pyramidal neurons increased during epileptiform activity (pre-SLE, r = 0.16 ± 0.04; tonic, r = 0.71 ± 0.05; AD, r = 0.94 ± 0.01; and post-SLE, r = 0.13 ± 0.05; n = 17 SLEs) and reached its maximum during the AD phase (tonic vs AD phase; p < 0.01, paired-samples t test; n = 17 SLEs; Fig. 6C,D). The high correlation value recorded during the AD phase was associated with an increase in the speed with which activity propagated through the network. Whereas the delay in the onset of the tonic phase recorded from the two neurons was calculated as 51.6 ± 15.8 ms, the onset of ADs exhibited a delay of only 3.96 ± 0.95 ms (n = 6 pairs). Such an increase in propagation speed would be expected to contribute to the higher levels of correlated activity during the AD phase and supports the conclusion that specific circuit dynamics underlie this phase of epileptiform activity.
Next, we assessed whether local activation of a subset of PV+ interneurons could recruit a “full” AD across the CA3 region. PV+ interneurons close to the local pyramidal neuron were activated using a small spot of blue laser light (∼40 μm diameter; see Materials and Methods), which under pre-SLE conditions evoked an IPSP in the local pyramidal neuron but no response in the distal pyramidal neuron (Fig. 6C,E). However, the same optical activation had different effects when delivered during SLEs. During the AD phase, optical activation of PV+ interneurons close to the local pyramidal neuron now generated robust AD responses in both local pyramidal neurons and distal pyramidal neurons (AD phase local, 7.68 ± 1.80 mV; and AD phase distal, 9.12 ± 2.28 mV; n = 7; Fig. 6C,E). Thus, PV+ interneurons exhibited an extended sphere of influence during the AD phase that mediated synchronous excitation across pyramidal neurons. Importantly, when we compared endogenous ADs with those that were evoked via optical activation of local PV+ interneurons, we found that the ADs were very similar in terms of their spatiotemporal properties. The delay in AD onset and degree of synchronization between the local and distal pyramidal neurons was not different for endogenous ADs (time delay, 3.96 ± 0.95 ms; Pearson's correlation, r = 0.92 ± 0.04) and optically evoked ADs (time delay, 3.10 ± 0.82 ms; Pearson's correlation, r = 0.92 ± 0.03; p > 0.05 in both cases, independent-samples t test; n = 6). Together, these results reveal that PV+ interneurons are well placed to synchronize ADs across large assemblies of pyramidal neurons in the CA3 region.
Inhibiting PV+ interneurons during epileptiform activity reduces AD incidence
The fact that selectively activating PV+ interneurons can entrain ADs, which appear to recruit the same network mechanisms as endogenous ADs, suggests that the excitatory postsynaptic effects of PV+ interneurons are a critical component of ADs. To test this directly, we set out to silence PV+ interneurons during the AD phase and thereby assess whether PV+ interneurons are necessary for maintaining ADs. Injections of AAV2 containing the double-floxed sequence for the light activatable H+ pump Arch were made into the ventral hippocampus of PV–Cre mice to express Arch–GFP in PV+ interneurons. This enabled a selective hyperpolarization of PV+ interneurons by up to 20 mV (mean of −8.9 ± 4.3 mV; n = 4; Fig. 7B,C) in acute hippocampal brain slices prepared 4–8 weeks later. To test the contribution of PV+ interneurons during the AD phase, we selected slices that exhibited strong somatic expression of Arch–GFP throughout the CA3 region and activated Arch across this area of the slice with a wide-field green light-emitting diode (530 nm; see Materials and Methods; Fig. 7A). SLEs were initiated and monitored as described previously, and a within-slice design was used to compare SLEs in which the activity of PV+ interneurons was left undisturbed or in which PV+ interneurons were inhibited for a period of 10 s during the AD phase (Fig. 7A,D). The order in which SLEs were paired with optical activation of Arch was randomized. Optical silencing of PV+ interneurons during the AD phase caused a significant decrease in the frequency of ADs (Fig. 7D,E). AD frequency without Arch activation was 0.55 ± 0.12 Hz, whereas AD frequency during Arch activation dropped to 0.27 ± 0.10 Hz (p < 0.01, paired Student's t test; n = 8; Fig. 7E). Together, these results are consistent with the conclusion that the excitatory effects of PV+ interneurons serve to maintain epileptiform activity by recruiting synchronous ADs.
Figure 7.

The frequency of ADs is reduced by optically silencing PV+ interneurons. A, The experimental setup consisted of a hippocampal slice in which PV+ interneurons throughout the CA3 region expressed Arch–GFP. Individual CA3 pyramidal neurons were targeted for whole-cell current-clamp recordings and epileptiform activity was induced via a stimulating electrode in the pyramidal cell layer. Arch was activated across the entire CA3 region using a wide-field green LED (530 nm). B, Recordings from the Arch-expressing neurons confirmed that they exhibit the characteristic I–V relationship and spiking activity of PV+ fast spiking interneurons (top right) and that activating Arch resulted in a sustained hyperpolarization of the membrane potential (bottom left). C, Inhibition with Arch was specific to PV+ interneurons. Recordings from pyramidal neurons (confirmed from firing pattern; top right) showed no response during Arch activation under resting conditions (bottom left). D, Representative recording of two consecutive SLEs from a CA3 pyramidal neuron. In the control SLE (gray trace), there was no Arch activation. In the other SLE (green trace), PV+ interneurons were selectively inhibited during the AD phase by activating Arch (highlighted green region). This resulted in a marked reduction in the incidence of ADs. E, Population data showing a significant reduction in AD frequency during optical inhibition of PV+ interneurons (**p < 0.01, t test).
Discussion
Here we have used in vitro hippocampal slice models of epileptiform activity to investigate the mechanisms that contribute to hypersynchronous ADs during the clonic phase of seizures. Our data show that the generation of ADs in the CA3 region requires GABAergic transmission that becomes excitatory as a result of a transient collapse in EGABAA. The resulting depolarizing shift in GABAergic signaling is most pronounced at the somatic region of pyramidal neurons, and release of GABA from perisomatic-targeting PV+ interneurons during the clonic phase can entrain ADs that recruit pyramidal neurons across the network. Meanwhile, selective inhibition of PV+ interneurons during the clonic phase has the inverse effect and causes a reduction in the frequency of ADs. Together, these results demonstrate that, once epileptiform activity is established, PV+ interneurons are able to maintain epileptiform activity dynamics through direct depolarizing effects on their postsynaptic targets.
States of hypersynchrony have been induced classically by enabling recurrently connected excitatory neurons to synchronize their activity via removal of feedforward and feedback synaptic inhibition (Miles and Wong, 1983, 1987). We find that the hypersynchronous clonic AD phase is dependent on GABAAR-mediated transmission, because blocking GABAAR activity markedly reduces the occurrence of ADs. This is consistent with the observation that ADs after tetanic stimulation of CA1 “minislices” can be blocked by application of the GABAAR antagonist bicuculline (Fujiwara-Tsukamoto et al., 2003; Isomura et al., 2003) and reports that AD-like activity can be generated in the absence of glutamatergic transmission (Fujiwara-Tsukamoto et al., 2010). Our results extend these previous observations and are consistent with GABA and interneuronal networks playing a key role in the clonic AD phase of epileptic seizures.
The fact that GABAAR signaling becomes excitatory during the AD phase of four different in vitro models of hippocampal epileptiform activity strongly suggests that this is a general feature of epileptiform activity. Using gramicidin perforated patch-clamp recordings, we confirmed that this was attributable to a epileptiform-associated depolarizing shift in EGABAA, which is likely to result from the loading of Cl− through GABAARs (Fujiwara-Tsukamoto et al., 2007; Isomura et al., 2008; Ilie et al., 2012, Raimondo et al., 2013), although modulation of potassium–chloride-cotransporter proteins may also contribute (DeFazio et al., 2000; Viitanen et al., 2010). Indeed, the intense activation of GABAARs and concurrent membrane depolarization that occurs during seizures provides the ideal conditions for rapid intracellular Cl− accumulation (Raimondo et al., 2012). By probing GABAAR responses in both the dendritic and somatic compartments of pyramidal neurons, we found that, although both compartments undergo a depolarizing shift in EGABAA, the effect is most pronounced at the soma and cannot be accounted for by space-clamp effects associated with somatic voltage-clamp recordings. In agreement with previous observations (Staley and Proctor, 1999), we show that the smaller-volume dendritic compartment is more susceptible to changes in intracellular Cl− concentration. Furthermore, one might expect enhanced Cl− accumulation within dendrites because they are the predominant site of depolarizing glutamatergic drive, and the relative amplitude of GABAergic PSPs to dendrites can increase when recurrent inhibitory circuits are repeatedly activated (Pouille and Scanziani, 2004). In addition, perisomatic synapses formed by PV+ interneurons are regulated by voltage-dependent Cl− channels that serve to reduce intracellular Cl− accumulation (Földy et al., 2010). Therefore, our observations suggest that GABAARs at the soma must be considerably more active than dendritic GABAARs during the early phase of SLE activity. This is supported by evidence that somatic-targeting, fast-spiking interneurons are most strongly recruited around SLE onset (Timofeev et al., 2002; Ziburkus et al., 2006; Gnatkovsky et al., 2008; Fujiwara-Tsukamoto et al., 2010; Cammarota et al., 2013).
Optogenetic techniques enabled us to dissect how epileptiform-associated changes in EGABAA influence the effect of somatic-targeting interneurons on pyramidal neuron activity. We selectively activated or inhibited PV+ interneurons, which comprise a large proportion of perisomatic-targeting interneurons, including basket cells and axo-axonic cells (Somogyi and Klausberger, 2005). As expected, ChR2-mediated optical activation of PV+ interneurons before an SLE led to hyperpolarizing postsynaptic GABAAR responses in CA3 pyramidal neurons. However, during SLEs, the postsynaptic GABAAR responses rapidly became depolarizing, consistent with an activity-dependent depolarizing shift in EGABAA. On this background of excitatory GABAergic signaling, activation of PV+ interneurons during the clonic phase was sufficient to directly initiate and entrain clonic ADs in pyramidal neurons of the CA3 region, such that the highest probability of AD generation occurred immediately after PV+ interneuron activation. Additional evidence that somatic-targeting interneurons are well placed to synchronize network excitation came from the fact that activating only a subset of PV+ interneurons during the clonic phase was able to drive synchronous excitation across distal regions of the network. This spatial feature of the excitatory actions of PV+ interneurons suggests that the recruitment of an AD involves excitation through polysynaptic circuits or additional mechanisms, such as altered gap-junction synchronization during the clonic phase (Rouach et al., 2003; Beaumont and Maccaferri, 2011). Given the timing of AD propagation that we observed, it is possible that both of these mechanisms could contribute (Köhling et al., 2001). Importantly, the fact that the spatiotemporal properties of optically evoked ADs were indistinguishable from those of endogenous ADs suggests that they use the same underlying mechanisms and support the conclusion that somatic-targeting interneurons switch from restraining to perpetuating seizure activity. Finally, as a confirmation that PV+ interneurons are involved in maintaining ADs, we demonstrated that widespread optical inhibition of PV+ interneurons during the clonic phase significantly reduces AD frequency.
Previous work has focused on the onset of the tonic phase of seizures and how a network may generate, or succumb to, an ictal event. The onset of the tonic phase has been characterized as a transient breakdown of inhibitory synaptic mechanisms, which are normally recruited to “restrain” network excitability (Trevelyan et al., 2006, 2007b; Cammarota et al., 2013). Strong recruitment of GABAergic interneurons can lead to a temporary loss of this inhibitory restraint, via mechanisms such as a transient decrease in GABA release (Zhang et al., 2012), a reduction in postsynaptic GABAAR inhibition (Lillis et al., 2012), or as a result of GABAergic interneurons entering a temporary state of depolarizing block (Ziburkus et al., 2006; Cammarota et al., 2013). Consistent with these ideas, it has been shown that interneurons are strongly recruited before the onset of an ictal event (Timofeev et al., 2002; Ziburkus et al., 2006; Fujiwara-Tsukamoto et al., 2010; Cammarota et al., 2013) and that modulating the activity of interneurons can disrupt the onset or propagation of seizure activity (Krook-Magnuson et al., 2013; Ledri et al., 2014). Our results extend these previous findings and support the view that dynamic network and ionic mechanisms underlie the different phases of seizure activity (Krishnan and Bazhenov, 2011). This has implications for efforts to disrupt epileptic seizure activity and the design of intervention strategies that could respond to the dynamic nature of seizing circuits. The benefits of manipulating interneuron populations may differ depending on the timing of the manipulation relative to the seizure phase and seizure type, as well as the duration of the manipulation and the intrinsic properties of specific cell types that are targeted (Ziburkus et al., 2006; Cammarota et al., 2013). Our results also provide support for research into anticonvulsant therapies that aim to enhance the Cl− extrusion capacity of neurons (Gagnon et al., 2013), particularly in the context of status epilepticus in which the transient collapse in EGABAA and transmembrane Cl− gradient is likely to be pronounced.
The ability of perisomatic-targeting interneurons to entrain hippocampal network activity through an inhibitory action of GABA has been well reported (Michelson and Wong, 1991; Cobb et al., 1995; Aradi and Maccaferri, 2004; Mann et al., 2005; Zsiros et al., 2007; Ellender et al., 2010). Early in development, when GABA is predominantly depolarizing (Ben-Ari, 2002), perisomatic-targeting interneurons have been suggested to initiate hippocampal network activity through a direct depolarizing effect (Bonifazi et al., 2009; Picardo et al., 2011). We now show that perisomatic-targeting interneurons can also have a direct excitatory and synchronizing effect in mature tissue, most likely by working in concert with an excitatory glutamatergic drive (de la Prida et al., 2006). Interestingly, multiple studies have shown an increase in structural and functional somatic inhibition in chronic epileptic conditions (Cossart et al., 2001; Wittner et al., 2001, 2005), which is likely to reflect a “protective response.” However, such changes may represent a double-edged sword: although they may help reduce the initial likelihood of an epileptic event being generated, once GABAergic signaling is subverted and begins to exhibit excitatory effects, somatic-targeting GABAergic inputs may exacerbate ongoing seizure activity to an even greater extent.
Footnotes
We thank Peter Somogyi for support and use of equipment. This work was supported by Medical Research Council Grant G0601503, and the research leading to these results has received funding from the European Research Council under the European Community Seventh Framework Programme (FP7/2007-2013), European Research Council Grant Agreement 243273. J.V.R. was supported by a Rhodes Scholarship, a National Research Foundation Innovation Postdoctoral Fellowship, and a University of Cape Town University Research Council Postdoctoral Fellowship.
The authors declare no competing financial interests.
References
- Anderson WW, Lewis DV, Swartzwelder HS, Wilson WA. Magnesium-free medium activates seizure-like events in the rat hippocampal slice. Brain Res. 1986;398:215–219. doi: 10.1016/0006-8993(86)91274-6. [DOI] [PubMed] [Google Scholar]
- Aradi I, Maccaferri G. Cell type-specific synaptic dynamics of synchronized bursting in the juvenile CA3 rat hippocampus. J Neurosci. 2004;24:9681–9692. doi: 10.1523/JNEUROSCI.2800-04.2004. [DOI] [PMC free article] [PubMed] [Google Scholar]
- Ascoli GA. Mobilizing the base of neuroscience data: the case of neuronal morphologies. Nat Rev Neurosci. 2006;7:318–324. doi: 10.1038/nrn1885. [DOI] [PubMed] [Google Scholar]
- Avoli M, D'Antuono M, Louvel J, Köhling R, Biagini G, Pumain R, D'Arcangelo G, Tancredi V. Network and pharmacological mechanisms leading to epileptiform synchronization in the limbic system in vitro. Prog Neurobiol. 2002;68:167–207. doi: 10.1016/S0301-0082(02)00077-1. [DOI] [PubMed] [Google Scholar]
- Beaumont M, Maccaferri G. Is connexin36 critical for GABAergic hypersynchronization in the hippocampus? J Physiol. 2011;589:1663–1680. doi: 10.1113/jphysiol.2010.201491. [DOI] [PMC free article] [PubMed] [Google Scholar]
- Ben-Ari Y. Excitatory actions of gaba during development: the nature of the nurture. Nat Rev Neurosci. 2002;3:728–739. doi: 10.1038/nrn920. [DOI] [PubMed] [Google Scholar]
- Berdichevsky Y, Dzhala V, Mail M, Staley KJ. Interictal spikes, seizures and ictal cell death are not necessary for post-traumatic epileptogenesis in vitro. Neurobiol Dis. 2012;45:774–785. doi: 10.1016/j.nbd.2011.11.001. [DOI] [PMC free article] [PubMed] [Google Scholar]
- Bonifazi P, Goldin M, Picardo MA, Jorquera I, Cattani A, Bianconi G, Represa A, Ben-Ari Y, Cossart R. GABAergic hub neurons orchestrate synchrony in developing hippocampal networks. Science. 2009;326:1419–1424. doi: 10.1126/science.1175509. [DOI] [PubMed] [Google Scholar]
- Cammarota M, Losi G, Chiavegato A, Zonta M, Carmignoto G. Fast spiking interneuron control of seizure propagation in a cortical slice model of focal epilepsy. J Physiol. 2013;591:807–822. doi: 10.1113/jphysiol.2012.238154. [DOI] [PMC free article] [PubMed] [Google Scholar]
- Carnevale NT, Hines ML. The NEURON book. Cambridge, UK: Cambridge UP; 2006. [Google Scholar]
- Chamberlin NL, Dingledine R. GABAergic inhibition and the induction of spontaneous epileptiform activity by low chloride and high potassium in the hippocampal slice. Brain Res. 1988;445:12–18. doi: 10.1016/0006-8993(88)91068-2. [DOI] [PubMed] [Google Scholar]
- Chow BY, Han X, Dobry AS, Qian X, Chuong AS, Li M, Henninger MA, Belfort GM, Lin Y, Monahan PE, Boyden ES. High-performance genetically targetable optical neural silencing by light-driven proton pumps. Nature. 2010;463:98–102. doi: 10.1038/nature08652. [DOI] [PMC free article] [PubMed] [Google Scholar]
- Cobb SR, Buhl EH, Halasy K, Paulsen O, Somogyi P. Synchronization of neuronal activity in hippocampus by individual GABAergic interneurons. Nature. 1995;378:75–78. doi: 10.1038/378075a0. [DOI] [PubMed] [Google Scholar]
- Cossart R, Dinocourt C, Hirsch JC, Merchan-Perez A, De Felipe J, Ben-Ari Y, Esclapez M, Bernard C. Dendritic but not somatic GABAergic inhibition is decreased in experimental epilepsy. Nat Neurosci. 2001;4:52–62. doi: 10.1038/82900. [DOI] [PubMed] [Google Scholar]
- DeFazio RA, Keros S, Quick MW, Hablitz JJ. Potassium-coupled chloride cotransport controls intracellular chloride in rat neocortical pyramidal neurons. J Neurosci. 2000;20:8069–8076. doi: 10.1523/JNEUROSCI.20-21-08069.2000. [DOI] [PMC free article] [PubMed] [Google Scholar]
- de la Prida LM, Huberfeld G, Cohen I, Miles R. Threshold behavior in the initiation of hippocampal population bursts. Neuron. 2006;49:131–142. doi: 10.1016/j.neuron.2005.10.034. [DOI] [PubMed] [Google Scholar]
- Dyhrfjeld-Johnsen J, Berdichevsky Y, Swiercz W, Sabolek H, Staley KJ. Interictal spikes precede ictal discharges in an organotypic hippocampal slice culture model of epileptogenesis. J Clin Neurophysiol. 2010;27:418–424. doi: 10.1097/WNP.0b013e3181fe0709. [DOI] [PMC free article] [PubMed] [Google Scholar]
- Ellender TJ, Nissen W, Colgin LL, Mann EO, Paulsen O. Priming of hippocampal population bursts by individual perisomatic-targeting interneurons. J Neurosci. 2010;30:5979–5991. doi: 10.1523/JNEUROSCI.3962-09.2010. [DOI] [PMC free article] [PubMed] [Google Scholar]
- Etherington LA, Frenguelli BG. Endogenous adenosine modulates epileptiform activity in rat hippocampus in a receptor subtype-dependent manner. Eur J Neurosci. 2004;19:2539–2550. doi: 10.1111/j.0953-816X.2004.03355.x. [DOI] [PubMed] [Google Scholar]
- Földy C, Lee SH, Morgan RJ, Soltesz I. Regulation of fast-spiking basket cell synapses by the chloride channel ClC-2. Nat Neurosci. 2010;13:1047–1049. doi: 10.1038/nn.2609. [DOI] [PMC free article] [PubMed] [Google Scholar]
- Fujiwara-Tsukamoto Y, Isomura Y, Nambu A, Takada M. Excitatory GABA input directly drives seizure-like rhythmic synchronization in mature hippocampal CA1 pyramidal cells. Neuroscience. 2003;119:265–275. doi: 10.1016/S0306-4522(03)00102-7. [DOI] [PubMed] [Google Scholar]
- Fujiwara-Tsukamoto Y, Isomura Y, Takada M. Comparable GABAergic mechanisms of hippocampal seizurelike activity in posttetanic and low-Mg2+ conditions. J Neurophysiol. 2006;95:2013–2019. doi: 10.1152/jn.00238.2005. [DOI] [PubMed] [Google Scholar]
- Fujiwara-Tsukamoto Y, Isomura Y, Imanishi M, Fukai T, Takada M. Distinct types of ionic modulation of GABA actions in pyramidal cells and interneurons during electrical induction of hippocampal seizure-like network activity. Eur J Neurosci. 2007;25:2713–2725. doi: 10.1111/j.1460-9568.2007.05543.x. [DOI] [PubMed] [Google Scholar]
- Fujiwara-Tsukamoto Y, Isomura Y, Imanishi M, Ninomiya T, Tsukada M, Yanagawa Y, Fukai T, Takada M. Prototypic seizure activity driven by mature hippocampal fast-spiking interneurons. J Neurosci. 2010;30:13679–13689. doi: 10.1523/JNEUROSCI.1523-10.2010. [DOI] [PMC free article] [PubMed] [Google Scholar]
- Gagnon M, Bergeron MJ, Lavertu G, Castonguay A, Tripathy S, Bonin RP, Perez-Sanchez J, Boudreau D, Wang B, Dumas L, Valade I, Bachand K, Jacob-Wagner M, Tardif C, Kianicka I, Isenring P, Attardo G, Coull JA, De Koninck Y. Chloride extrusion enhancers as novel therapeutics for neurological diseases. Nat Med. 2013;19:1524–1528. doi: 10.1038/nm.3356. [DOI] [PMC free article] [PubMed] [Google Scholar]
- Gnatkovsky V, Librizzi L, Trombin F, de Curtis M. Fast activity at seizure onset is mediated by inhibitory circuits in the entorhinal cortex in vitro. Ann Neurol. 2008;64:674–686. doi: 10.1002/ana.21519. [DOI] [PubMed] [Google Scholar]
- Gutiérrez R, Armand V, Schuchmann S, Heinemann U. Epileptiform activity induced by low Mg2+ in cultured rat hippocampal slices. Brain Res. 1999;815:294–303. doi: 10.1016/S0006-8993(98)01102-0. [DOI] [PubMed] [Google Scholar]
- Hájos N, Ellender TJ, Zemankovics R, Mann EO, Exley R, Cragg SJ, Freund TF, Paulsen O. Maintaining network activity in submerged hippocampal slices: importance of oxygen supply. Eur J Neurosci. 2009;29:319–327. doi: 10.1111/j.1460-9568.2008.06577.x. [DOI] [PMC free article] [PubMed] [Google Scholar]
- Higashima M, Kinoshita H, Yamaguchi N, Koshino Y. Activation of GABAergic function necessary for afterdischarge generation in rat hippocampal slices. Neurosci Lett. 1996;207:101–104. doi: 10.1016/0304-3940(96)12496-4. [DOI] [PubMed] [Google Scholar]
- Ilie A, Raimondo JV, Akerman CJ. Adenosine release during seizures attenuates GABAA receptor-mediated depolarization. J Neurosci. 2012;32:5321–5332. doi: 10.1523/JNEUROSCI.5412-11.2012. [DOI] [PMC free article] [PubMed] [Google Scholar]
- Isomura Y, Sugimoto M, Fujiwara-Tsukamoto Y, Yamamoto-Muraki S, Yamada J, Fukuda A. Synaptically activated Cl− accumulation responsible for depolarizing GABAergic responses in mature hippocampal neurons. J Neurophysiol. 2003;90:2752–2756. doi: 10.1152/jn.00142.2003. [DOI] [PubMed] [Google Scholar]
- Isomura Y, Fujiwara-Tsukamoto Y, Takada M. A network mechanism underlying hippocampal seizure-like synchronous oscillations. Neurosci Res. 2008;61:227–233. doi: 10.1016/j.neures.2008.04.002. [DOI] [PubMed] [Google Scholar]
- Jiruska P, de Curtis M, Jefferys JG, Schevon CA, Schiff SJ, Schindler K. Synchronization and desynchronization in epilepsy: controversies and hypotheses. J Physiol. 2013;591:787–797. doi: 10.1113/jphysiol.2012.239590. [DOI] [PMC free article] [PubMed] [Google Scholar]
- Kaila K, Lamsa K, Smirnov S, Taira T, Voipio J. Long-lasting GABA-mediated depolarization evoked by high-frequency stimulation in pyramidal neurons of rat hippocampal slice is attributable to a network-driven, bicarbonate-dependent K+ transient. J Neurosci. 1997;17:7662–7672. doi: 10.1523/JNEUROSCI.17-20-07662.1997. [DOI] [PMC free article] [PubMed] [Google Scholar]
- Klausberger T, Somogyi P. Neuronal diversity and temporal dynamics: the unity of hippocampal circuit operations. Science. 2008;321:53–57. doi: 10.1126/science.1149381. [DOI] [PMC free article] [PubMed] [Google Scholar]
- Klausberger T, Magill PJ, Márton LF, Roberts JD, Cobden PM, Buzsáki G, Somogyi P. Brain-state- and cell-type-specific firing of hippocampal interneurons in vivo. Nature. 2003;421:844–848. doi: 10.1038/nature01374. [DOI] [PubMed] [Google Scholar]
- Köhling R, Gladwell SJ, Bracci E, Vreugdenhil M, Jefferys JG. Prolonged epileptiform bursting induced by 0-Mg(2+) in rat hippocampal slices depends on gap junctional coupling. Neuroscience. 2001;105:579–587. doi: 10.1016/S0306-4522(01)00222-6. [DOI] [PubMed] [Google Scholar]
- Kramer MA, Truccolo W, Eden UT, Lepage KQ, Hochberg LR, Eskandar EN, Madsen JR, Lee JW, Maheshwari A, Halgren E, Chu CJ, Cash SS. Human seizures self-terminate across spatial scales via a critical transition. Proc Natl Acad Sci U S A. 2012;109:21116–21121. doi: 10.1073/pnas.1210047110. [DOI] [PMC free article] [PubMed] [Google Scholar]
- Krishnan GP, Bazhenov M. Ionic dynamics mediate spontaneous termination of seizures and postictal depression state. J Neurosci. 2011;31:8870–8882. doi: 10.1523/JNEUROSCI.6200-10.2011. [DOI] [PMC free article] [PubMed] [Google Scholar]
- Krook-Magnuson E, Armstrong C, Oijala M, Soltesz I. On-demand optogenetic control of spontaneous seizures in temporal lobe epilepsy. Nat Commun. 2013;4:1376. doi: 10.1038/ncomms2376. [DOI] [PMC free article] [PubMed] [Google Scholar]
- Kyrozis A, Reichling DB. Perforated-patch recording with gramicidin avoids artifactual changes in intracellular chloride concentration. J Neurosci Methods. 1995;57:27–35. doi: 10.1016/0165-0270(94)00116-X. [DOI] [PubMed] [Google Scholar]
- Ledri M, Madsen MG, Nikitidou L, Kirik D, Kokaia M. Global optogenetic activation of inhibitory interneurons during epileptiform activity. J Neurosci. 2014;34:3364–3377. doi: 10.1523/JNEUROSCI.2734-13.2014. [DOI] [PMC free article] [PubMed] [Google Scholar]
- Lillis KP, Kramer MA, Mertz J, Staley KJ, White JA. Pyramidal cells accumulate chloride at seizure onset. Neurobiol Dis. 2012;47:358–366. doi: 10.1016/j.nbd.2012.05.016. [DOI] [PMC free article] [PubMed] [Google Scholar]
- Mann EO, Suckling JM, Hajos N, Greenfield SA, Paulsen O. Perisomatic feedback inhibition underlies cholinergically induced fast network oscillations in the rat hippocampus in vitro. Neuron. 2005;45:105–117. doi: 10.1016/j.neuron.2004.12.016. [DOI] [PubMed] [Google Scholar]
- McCormick DA, Contreras D. On the cellular and network bases of epileptic seizures. Annu Rev Physiol. 2001;63:815–846. doi: 10.1146/annurev.physiol.63.1.815. [DOI] [PubMed] [Google Scholar]
- Michelson HB, Wong RK. Excitatory synaptic responses mediated by GABAA receptors in the hippocampus. Science. 1991;253:1420–1423. doi: 10.1126/science.1654594. [DOI] [PubMed] [Google Scholar]
- Miles R, Wong RK. Single neurones can initiate synchronized population discharge in the hippocampus. Nature. 1983;306:371–373. doi: 10.1038/306371a0. [DOI] [PubMed] [Google Scholar]
- Miles R, Wong RK. Inhibitory control of local excitatory circuits in the guinea-pig hippocampus. J Physiol. 1987;388:611–629. doi: 10.1113/jphysiol.1987.sp016634. [DOI] [PMC free article] [PubMed] [Google Scholar]
- Mody I, Lambert JD, Heinemann U. Low extracellular magnesium induces epileptiform activity and spreading depression in rat hippocampal slices. J Neurophysiol. 1987;57:869–888. doi: 10.1152/jn.1987.57.3.869. [DOI] [PubMed] [Google Scholar]
- Perreault P, Avoli M. 4-aminopyridine-induced epileptiform activity and a GABA-mediated long-lasting depolarization in the rat hippocampus. J Neurosci. 1992;12:104–115. doi: 10.1523/JNEUROSCI.12-01-00104.1992. [DOI] [PMC free article] [PubMed] [Google Scholar]
- Picardo MA, Guigue P, Bonifazi P, Batista-Brito R, Allene C, Ribas A, Fishell G, Baude A, Cossart R. Pioneer GABA cells comprise a subpopulation of hub neurons in the developing hippocampus. Neuron. 2011;71:695–709. doi: 10.1016/j.neuron.2011.06.018. [DOI] [PMC free article] [PubMed] [Google Scholar]
- Pouille F, Scanziani M. Routing of spike series by dynamic circuits in the hippocampus. Nature. 2004;429:717–723. doi: 10.1038/nature02615. [DOI] [PubMed] [Google Scholar]
- Raimondo JV, Markram H, Akerman CJ. Short-term ionic plasticity at GABAergic synapses. Front Synaptic Neurosci. 2012;4:5. doi: 10.3389/fnsyn.2012.00005. [DOI] [PMC free article] [PubMed] [Google Scholar]
- Raimondo JV, Joyce B, Kay L, Schlagheck T, Newey SE, Srinivas S, Akerman CJ. A genetically-encoded chloride and pH sensor for dissociating ion dynamics in the nervous system. Front Cell Neurosci. 2013;7:202. doi: 10.3389/fncel.2013.00202. [DOI] [PMC free article] [PubMed] [Google Scholar]
- Rouach N, Segal M, Koulakoff A, Giaume C, Avignone E. Carbenoxolone blockade of neuronal network activity in culture is not mediated by an action on gap junctions. J Physiol. 2003;553:729–745. doi: 10.1113/jphysiol.2003.053439. [DOI] [PMC free article] [PubMed] [Google Scholar]
- Schevon CA, Weiss SA, McKhann G, Jr, Goodman RR, Yuste R, Emerson RG, Trevelyan AJ. Evidence of an inhibitory restraint of seizure activity in humans. Nat Commun. 2012;3:1060. doi: 10.1038/ncomms2056. [DOI] [PMC free article] [PubMed] [Google Scholar]
- Schindler K, Leung H, Elger CE, Lehnertz K. Assessing seizure dynamics by analysing the correlation structure of multichannel intracranial EEG. Brain. 2007;130:65–77. doi: 10.1093/brain/awl304. [DOI] [PubMed] [Google Scholar]
- Scorza CA, Araujo BH, Leite LA, Torres LB, Otalora LF, Oliveira MS, Garrido-Sanabria ER, Cavalheiro EA. Morphological and electrophysiological properties of pyramidal-like neurons in the stratum oriens of Cornu ammonis 1 and Cornu ammonis 2 area of Proechimys. Neuroscience. 2011;177:252–268. doi: 10.1016/j.neuroscience.2010.12.054. [DOI] [PubMed] [Google Scholar]
- Somogyi P, Klausberger T. Defined types of cortical interneurone structure space and spike timing in the hippocampus. J Physiol. 2005;562:9–26. doi: 10.1113/jphysiol.2004.078915. [DOI] [PMC free article] [PubMed] [Google Scholar]
- Staley KJ, Proctor WR. Modulation of mammalian dendritic GABA(A) receptor function by the kinetics of Cl− and HCO3− transport. J Physiol. 1999;519:693–712. doi: 10.1111/j.1469-7793.1999.0693n.x. [DOI] [PMC free article] [PubMed] [Google Scholar]
- Staley KJ, Soldo BL, Proctor WR. Ionic mechanisms of neuronal excitation by inhibitory GABAA receptors. Science. 1995;269:977–981. doi: 10.1126/science.7638623. [DOI] [PubMed] [Google Scholar]
- Stoppini L, Buchs PA, Muller D. A simple method for organotypic cultures of nervous tissue. J Neurosci Methods. 1991;37:173–182. doi: 10.1016/0165-0270(91)90128-M. [DOI] [PubMed] [Google Scholar]
- Thompson SM, Gähwiler BH. Activity-dependent disinhibition. II. Effects of extracellular potassium, furosemide, and membrane potential on ECl- in hippocampal CA3 neurons. J Neurophysiol. 1989;61:512–523. doi: 10.1152/jn.1989.61.3.512. [DOI] [PubMed] [Google Scholar]
- Timofeev I, Grenier F, Steriade M. The role of chloride-dependent inhibition and the activity of fast-spiking neurons during cortical spike-wave electrographic seizures. Neuroscience. 2002;114:1115–1132. doi: 10.1016/S0306-4522(02)00300-7. [DOI] [PubMed] [Google Scholar]
- Trevelyan AJ, Sussillo D, Watson BO, Yuste R. Modular propagation of epileptiform activity: evidence for an inhibitory veto in neocortex. J Neurosci. 2006;26:12447–12455. doi: 10.1523/JNEUROSCI.2787-06.2006. [DOI] [PMC free article] [PubMed] [Google Scholar]
- Trevelyan AJ, Baldeweg T, van Drongelen W, Yuste R, Whittington M. The source of afterdischarge activity in neocortical tonic-clonic epilepsy. J Neurosci. 2007a;27:13513–13519. doi: 10.1523/JNEUROSCI.3005-07.2007. [DOI] [PMC free article] [PubMed] [Google Scholar]
- Trevelyan AJ, Sussillo D, Yuste R. Feedforward inhibition contributes to the control of epileptiform propagation speed. J Neurosci. 2007b;27:3383–3387. doi: 10.1523/JNEUROSCI.0145-07.2007. [DOI] [PMC free article] [PubMed] [Google Scholar]
- Viitanen T, Ruusuvuori E, Kaila K, Voipio J. The K+-Cl cotransporter KCC2 promotes GABAergic excitation in the mature rat hippocampus. J Physiol. 2010;588:1527–1540. doi: 10.1113/jphysiol.2009.181826. [DOI] [PMC free article] [PubMed] [Google Scholar]
- Wittner L, Maglóczky Z, Borhegyi Z, Halász P, Tóth S, Eross L, Szabó Z, Freund TF. Preservation of perisomatic inhibitory input of granule cells in the epileptic human dentate gyrus. Neuroscience. 2001;108:587–600. doi: 10.1016/S0306-4522(01)00446-8. [DOI] [PubMed] [Google Scholar]
- Wittner L, Eross L, Czirják S, Halász P, Freund TF, Maglóczky Z. Surviving CA1 pyramidal cells receive intact perisomatic inhibitory input in the human epileptic hippocampus. Brain. 2005;128:138–152. doi: 10.1093/brain/awh339. [DOI] [PubMed] [Google Scholar]
- Yamamoto C, Kawai N. Seizure discharges evoked in vitro in thin section from guinea pig hippocampus. Science. 1967;155:341–342. doi: 10.1126/science.155.3760.341. [DOI] [PubMed] [Google Scholar]
- Zhang F, Wang LP, Boyden ES, Deisseroth K. Channelrhodopsin-2 and optical control of excitable cells. Nat Methods. 2006;3:785–792. doi: 10.1038/nmeth936. [DOI] [PubMed] [Google Scholar]
- Zhang ZJ, Koifman J, Shin DS, Ye H, Florez CM, Zhang L, Valiante TA, Carlen PL. Transition to seizure: ictal discharge is preceded by exhausted presynaptic GABA release in the hippocampal CA3 region. J Neurosci. 2012;32:2499–2512. doi: 10.1523/JNEUROSCI.4247-11.2012. [DOI] [PMC free article] [PubMed] [Google Scholar]
- Ziburkus J, Cressman JR, Barreto E, Schiff SJ. Interneuron and pyramidal cell interplay during in vitro seizure-like events. J Neurophysiol. 2006;95:3948–3954. doi: 10.1152/jn.01378.2005. [DOI] [PMC free article] [PubMed] [Google Scholar]
- Zsiros V, Aradi I, Maccaferri G. Propagation of postsynaptic currents and potentials via gap junctions in GABAergic networks of the rat hippocampus. J Physiol. 2007;578:527–544. doi: 10.1113/jphysiol.2006.123463. [DOI] [PMC free article] [PubMed] [Google Scholar]