

Abstract
The mechanisms that specify photoreceptor cell-fate determination, especially as regards to short-wave-sensitive (S) versus medium-wave-sensitive (M) cone identity, and maintain their nature and function, are not fully understood. Here we report the importance of general transcription factor II-I repeat domain-containing protein 1 (GTF2IRD1) in maintaining M cone cell identity and function as well as rod function. In the mouse, GTF2IRD1 is expressed in cell-fate determined photoreceptors at postnatal day 10. GTF2IRD1 binds to enhancer and promoter regions in the mouse rhodopsin, M- and S-opsin genes, but regulates their expression differentially. Through interaction with the transcription factors CRX and thyroid hormone receptor β 2, it enhances M-opsin expression, whereas it suppresses S-opsin expression; and with CRX and NRL, it enhances rhodopsin expression. In an apparent paradox, although GTF2IRD1 is widely expressed in multiple cell types across the retina, knock-out of GTF2IRD1 alters the retinal expression of only a limited number of annotated genes. Interestingly, however, the null mutation leads to altered topology of cone opsin expression in the retina, with aberrant S-opsin overexpression and M-opsin underexpression in M cones. Gtf2ird1-null mice also demonstrate abnormal M cone and rod electrophysiological responses. These findings suggest an important role for GTF2IRD1 in regulating the level and topology of rod and cone gene expression, and in maintaining normal retinal function.
Keywords: gene expression, opsin, photoreceptor, retina, transcription factor
Introduction
Cone and rod photoreceptors are essential for color and high acuity vision, and dim light (scotopic) vision, respectively (Nathans, 1999). Whereas most mammalian species, including mice, possess two cone subtypes, which express either short-wave-sensitive (S) or medium-wave-sensitive (M) opsin, some primates, including humans, are trichromatic, due to the presence of long-wave-sensitive (L) opsin-expressing cones, as well as S- and M-opsin cones. Both the nature of opsin expression per cone and the pattern in which cone cells are distributed across the retina vary in different species. In mice, for example, M and S cones exhibit a distribution gradient along the dorsal–ventral axis in mutually opposing directions: M cones are dominant in the dorsal retina, whereas S cones are dominant in the ventral retina (Applebury et al., 2000). In addition, except for the far dorsal and ventral areas of the retina, a majority of mouse cones express both M- and S-opsins (Applebury et al., 2000). On the other hand, rods, which express rhodopsin, are uniformly distributed across the mouse retina.
Photoreceptor cell-type specification and their topology are regulated, in part, by expression of unique combinations of transcription factors (Swaroop et al., 2010). Whereas CRX, which is expressed in both rods and cones, positively regulates expression of all opsin subtypes (Chen et al., 1997; Furukawa et al., 1999; Peng et al., 2005), NRL and NR2E3 regulate rod-specific genes in photoreceptor precursors that become committed to and eventually mature into rods (Corbo and Cepko, 2005; Peng et al., 2005; Oh et al., 2007). Differential transcription factor expression also contributes to cone-subtype specification and topology. Thyroid hormone receptor β2 (TRβ2) preferentially determines M cone specification (Ng et al., 2001) and distribution in cooperation with its ligand (Roberts et al., 2006). Dimerization of TRβ2 and retinoid X receptor gamma (RXRγ) is essential to keep cone precursors from being specified into S cones (Roberts et al., 2005). A recent study shows that PIAS3 plays an important role in cone cell-fate specification by modulating the functions of these transcription factors (Onishi et al., 2010). The chicken ovalbumin upstream promoter transcription factors (COUP-TFI and II) are additional factors involved in the regulation of cone distribution along the dorsal–ventral axis (Satoh et al., 2009). Interestingly, the expression level of TRβ2 is drastically reduced by the time M cones start expressing M-opsin (Ng et al., 2001, 2009). This raises the possibility that one or more additional transcription factors may play a role in regulating cone opsin gene expression in mature cones.
Here, we report that general transcription factor II-I repeat domain-containing 1 protein (GTF2IRD1), a TFII-I family member, interacts with the enhancer and promoter regions of the rod and cone opsin genes, regulates the topology of cone opsin expression and is critically important for normal rod and M cone function in the mouse retina. Together, these findings suggest an important role for GTF2IRD1 in retinal gene expression and function.
Materials and Methods
Animals.
Wild-type (WT) C57BL/6J and B6CBAF1/J mice were purchased from The Jackson Laboratory. Nrl knock-out (Mears et al., 2001) and Gtf2ird1Tg(Alb1-Myc)166.8Sst-null (Gtf2ird1-null) mice (Durkin et al., 2001; Tassabehji et al., 2005; B6CBAF1/J background) were described previously. Age-matched wild-type control mice for Gtf2ird1-null mice were obtained by crossing mice on a B6CBAF1/J background. Because both Gtf2ird1-null and its age-matched wild-type mice were partially on a CBA/J background, we genotyped progeny to eliminate mice carrying the Pde6brd1 mutation from analysis. Mice of either sex were used in this study.
Yeast-one-hybrid screening.
A cDNA library in pGADT7 (Clontech) containing 3 million independent clones was prepared from the Nrl knock-out mouse retinas harvested from postnatal day (P)0 and 2-month-old animals. As bait, a 123 bp oligonucleotide sequence consisting of three tandem repeats from the mouse locus control region (LCR; Fig. 1B) was ligated into pHISi and pLacZi, and integrated into YM4271 yeast cells to generate a dual reporter yeast strain. Transformed yeast colonies were screened for histidine prototrophs and BGal activity (Chen and Zack, 2000). Plasmids encoding CRX were identified by PCR (Table 1), otherwise library inserts were identified by DNA sequencing.
Figure 1.

Putative GTF2IRD1 binding site in the LCR of Opn1mw is highly conserved among mammalian species. A, The LCR for the mouse Opn1mw is located 3.9 kb upstream of its transcription start site. The bar graph represents conserved (positive scores) and faster-evolved (negative scores) regions. The blackscale density plot displayed below represents the conserved region between the mouse and each animal based on pairwise alignment. The conservation and density plots are displayed as shown in the UCSC genome database. B, The LCR nucleotide sequence of the selected mammalian species. The bait sequence used for the YOH screen is underlined. Putative GTF2IRD1 and CRX binding motifs are boxed. Asterisks (*) represent conserved nucleotides among the indicated species.
Table 1.
List of PCR primers used in this study
| Gene | Use | Forward (5′–3′) | Reverse (5′–3′) | Size (bp) or Region |
|---|---|---|---|---|
| Gtf2ird1 | qPCR | AAGAGAAAGAGGGTCTCTGAAGGC | CGTTTAGTCCGGAATAGTCCACCA | 148 |
| Gtf2ird1 | In situ probe | CGCAAGGACGAACTCATCAA | GAACATCAAACACTTCCTCTACC | 340 |
| Opn1mw | qPCR | ACTCAGCATCATCGTGCTCTGCTA | AGTATGCGAAGACCATCACCACCA | 140 |
| Opn1sw | qPCR | CTTTGGTCGCCATGTTTGTGCTCT | TGCTGCCGAAGGGTTTACAGATGA | 125 |
| Rho | qPCR | TCACGCTATCATGGGTGTGGTCTT | AGGAATGGTGAAGTGGACCACGAA | 193 |
| Arr3 | qPCR | TTCAGATGGTTGCTAACCTGCCCT | AACTGCACTTTCCGTACAACCAGC | 169 |
| Chx10 | qPCR | TTCAATGAAGCCCACTACCC | GTCAGGCCCAGATACAGTCC | 486 |
| Crx | qPCR | GATGTGTATGCACGTGAGGAGGTT | CCCTACGATTCTTGAACCAGACCT | 82 |
| Crx | Normal PCR for YOH | GAGGTTCCTAGGGTTAGATTGAGG | CTCTTCCAGAAGTCCTAGGTTC | 685 |
| Cux2 | qPCR | CTCTCCTTCCAACTCAACCTC | CTCGGGTCAAAGTCAGGATC | 122 |
| Dnahc7b | qPCR | TCCGCTTCTACATCACAACC | TTCCCTTGCCACTACGATTC | 137 |
| Ercc5 | qPCR | ATGAAGACCGATGAATCCCTG | ACTGCTCTGTTTAGCCTATGAC | 146 |
| Gnat1 | qPCR | ACATGCGACGTGATGTGAAGGAGA | TCAGGGCAAGAGACACACCTGAAT | 167 |
| Gnat2 | qPCR | ATGTTTGATGTGGGAGGGCAGAGA | CCGCAAAGAACTTGTGGTTGCAGA | 190 |
| Haus8 | qPCR | TTCTCCGGCAGAAACATCAG | GCCCAGTGTCATGTATTCCTC | 113 |
| Hdac2 | qPCR | ATATGGCTGTCAATTGGGCTGGAG | ACGGTCATCACGCGATCTGTTGTA | 199 |
| Nr2e3 | qPCR | CATCCATGAGACATCTGCTCG | AGCTCATTCCATGCCTCTTC | 123 |
| Nrl | qPCR | TGCCTCCTTCACCCACCTTCA | GCACAGACATCGAGACCAGC | 288 |
| Pdc | qPCR | GACCTAGAGCAGACCAACATG | CAGGCCCATATTTAGTGTTTGC | 147 |
| Ppara | qPCR | GTACTGCCGTTTTCACAAGTG | TCTTTCAGGTCGTGTTCACAG | 129 |
| Stat3 | qPCR | CCAACGACCTGCAGCAATACCATT | AGCTTCTGGTTTCAGCTCCTCACA | 190 |
| Opn1mw | ChIP | CTCAGTTTTGCCCTGCCTG | TCTCTCCTCCTTCACCCTTTAC | LCR |
| ChIP | TGAGCCACCCCTGTGGATTG | GGAACCTGTCAGACTTGGCAC | PR | |
| ChIP | CAGAGACCATTATTGCCAGCAC | TGAACACCATTTGTGAACCCC | Int 2 | |
| ChIP | TTCGGGTGAATGGCACTTC | ATTGGGCTTGGGACTTTGG | 3′ end | |
| Opn1sw | ChIP | CCAGCCTGATTTCTCTTACACC | TGCTTCTCCCAGACTATGTGAG | Ups |
| ChIP | CACTCATCCTCTTCCTGTTTCC | GGTCAGTATTGGTTTCTGTGGC | PR | |
| ChIP | GGTCCTGGCTACTTGGATTATTG | GAGAACTGGAAGAATGGGCTTAG | Int 2 | |
| ChIP | TTACACCTGCTGCTCCTGG | CCCTCACACTTAGTCCTTTGC | 3′ end | |
| Rho | ChIP | CCAGGGTCAGAATCAGAACC | GCAGGTGTCTTGTTTGGGAAC | RER |
| ChIP | GGGGCAGACAAGATGAGACAC | TTCGTAGACAGAGACCAAGGC | PR | |
| ChIP | TGGGCGTGTGTTCTCTTCC | CCTGCTCATACCTCCTTGACTG | Int 2–3 | |
| ChIP | CTGTGGCTTGAAAGTAGGAGTC | GGTCTTGGTGGATGGATGTC | 3′ end |
Immunohistochemistry.
Eyes (P10, P21, and 2 months) and whole heads (P1, P2, and P4) were fixed with 1% paraformaldehyde (PFA) in 0.1 m PB at room temperature (RT) for 1 h. Eyecups were then prepared from the P10, P21, and 2-month-old eyes, cryoprotected in increasing concentrations of sucrose from 5% to 20% in 0.1 m PB, embedded in a 20% sucrose/OCT compound (Sakura Finetek USA) mix at 2:1, and then quick frozen. Retinal sections (12 μm) were cut and placed on Superfrost slides, preincubated in 10% horse serum for 1 h at RT, and then incubated with primary antibodies in 3% horse serum overnight at 4°C. After incubation with secondary antibodies (30 min at RT), sections were mounted with Vectashield Mounting Medium with DAPI (Vector Laboratories). Flat-mount immunostaining was performed for the 4 M mouse retina. After fixation of the eye with 1% PFA for 1 h at RT, retinas were carefully dissected from the eyecups. Retinas were preincubated in PBS containing 10% horse serum and 0.3% Triton X-100 for 1 h at RT, and then incubated with primary antibodies in PBS containing 3% horse serum and 0.1% Triton X-100 for 2 d at 4°C. After immunoreacting with secondary antibody in PBS containing 0.1% Triton X-100 for 1 d at 4°C, retinas were flattened and mounted with Vectashield Mounting Medium (Vector Laboratories). Images were taken on an LSM 510 Meta laser-scanning microscope (Carl Zeiss). Antibodies used are shown in Table 2.
Table 2.
List of antibodies used in this study
| Antibody | Source |
Host | Dilution |
||||
|---|---|---|---|---|---|---|---|
| (Catalog #) | IHC | Western | Chip | Co-IP | Flatmount | ||
| GTF2IRD1 | Abcam (ab64805) | Rabbit | 1:100 | 1:500 | — | 1:500 | — |
| GTF2IRD1 | Santa Cruz Biotechnology (SC14714X) | Goat | — | — | 4 μg | — | — |
| CRX | Proteintech Group (12047-1-AP) | Rabbit | — | — | — | 4 μl | — |
| CRX | Abnova (H00001406-M02) | Mouse | — | — | 4 μg | — | — |
| M-opsin | Gift from J. Nathans | Rabbit | — | — | — | — | 1:5000 |
| S-opsin | Santa Cruz Biotechnology (sc-14363) | Goat | — | — | — | — | 1:500 |
| RORa | Santa Cruz Biotechnology (sc-6062) | Goat | 1:1000 | — | — | — | — |
| AlexaFluor 488 anti-rabbit IgG | Invitrogen (A21206) | Donkey | 1:500 | — | — | — | 1:500 |
| AlexaFluor 594 anti-goat IgG | Invitrogen (A11058) | Donkey | 1:500 | — | — | — | 1:500 |
| Anti-rabbit IgG, HRP | GE Healthcare (NA934) | Donkey | — | 1:2000 | — | — | — |
Quantitative analysis of signal intensity of S-opsin-immunopositive cells.
Flat-mount images were analyzed with a custom algorithm created using the Cellomics NeuronalProfiling (Thermo Fisher Scientific) image-analysis software package. With this algorithm, we identified all cells using the merged M- and S-opsin-stained images. Then, based on an intensity threshold, cells were characterized as either M-opsin single-positive, S-opsin single-positive, or M- and S-opsin double-positive. The relative intensities of the S-opsin staining were determined for each population.
In situ hybridization.
Two-month-old C57BL/6J mouse eyes were fixed with 4% PFA in 0.1 m PB for 2 h at 4°C. Retinal sections were prepared as described (see Immunohistochemistry). Linearized plasmids containing cloned cDNA fragments of Gtf2ird1 were used to produce antisense-digoxigenin-labeled riboprobes by reverse transcription with T7 polymerase. In situ hybridization was performed as previously described (Yang et al., 2007).
LCM.
Sample preparation and the dissection of the retinal layers [ganglion cell layer (GCL), inner nuclear layer (INL), outer nuclear layer (ONL)] by laser capture microdissection (LCM) from 2-month-old C57BL/6J mouse retina were performed as described previously (Hackler et al., 2012).
Western blotting.
Nuclear and cytoplasmic extracts were prepared using NE-PER Nuclear and Cytoplasmic Reagents (Thermo Fisher Scientific). Following electrophoresis, proteins were transferred to PVDF membranes using an iBlot Dry Blotting System (Invitrogen). After preincubation in SuperBlock T20 PBS Blocking Buffer (Thermo Fisher Scientific) at RT for 1 h and incubation with anti-GTF2IRD1 antibody at 1:500 in SuperBlock T20 PBS Blocking Buffer at 4°C overnight, membranes were incubated with HRP-conjugated anti-rabbit IgG at 1:2000 in PBS at RT for 1 h. GTF2IRD1 signal was detected with SuperSignal West Pico Chemiluminescenct Substrate (Thermo Fisher Scientific).
ChIP.
Chromatin immunoprecipitation (ChIP) assay was performed using six pooled P14 C57BL/6J mouse retinas as previously described (Peng et al., 2005). Immunoprecipitation was performed using goat anti-GTF2IRD1 antibody or normal goat IgG as a negative control. Input (chromatin samples without immunoprecipitation) served as the positive control. The immunoprecipitated chromatin DNA was analyzed by quantitative PCR (qPCR) using specific primers designed for the indicated opsin gene regulatory regions (see Fig. 3A,D,G). The amount of DNA amplified by qPCR from ChIP samples was first normalized to that from the IgG negative control. Then the relative enrichment of genomic regions was expressed as a ratio of the amount of the normalized DNA to the amount of the input DNA. PCR primers and antibody are shown in Tables 1 and 2.
Figure 3.
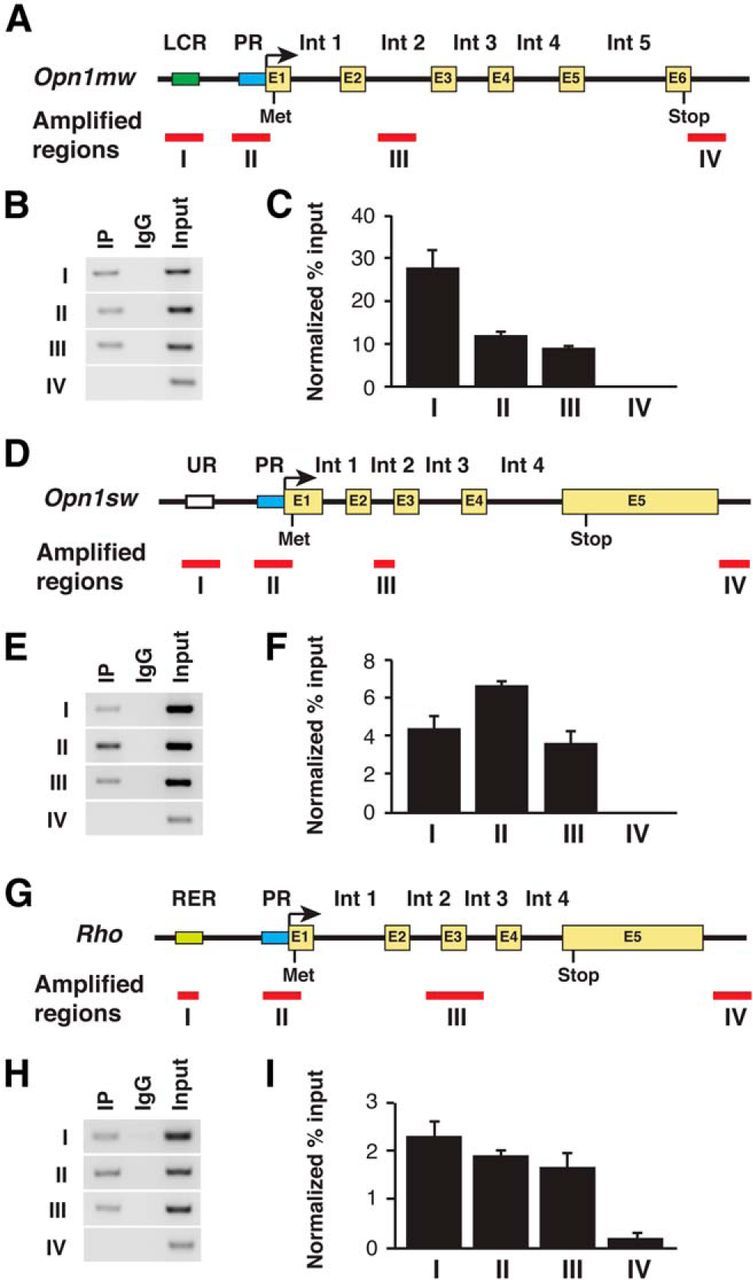
GTF2IRD1 interacts with the regulatory regions of the mouse opsin genes. A, D, G, Schematic diagrams of cone opsin loci for Opn1mw (A), Opn1sw (D), and Rho (G). Bars represent regions assayed for GTF2IRD1 binding by qPCR. B, E, H, Gel images of PCR products at the indicated regions for Opn1mw (B), Opn1sw (E), and Rho (H). IP-labeled samples are those immunoprecipitated with antibody against GTF2IRD1. C, F, I, Relative enrichment of immunoprecipitated DNA fragments at the indicated regions of Opn1mw (C), Opn1sw (F), and Rho (I). All data are represented as mean ± SE (n = 3).
In vitro coimmunoprecipitation.
Recombinant GTF2IRD1 and CRX proteins with or without 35S-labeling were generated using the in vitro translation kit and coimmunoprecipitation protocol as previously described (Peng et al., 2005). The antibodies used for the assay are shown in Table 2.
Transient transfection assay.
For the construction of the human L-opsin reporters, intact and modified human OPN1LW upstream regions excised from pR6.5, pR5.8, and pR2.1 vectors (Wang et al., 1992; gifts from Dr J. Nathans, Johns Hopkins University, Baltimore, MD) were ligated into the pGL3-basic vector (Promega). They are designated here as +LCR, −LCR, LCR+Prox, and Prox (see Fig. 4A). These reporters include −4997 to +33 (+LCR), −4997 to −3691 and −3098 to +33 (−LCR), −4246 to −2984 and −461 to +33 (LCR+Prox), and −461 to +33 (Prox) bp fragments of the OPN1LW upstream region relative to the transcription start site. HEK293 cells in a 24-well format were cotransfected with 10 ng of the human L-opsin reporter plasmid, 100–400 ng of the expression plasmids encoding GTF2IRD1, CRX, and TRβ2 by Lipofectamine 2000 (Invitrogen). The total amount of transfected DNA was adjusted to 500 ng by adding an appropriate amount of empty pcDNA3.1 vector. Two days after the transfection, cells were lysed and luciferase activity of each condition was analyzed (Luciferase Reporter Assay System, Promega). For assay of rhodopsin promoter activity, the bovine rhodopsin (Rho) promoter fragment (−321 to −27 bp relative to the transcription start site) was ligated into the pGL3-basic vector. Ten nanograms of the Rho reporter was cotransfected with 100–400 ng of expression plasmids encoding GTF2IRD1, CRX, and NRL. The total amount of transfected DNA was adjusted to 500 ng by adding an appropriate amount of empty pcDNA3.1 vector. The transfection and assay analysis were performed as described above in the L-opsin reporter assay. For assay of S-opsin promoter activity, a human OPN1SW promoter fragment (−557 to −1 bp relative to the transcription start site) was ligated into the pGLuc-basic vector (New England Biolabs). One hundred nanograms of S-opsin reporter was cotransfected with 100–400 ng of expression plasmids encoding GTF2IRD1, CRX, RORα, and RORβ by Lipofectamine 2000. Total amount of the transfected DNA was adjusted to 600 ng by adding empty pcDNA3.1 vector. Sample medium was collected 2 d after the transfection and Gaussia lucifease activity was analyzed (BioLux Gaussia Luciferase Flex Assay Kit, New England Biolabs). Assays were performed at least three independent times in triplicate. Expression plasmids are shown in Table 3.
Figure 4.

GTF2IDR1 regulates opsin promoter activities. A, Schematic diagram of luciferase reporter constructs with human OPN1LW upstream regions. The numbers represent length (bp) of each DNA fragment. B, Transient cotransfection assay with the OPN1LW reporters. HEK293 cells were cotransfected with 10 ng of the indicated luciferase reporter plasmid along with the indicated expression plasmids. “+,” “++,” “+++,” and “++++” represent 100, 200, 300, and 400 ng, respectively, of the indicated plasmid, whereas “−” represents 0–500 ng of the empty plasmid to keep the total amount of DNA constant. Student's t test was performed to examine whether cotransfection of GTF2IRD1 with CRX and/or TRβ2 leads to a statistically significant increase of the reporter activity in comparison with the indicated control for each construct. All data are represented as mean ± SE; *p < 0.01 (n = 9–12). C, Transient cotransfection assay with the OPN1SW reporter. HEK293 cells were cotransfected with 100 ng of the indicated luciferase reporter plasmid along with the indicated expression plasmids. “+,” “++,” and “+++” represent 100, 300, and 400 ng, respectively, of the indicated plasmid, whereas “−” represents 0–500 ng of the empty plasmid to keep the total amount of DNA constant. All data are represented as mean ± SE; *p < 0.05, **p < 0.01 (n = 9). D, Transient cotransfection assay with the RHO reporter. HEK293 cells were cotransfected with 100 ng of the indicated luciferase reporter plasmid along with the indicated expression plasmids. “+,” “++,” and “+++” represent 100, 300, and 400 ng, respectively, of the indicated plasmid, whereas “−” represents 0–500 ng of the empty plasmid to keep the total amount of DNA constant. All data are represented as mean ± SE; *p < 0.05, **p < 0.01 (n = 9). E, IP assays using the indicated antibodies (lanes 3–6) and in vitro translated proteins with (*) or without 35S-labeling. Lanes 1 and 2 are input controls without immunoprecipitation for GTF2IRD1 and CRX proteins. Minus sign (−) indicates empty vector.
Table 3.
List of expression plasmids used in this study
| Gene | Species of the gene | Promoter | Source (clone ID) |
|---|---|---|---|
| GTF2IRD1 | Human | CMV | Invitrogen Ultimate ORF (IOH10904) |
| CRX | Human | CAG | Gift from S. Blackshaw (Johns Hopkins University, Baltimore, MD) |
| CRX | Human | CMV | Peng et al. (2005) |
| NRL | Mouse | CAG | Gift from S. Blackshaw |
| RORa | Human | CAG | Invitrogen Ultimate ORF (IOH43547) |
| RORb | Human | CAG | Gift from S. Blackshaw |
| TRb2 | Mouse | SV40 | Gift from D. Forrest (NIH, Bethesda, MD) |
Primary cell culture and siRNA transfection.
Retinas dissected from P10 mice were gently dissociated in papain solution (16.5 U/ml Hanks balanced salt solution). After centrifugation, cells were dissociated in the growth medium (neurobasal medium; Invitrogen), 1× B27 serum-free supplement (Invitrogen), 2 mm l-glutamate), and seeded on a 96-well plate at 200,000 cells/well. Cells were incubated overnight in a CO2 incubator at 37°C before transfection. A pool of four Gtf2ird1 Accell siRNAs (Thermo Fisher Scientific, Catalog #E-050113-00-0005), Accell Nontargeting Control Pool (Thermo Fisher Scientific, Catalog #D-001910-10), or 1× siRNA buffer (Thermo Fisher Scientific) without siRNA, was added to the growth medium at the concentration of 1 μm. Following transfection, cells were then incubated for 72 h and collected for qPCR to assess the effect of gene silencing on mRNA levels. The assay was performed at least three independent times with three to six replicates. Although the assay was performed for both the WT (C57BL/6J) and the Nrl knock-out mouse retinas, the results are shown only for the WT retinas.
RNA extraction and qPCR.
Total RNAs were extracted by RNeasy Mini kit or RNeasy Micro kit (Quiagen), and cDNA was synthesized using superscript III polymerase (Invitogen) with random hexamers. PCR data were analyzed with the Bio-Rad iQ5 Standard Edition v2.1 program. The expression levels of target genes were independently normalized to the expression levels of the “housekeeping” genes Gapdh and cyclophilin A, and then these normalized values were averaged. The relative gene expression level was then calculated as (1) the ratio of this normalized expression level in the INL and ONL relative to that in the GCL (Fig. 2H), (2) the ratio of cells treated with Gtf2ird1 Accell siRNA or 1× siRNA buffer (untreated) relative to that of cells treated with Accell Nontargeting Control Pool (control siRNA; see Fig. 5), and (3) the ratio of expression in the Gtf2ird1-null mouse retina relative to the WT retina (see Fig. 6). PCR primers used are shown in Table 1.
Figure 2.

Developmental expression of GTF2IRD1 begins in photoreceptors after photoreceptor cell-fates are determined. A–E, GTF2IRD1 immunostaining of C57BL/6J mouse retinas at P1 (A), P4 (B), P10 (C), P21 (D), and 2 months (E, green). Nuclei were counter-stained with DAPI (blue). Scale bars, 50 μm. F, Double-immunostaining of the 2-month-old C57BL/6J mouse retina with antibodies to GTF2IRD1 (green) and RORα (magenta). Arrows indicate cones stained with antibodies to both GTF2IRD1 and RORα. Scale bar, 50 μm. G, In situ hybridization of Gtf2ird1 in the 2-month-old C57BL/6J mouse retina. Gtf2ird1 is expressed in all three layers in the retina. Scale bar, 100 μm. H, Relative Gtf2ird1 expression in the three retinal layers of 2-month-old C57BL/6J mice. qPCR was performed with cDNA samples isolated from the three retinal layers obtained by LCM. For each sample, Gtf2ird1 expression levels were normalized to those of Gapdh and cyclophilin A, calculated independently, and then these values were averaged. The relative Gtf2ird1 gene expression level is presented as the ratio of the normalized expression level in the INL and ONL relative to that in the GCL. Data are represented as mean ± SE. I, GTF2IRD1 is localized in the nucleus of the mouse retina. Western blotting was performed using 10 μg proteins prepared from the nuclear and cytoplasmic fractions of the 2-month-old C57BL/6J mouse retina with an antibody to GTF2IRD1. Asterisk (*) indicates the predicted molecular weight of mouse GTF2IRD1. M, Molecular weight marker; NE, nuclear extracts; CE, cytoplasmic extracts; ONBL, outer neuroblastic layer.
Figure 5.

Expression of multiple photoreceptor-enriched genes is downregulated by siRNA-mediated Gtf2ird1 knockdown. Primary cells prepared from the C57BL/6J mouse retina at P10 were transfected with Gtf2ird1 siRNA, Nontargeting Pool (control siRNA), or 1× siRNA buffer (untreated). Cells were cultured for 3 d after transfection. Gene expression level was examined by qPCR for the indicated genes. The expression level of the target genes was independently normalized to that of Gapdh and cyclophilin A, and then the average of these values was calculated. The relative gene expression level is presented as the ratio of the normalized expression level of the cells treated with the Gtf2ird1 siRNA or untreated cells relative to that of cells treated with the control siRNA. All data are represented as mean ± SE; *p < 0.05, **p < 0.005 (n = 15).
Figure 6.
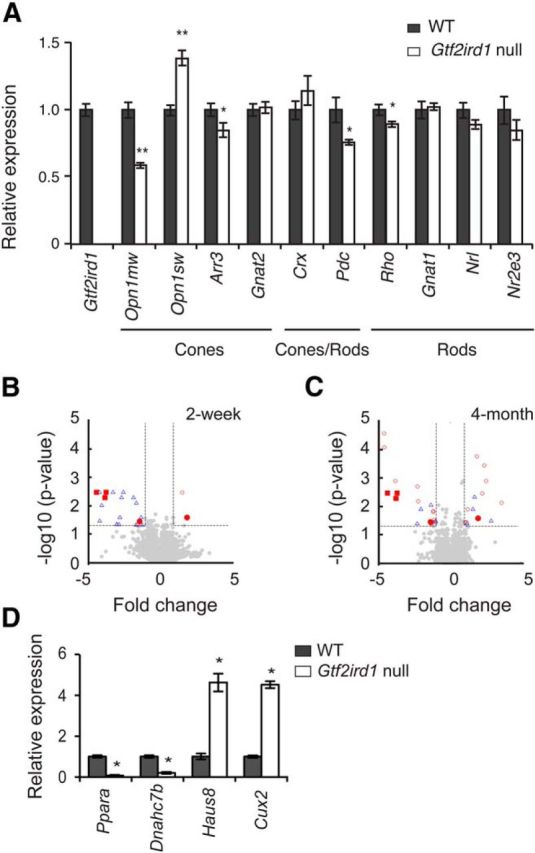
Gtf2ird1-null mice exhibit altered opsin expression patterns. A, qPCR analysis of photoreceptor-enriched genes in the retina from Gtf2ird1-null and WT mice. The expression level of target genes was normalized to that of Gapdh and cyclophilin A independently, and the mean value of these was then calculated. Relative gene expression levels are presented as the ratio of the normalized expression level in the Gtf2ird1-null mouse retina to that in the WT retina. All data are represented as mean ± SE; *p < 0.05, **p < 0.001 (n = 4). B, C, Distribution of differentially expressed transcripts in the Gtf2ird1-null and the age-matched WT retinas at 2 week (B) and 4 month (C) time points. Differentially expressed transcripts are presented as annotated transcripts at least one time point (red open circles), annotated transcripts identified at both time points (red filled circles), Gtf2ird1 transcripts (red filled squares), and unannotated transcripts (blue open triangles). Gray filled circles represent transcripts that are not differentially expressed under the cutoff criteria described in Materials and Methods. D, Representative genes that differentially expressed at the 2 week and the 4 month time points were validated by qPCR using cDNAs prepared from the retinas of 6-month-old Gtf2ird1-null (n = 5) and age-matched WT (n = 7) mice. The relative gene expression level was calculated as described in A. All data are represented as mean ± SE; *p < 0.001.
ERG recordings.
Four-month-old mice were anesthetized with ketamine (100 mg/kg) and xylazine (5 mg/kg). After dilation, a platinum loop electrode was placed on the cornea with 2.5% hypromellose. The reference and ground electrodes were placed subcutaneously under the scalp and tail, respectively. The mice were placed in a Ganzfeld bowl and stimulated by 10–20 stroboscopic light emitting diodes (LED) flashes. Signals were detected, amplified, bandpass filtered between 0.3 and 500 Hz, and analyzed by using UTAS visual electrodiagnostic system (LKC Technologies). After being exposed to 40 cd/m2 white background light for 10 min to desensitize the rod responses in the Ganzfeld bowl, the mice were applied to photopic electroretinographic (ERG) recording <40 cd/m2 white background light. White light stimulus ranging from −0.2 to 1.8 log cd-s/m2 was presented to elicit cone responses. To elicit M cone and S cone responses individually, we performed photopic ERGs with monochromatic stimuli ranging from 0.4 to 1.8 and −1.0 to 0.4 log cd-s/m2 using LEDs of 530 and 360 nm, respectively. Seven and eight animals were used for age-matched WT and Gtf2ird1-null mice, respectively.
Microarray analysis of Gtf2ird1-null mice.
Total RNA was prepared individually from four Gtf2ird1-null mouse retinas and four age-matched WT retinas at 2 weeks and 4 months (Trizol, Invitrogen; RNeasy Mini kit, Qiagen), labeled, and hybridzed to Affymetrix Mouse Exon 1.0 arrays (Johns Hopkins Deep Sequencing and Microarray Core Facility). Partek Genomic Suite was used to normalize expression data of all extended level probe sets using the following options: GC pre-background adjustment, RMA background correction, and quantile normalization. Gene expression level was defined as the average expression level of all exons for that gene. t test was used to obtain p value and fold-change (FC) values. The final p values were modified by multiple-test correction using false discovery rate (FDR) estimation. The differentially expressed genes were detected for FDR <0.05 and |FC| >2 (linear).
Statistics.
Statistical significance was determined by a two-tailed Student's t test. For multiple comparisons, we performed two-way ANOVA. Values are expressed as means ± SE.
Results
GTF2IRD1 binds to the LCR
To identify novel transcription factors that regulate cone opsin gene expression, we focused on the LCR, an important cis-acting regulator of cone opsin expression. The LCR is an enhancer sequence that is highly conserved among mammalian species (Wang et al., 1992). The LCR physically interacts, through a loop structure, with the M-opsin promoter region to activate transcription (Peng and Chen, 2011). Despite the evolutionarily conserved importance of the LCR in coordinating the topology of cone opsin expression in vertebrates, the identity and nature of the regulatory molecules that bind to and interact with the LCR to regulate opsin expression are not well understood.
To identify proteins that bind to the LCR, we performed a yeast-one-hybrid (YOH) screen using a highly conserved region of the mouse LCR sequence as bait (Fig. 1A,B). Because we were interested in cone-expressed DNA binding proteins, and cones constitute <2% of the normal mouse retina, for the screen we used a cDNA library generated from the retinas of cone-enriched Nrl-null mice (Mears et al., 2001). Of 207 primary hits obtained from the YOH screen, the encoded DNA binding factors that were represented by two or more independent clones were as follows: Crx (114 clones), Gtf2ird1 (10 clones), orthodenticle homolog 2 (Otx2; 7 clones), and zinc finger protein 580 (4 clones). We chose to focus on GTF2IRD1 because among the identified genes it was the most commonly represented one that had not already been well studied in the retina. Of further interest, GTF2IRD1 is within the genetic interval identified for Williams-Beuren syndrome, which includes abnormalities in development, social behavior, cardiac function, and visual-spatial cognition (Donnai and Karmiloff-Smith, 2000). Additionally, a more limited deletion has implicated GTF2IRD1 in the visual-spatial cognition disorder (Dai et al., 2009), suggesting the possibility that GTF2IRD1 may play a role in the visual system.
Previous studies defined two distinct GTF2IRD1 binding motifs (Vullhorst and Buonanno, 2005; Thompson et al., 2007; Lazebnik et al., 2008). One of these motifs, 5′-(G/T/C)(G/A)GATT(G/A)-3′, is evolutionarily conserved in the LCR and is present in the DNA fragment that we used as bait for the YOH screen. Note that this sequence is also highly homologous to the CRX binding site (Chen et al., 1997; Hsiau et al., 2007), which likely explains why so many CRX encoding clones were also identified.
GTF2IRD1 expression in developing murine photoreceptors begins after photoreceptor cell-fates are determined
By immunohistochemistry, expression of GTF2IRD1 was first detected at P1, in nuclei of the GCL (Fig. 2A). By P4, GTF2IRD1 expression expanded to the inner neuroblastic layer (INBL; Fig. 2B). GTF2IRD1 expression in the GCL and in cells of the INL was maintained throughout development and in the adult retina (Fig. 2C–E). In contrast, GTF2IRD1 expression in photoreceptors begins relatively late. Immunopositive cells in the ONL, the layer that contains photoreceptor nuclei, were first observed at P10 (Fig. 2C), a few days later than the time when M-opsin mRNA expression is first detected (Fei, 2003). By P21, GTF2IRD1 expression was observed throughout the ONL, and was maintained in the adult retina (Fig. 2D,E). Confirming the immunohistochemical results, Gtf2ird1 mRNA expression in adult murine photoreceptors was detected by both in situ hybridization and qPCR analysis of LCM retinal layers (Fig. 2G,H). The qPCR result also suggests relative enrichment of Gtf2ird1 mRNA expression in photoreceptor cells (ONL) compared with expression in the INL and the GCL. These results are consistent with those obtained with mice carrying a LacZ knockin mutation of Gtf2ird1; LacZ staining was limited to the GCL in the newborn, whereas staining was observed throughout the whole retina, including rods and cones, in the adult retina (Palmer et al., 2007).
GTF2IRD1 immunostaining also identified a few cells with higher staining intensity in the outer part of the ONL where cone nuclei are located (Fig. 2D). To confirm that GTF2IRD1 is expressed in cones, we performed double-immunostaining against GTF2IRD1 and RORα (RORα is preferentially expressed in the cone nuclei in the ONL of the adult mouse retina; Fujieda et al., 2009; Onishi et al., 2010). We found that most, if not all, RORα-immunopositive cells were GTF2IRD1-immunopositive in both the dorsal and the ventral retina, indicating that GTF2IRD1 is expressed in both M and S cones (Fig. 2F). A dorsal–ventral gradient of GTF2IRD1 expression was not observed. Nuclear localization of GTF2IRD1 in retinal cells was confirmed by Western blotting of retinal nuclear extracts (Fig. 2I).
GTF2IRD1 interacts with opsin gene regulatory regions in vivo
To assess whether GTF2IRD1 interacts with the LCR in vivo, we performed ChIP assays on the Opn1mw (M-opsin) and Opn1sw (S-opsin) genes with P14 mouse retinal tissue. We found that GTF2IRD1 interacts not only with the LCR, but also, although less strongly, with promoter and intronic regions of Opn1mw (Fig. 3A–C). In addition, GTF2IRD1 interacts with the upstream, promoter, and exon/intron regions of Opn1sw (Fig. 3D–F). Because our immunohistochemistry demonstrated that GTF2IRD1 is expressed in rods, we also tested whether GTF2IRD1 interacts with the rhodopsin promoter region. We found that GTF2IRD1 interacts with the enhancer (RER), promoter, and exon/intron regions of Rho (Fig. 3G–I). These results suggest the hypothesis that GTF2IRD1 plays a role in regulating the transcription of opsin genes in both cones and rods.
GTF2IRD1 enhances OPN1LW and RHO promoter activity, suppresses OPN1SW promoter activity, and directly interacts with CRX
Given the YOH and ChIP data suggesting that GTF2IRD1 is involved in regulating opsin expression, we explored GTF2IRD1's transcriptional regulatory activity by cotransfection of promoter/luciferase reporter and transcription factor-expression constructs into HEK293 cells. We first tested GTF2IRD1's activity on human L-opsin expression because L-opsin is the closest opsin downstream of the LCR (Wang et al., 1992). GTF2IRD1 overexpression showed minimal upregulation of promoter activity with the human OPN1LW (L-opsin) 5′-upstream reporter constructs, regardless of whether they did or did not contain the LCR sequence (Fig. 4A,B). Based upon published evidence (Peng and Chen, 2011) and our above-described YOH data suggesting that CRX interacts with the LCR, we next tested whether GTF2IRD1 might demonstrate more significant L-opsin transcriptional activation upon interaction with CRX. When cotransfected with a CRX expression plasmid, GTF2IRD1 demonstrated dose-dependent and synergistic positive transactivation of L-opsin promoter activity (Fig. 4B). The ability of GTF2IRD1 to interact with other candidate transcription factors in regulating L-opsin was also tested. Because TRβ2 is an important regulator of M-opsin expression (Onishi et al., 2010), we asked whether mouse TRβ2 could modulate the ability of GTF2IRD1 and CRX to stimulate human OPN1LW promoter activity. Coexpression of GTF2IRD1 with TRβ2 enhanced L-opsin promoter activity in a dose-dependent manner. The upregulation of the promoter activity by GTF2IRD1 with TRβ2 was further enhanced in the presence of CRX (Fig. 4B).
We next explored the ability of GTF2IRD1 to modulate S-opsin promoter activity. Analogous GTF2IRD1 cotransfection assays were performed using a human OPN1SW luciferase reporter. In contrast to the results with L-opsin, GTF2IRD1 had a suppressive effect on CRX stimulated human OPN1SW reporter activity (Fig. 4C). We also tested for possible functional interactions with RORα and RORβ, based on the report that these factors enhance CRX-activated S-opsin promoter activity (Srinivas et al., 2006; Fujieda et al., 2009). Addition of GTF2IRD1 significantly suppressed S-opsin promoter activity driven both by CRX and RORα, and by CRX and RORβ. Thus, GTF2IRD1 has mutually opposing effects on L- and S-opsin, activating L-opsin expression, in combination with CRX, and repressing S-opsin expression.
Finally, we have assessed GTF2IRD1's ability to regulate rhodopsin (Rho) promoter activity (Fig. 4D). With a bovine Rho luciferase reporter, we observed minimal but significant upregulation of Rho promoter activity. Rho promoter activity was synergistically enhanced when GTF2IRD1 was cotransfected with CRX and NRL, two well characterized activators of Rho promoter activity (Chen et al., 1997).
Based upon the ability of GTF2IRD1 and CRX to functionally interact in regulating opsin expression, we used coimmunoprecipitation to test whether the two factors physically interact. 35S-labeled CRX was coimmunoprecipitated by anti-GTF2IRD1 antibody in the presence of GTF2IRD1 protein (Fig. 4E, lanes 3, 4); likewise, 35S-labeled GTF2IRD1 was coimmunoprecipitated by anti-CRX antibody in the presence of CRX protein (Fig. 4E, lanes 5, 6). These findings, together, suggest that a physical complex containing GTF2IRD1 and CRX, and perhaps other factors, is involved in meditating opsin expression.
GTF2IRD1 regulates transcription of photoreceptor-enriched genes in primary retinal cell cultures
To investigate GTF2IRD1 activity in the context of retinal cells, as opposed to in nonretinal cell lines, such as HEK293, siRNA-mediated Gtf2ird1 knockdown was performed with primary C57BL/6J murine retinal cell cultures. We chose to use cells from P10 retinas because photoreceptor cells at this developmental stage are already expressing M- and S-opsins, rhodopsin, and GTF2IRD1. Gtf2ird1 siRNA conditions were optimized, resulting in 48 ± 3% mRNA expression compared with the nontargeting controls (p < 0.001; Fig. 5). Consistent with GTF2IRD1 being a positive regulator of M-opsin and rhodopsin expression, Gtf2ird1 knockdown suppressed M-opsin and rhodopsin mRNA expression (17.6 ± 6% and 22.6 ± 13%, respectively, p < 0.001 compared with the nontargeting control siRNA). However, in contrast to the transient reporter assay result, S-opsin mRNA expression level was also significantly suppressed by Gtf2ird1 knockdown (22 ± 11%, p < 0.001 compared with the nontargeting control siRNA). To further explore GTF2IRD1's role in photoreceptor development and function, we tested the effect of GTF2IRD1 siRNA on other candidate photoreceptor-expressed genes. We found that the Gtf2ird1 knockdown induced significant suppression of several key cone-specific (Arr3 and Gnat2), rod-specific (Gnat1, Nrl, and Nr2e3), and photoreceptor-specific (Crx and Pdc) genes (p < 0.001 compared with the nontargeting control siRNA). In contrast, expression of nonphotoreceptor-enriched genes was either moderately affected (Stat3 and Chx10, p < 0.05 compared with the nontargeting control siRNA) or not affected (Hdac2 and Ercc5, p = 0.669 and p = 0.538, respectively, compared with the nontargeting control siRNA), indicating preferential and increased activity of GTF2IRD1 on the expression of photoreceptor-enriched genes.
Consistent results were obtained from the Gtf2ird1 knockdown assay with the primary Nrl knock-out mouse retinal cell cultures except that the S-opsin mRNA expression level was not significantly suppressed by Gtf2ird1 knockdown (122 ± 12%, p = 0.058 compared with the nontargeting control siRNA), even though we observed a similar degree of Gtf2ird1 knockdown (53 ± 4% compared with the nontargeting siRNA, p < 0.001) as with the WT primary cells (data not shown).
GTF2IRD1 modulates the topology of cone opsin expression across the retina
We next explored the effect of GTF2IRD1 expression on opsin expression and retinal function in vivo, using a Gtf2ird1-null mouse (Tg(Alb1-Myc)166.8) in which a c-myc transgene integration event led to an ∼40 kb deletion that includes the transcription start site and first exon of Gtf2ird1 (Durkin et al., 2001; Tassabehji et al., 2005). First, we have confirmed that Gtf2ird1 expression in the Gtf2ird1-null mouse retina is undetectable level by qPCR (Fig. 6A). Retinal whole-genome transcriptome analysis and targeted qPCR analysis of photoreceptor-enriched genes revealed relatively few retinal gene expression changes in the null mice compared with the age-matched WT controls. Consistent with the above-described transient transfection and siRNA studies, qPCR demonstrated decreased M-opsin (p < 0.001) and rhodopsin expression (p < 0.05; Fig. 6A). QPCR also demonstrated increased S-opsin expression (p < 0.001), which is consistent with the transient transfection study. Also consistent with our siRNA results (Fig. 5), the Gtf2ird1-null mice demonstrated decreased expression of Arr3 and Pdc (p < 0.05). Exon microarray analysis identified 22 transcripts (representing 12 genes) and 23 transcripts (representing 21 genes) that were differentially expressed at 2 weeks and 4 months, respectively (FDR <5% and differential expression level twofold or higher; Fig. 6B,C; Table 4). Only 4 of 12 differentially expressed genes identified at 2 weeks and 14 of 21 genes identified at 4 months represent annotated genes (most represent unannotated RIKEN sequences). Differential expression of representative genes from the 2 weeks and 4 month time points were tested and validated by qPCR analysis using cDNAs prepared from the retinas of 6-month-old mice (Fig. 6D). Gene ontology terms of the differentially expressed genes did not reveal any specifically enriched categories. Among the genes showing the highest degree of differential expression, a potentially interesting one was cut-like homeobox 2 (Cux2), which is involved in dendrito- and synapto-genesis (Cubelos et al., 2010).
Table 4.
List of genes differentially expressed in the Gtf2ird1-null mouse retina at 2 weeks and 4 months
| DEG (FDR < 0.05% |FC| > log2(2)) | GE |
2W |
4M |
DEG signal* |
||||||
|---|---|---|---|---|---|---|---|---|---|---|
| 2W_Gtf2ird1-null | 2W_WT | 4M_Gtf2ird1-null | 4M_WT | FC | p_FDR | FC | p_FDR | 2W | 4M | |
| /Rplp0/ | 11.26 | 9.65 | 9.99 | 9.61 | 1.61 | 0.00 | 0.38 | 0.62 | 1 | 0 |
| /LOC434166/ | 6.31 | 10.54 | 7.53 | 8.39 | −4.24 | 0.00 | −0.86 | 0.92 | −1 | 0 |
| /Gtf2ird1/ | 4.71 | 9.16 | 4.71 | 9.38 | −4.45 | 0.00 | −4.68 | 0.00 | −1 | −1 |
| /Gtf2ird1/ | 5.02 | 8.78 | 5.06 | 8.95 | −3.76 | 0.00 | −3.90 | 0.00 | −1 | −1 |
| /LOC433762/ | 7.02 | 9.56 | 7.06 | 9.37 | −2.53 | 0.00 | −2.31 | 0.20 | −1 | 0 |
| /LOC433762/ | 6.12 | 9.40 | 6.21 | 9.03 | −3.28 | 0.00 | −2.82 | 0.09 | −1 | 0 |
| /LOC434166/ | 8.02 | 9.84 | 8.65 | 9.11 | −1.82 | 0.01 | −0.46 | 0.81 | −1 | 0 |
| /4933409K07Rik/ | 7.07 | 9.74 | 7.23 | 9.18 | −2.67 | 0.01 | −1.95 | 0.65 | −1 | 0 |
| /Gtf2ird1/ | 4.77 | 8.62 | 4.76 | 9.45 | −3.84 | 0.01 | −4.70 | 0.00 | −1 | −1 |
| /LOC100041175/ | 7.64 | 9.27 | 8.03 | 8.36 | −1.63 | 0.01 | −0.33 | 0.88 | −1 | 0 |
| /LOC434166/ | 6.34 | 10.42 | 7.54 | 8.51 | −4.08 | 0.01 | −0.97 | 0.88 | −1 | 0 |
| /BC031901/ | 5.87 | 7.16 | 6.10 | 6.90 | −1.29 | 0.03 | −0.79 | 0.61 | −1 | 0 |
| /Cux2/ | 8.74 | 6.79 | 9.39 | 6.86 | 1.95 | 0.03 | 2.52 | 0.00 | 1 | 1 |
| /A930008L05Rik/ | 5.24 | 8.03 | 5.48 | 7.11 | −2.78 | 0.03 | −1.62 | 0.42 | −1 | 0 |
| /BC094435/ | 10.34 | 11.68 | 10.16 | 10.02 | −1.35 | 0.03 | 0.14 | 0.98 | −1 | 0 |
| /LOC434166/ | 6.13 | 10.35 | 7.69 | 8.23 | −4.22 | 0.04 | −0.54 | 0.97 | −1 | 0 |
| /Ppara/ | 7.79 | 9.19 | 6.42 | 8.70 | −1.39 | 0.04 | −2.28 | 0.01 | −1 | −1 |
| /LOC100039345/ | 5.77 | 8.77 | 6.27 | 6.66 | −3.00 | 0.05 | −0.39 | 0.96 | −1 | 0 |
| /LOC433762/ | 6.62 | 9.64 | 6.52 | 8.86 | −3.02 | 0.05 | −2.34 | 0.39 | −1 | 0 |
| /4933409K07Rik/ | 5.98 | 8.84 | 6.17 | 7.83 | −2.85 | 0.05 | −1.66 | 0.72 | −1 | 0 |
| /Pde6 h/ | 5.93 | 7.47 | 6.27 | 7.40 | −1.54 | 0.05 | −1.13 | 0.21 | −1 | 0 |
| /LOC434166/ | 8.64 | 10.29 | 8.63 | 9.38 | −1.65 | 0.05 | −0.75 | 0.80 | −1 | 0 |
| /BC094435/ | 10.83 | 12.03 | 10.47 | 10.39 | −1.20 | 0.05 | 0.08 | 0.98 | −1 | 0 |
| /Ercc5/ | 6.87 | 8.59 | 7.08 | 8.23 | −1.72 | 0.05 | −1.16 | 0.03 | 0 | −1 |
| /Rxfp1/ | 6.07 | 4.90 | 6.69 | 4.82 | 1.17 | 0.06 | 1.87 | 0.00 | 0 | 1 |
| /Dnahc7b/ | 6.40 | 7.47 | 7.49 | 8.67 | −1.08 | 0.06 | −1.19 | 0.04 | 0 | −1 |
| /Haus8/ | 8.32 | 6.63 | 8.71 | 6.32 | 1.69 | 0.09 | 2.39 | 0.00 | 0 | 1 |
| /Lrrc2/ | 9.66 | 10.18 | 8.92 | 10.14 | −0.52 | 0.09 | −1.21 | 0.01 | 0 | −1 |
| /Dnajb14/ | 8.57 | 7.65 | 10.06 | 7.81 | 0.93 | 0.10 | 2.25 | 0.00 | 0 | 1 |
| /1110018F16Rik/ | 10.95 | 9.99 | 11.76 | 10.05 | 0.96 | 0.10 | 1.70 | 0.00 | 0 | 1 |
| /Haus8/ | 7.29 | 5.34 | 8.97 | 5.35 | 1.94 | 0.11 | 3.62 | 0.01 | 0 | 1 |
| /Dnahc7b/ | 6.04 | 7.09 | 7.10 | 8.55 | −1.05 | 0.12 | −1.45 | 0.03 | 0 | −1 |
| /Ppara/ | 6.61 | 8.15 | 5.52 | 7.85 | −1.54 | 0.13 | −2.33 | 0.00 | 0 | −1 |
| /5430419D17Rik/ | 6.57 | 8.98 | 6.81 | 8.89 | −2.41 | 0.13 | −2.08 | 0.01 | 0 | −1 |
| /6430590A07Rik/ | 8.42 | 9.46 | 8.48 | 9.84 | −1.05 | 0.13 | −1.36 | 0.01 | 0 | −1 |
| /Gm10468/ | 6.96 | 6.05 | 9.20 | 6.31 | 0.92 | 0.21 | 2.89 | 0.03 | 0 | 1 |
| /Ppap2c/ | 12.16 | 11.50 | 12.22 | 11.08 | 0.66 | 0.22 | 1.14 | 0.04 | 0 | 1 |
| /A930014E10Rik/ | 7.66 | 7.05 | 9.04 | 7.44 | 0.61 | 0.28 | 1.60 | 0.01 | 0 | 1 |
| /BB114814/ | 6.57 | 9.03 | 6.92 | 9.27 | −2.45 | 0.33 | −2.35 | 0.04 | 0 | −1 |
| /4930422G04Rik/ | 6.12 | 6.40 | 6.35 | 7.40 | −0.28 | 0.33 | −1.05 | 0.03 | 0 | −1 |
| /Fndc1/ | 7.57 | 8.19 | 7.77 | 9.14 | −0.61 | 0.39 | −1.37 | 0.04 | 0 | −1 |
| /Ppara/ | 5.30 | 6.41 | 5.00 | 6.20 | −1.11 | 0.54 | −1.20 | 0.02 | 0 | −1 |
| /Erap1/ | 6.12 | 6.25 | 6.02 | 7.08 | −0.13 | 0.83 | −1.06 | 0.03 | 0 | −1 |
| /Polr3f/ | 9.10 | 8.95 | 10.17 | 9.14 | 0.16 | 0.92 | 1.03 | 0.04 | 0 | 1 |
| /BC005512/ | 8.68 | 8.67 | 8.65 | 7.47 | 0.01 | 1.00 | 1.18 | 0.04 | 0 | 1 |
| /Postn/ | 7.44 | 7.44 | 7.04 | 5.81 | 0.00 | 1.00 | 1.23 | 0.01 | 0 | 1 |
GE represents average relative gene expression level of each gene, determined as described in Materials and Methods, in log2 scale from four independent Gtf2ird1-null and age-matched WT mouse retinas at 2 week (2W) and 4 month (4M) time points. Fold-change (FC) = (mean Gtf2ird1 null) − (mean WT). p_FDR represents p value after false discovery rate (FDR) multiple-test correction.
*Differentially expressed gene (DEG) signal where 1 = upregulated; −1 = downregulated; and 0 = no differential expression.
In addition to these limited and specific changes in photoreceptor gene expression, the Gtf2ird1-null mice demonstrated significant changes in the pattern of gene expression across the retina. Adult WT mice show a topological gradient of opsin expression across the retina, with predominant localization of M cones in the dorsal retina and S cones in the ventral retina (Applebury et al., 2000; Fig. 7A,B). Retinal flat-mount immunostaining demonstrated an unexpected alteration of cone topology in the retinas of Gtf2ird1-null mice. The null mouse shows approximately uniform distribution of S-opsin cones across the retina (Fig. 7A,B); in the dorsal retina, where S cones are normally scarce, the density of S-opsin-positive cells was as high as that in the ventral retina. In the dorsal retina of the null mice, at least 90% of M-opsin-immunopositive cells are also S-opsin-positive, whereas only 1% of M-opsin-immunopositive cells are M- and S-opsin double-positive in age-matched WT mice (Fig. 7C). The density and the ratio of S-opsin single-positive cells in the dorsal retina, as well as the total number of cone opsin-immunopositive cells across the retina (Fig. 7D), is not significantly affected by the loss of GTF2IRD1 expression. Additionally, quantitative image-based analysis of signal intensity of S-opsin immunostaining showed that S-opsin staining intensity in the M- and S-opsin double-positive cells of the Gtf2ird1-null mouse dorsal retina is as strong as that in the S-opsin single-positive cells of Gtf2ird1-null and WT mice (Fig. 7E). In contrast, in the ventral retina, the density, distribution, and expression pattern of cone opsin-immunopositive cells was not significantly different between Gtf2ird1-null and WT mice (Fig. 7A–D).
Figure 7.
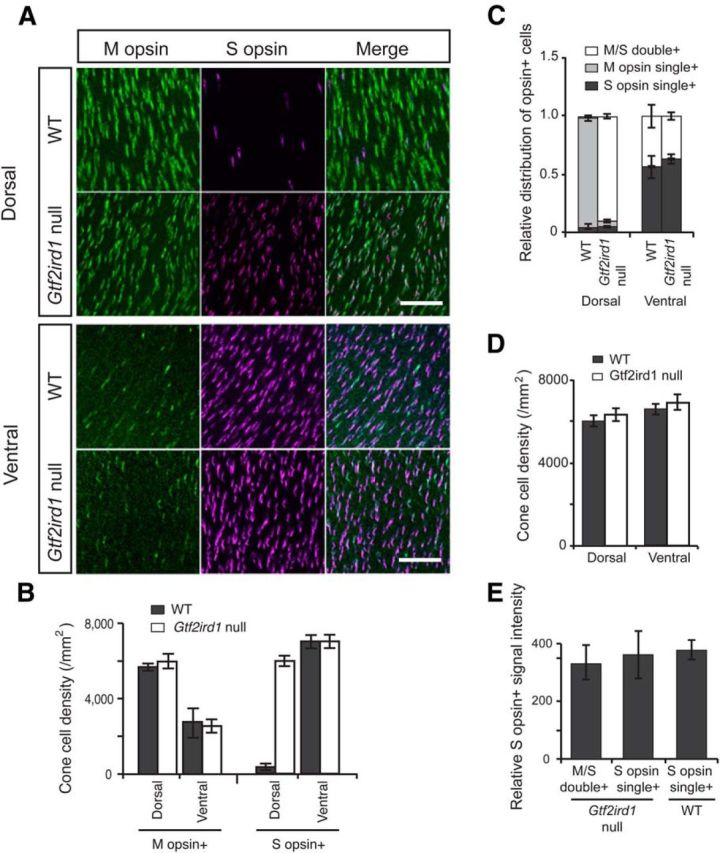
Gtf2ird1-null mice exhibit altered cone topology across the retina. A, Flat-mount staining for cone opsins at the dorsal and the ventral retina. Scale bars, 50 μm. B, Cell density of cone opsin-immunopositive cells at the dorsal and the ventral retina. M-opsin+ includes M-opsin single-positive cells, and M- and S-opsin double-positive cells. S-opsin+ includes S-opsin single-positive cells, and M- and S -opsin double-positive cells (n = 4). C, Relative distribution of opsin-immunopositive cells in the dorsal and the ventral retina (n = 4). Immunopositive cells for M-opsin only (M-opsin single+), S-opsin only (S-opsin single+), and both M- and S-opsin (M/S double+) are independently presented. D, Cone-cell density at the dorsal and the ventral retina. E, Relative S-opsin signal intensity in the M- and S-opsin double-positive and the S-opsin single-positive cells. Signal intensity was measured and analyzed using the Cellomics NeuronalProfiling image-analysis software. All data in B–E are represented as mean ± SE.
Gtf2ird1-null mice exhibit altered retinal electrophysiological properties
Cone and rod electrophysiological functions were analyzed independently by ERG (Fig. 8). In photopic ERGs, in which desensitization of rods with white light allows measurement of cone activity, two-way ANOVA revealed significant difference in the b-wave amplitudes between Gtf2ird1-null and age-matched WT mice (p < 0.0001; Fig. 8B). To independently assess S and M cone functions, photopic ERGs were recorded with spectrally focused LEDs that preferentially stimulated S cones (UV LED, 360 nm max) or M cones (green LED, 530 nm max). Two-way ANOVA revealed that the S cone ERGs were not significantly different between Gtf2ird1-null and WT mice (Fig. 8C), whereas the M cone ERG b-wave amplitudes were significantly reduced compared with the age-matched WT mice (p < 0.0001; Fig. 8D). These results are consistent with misregulation of M/S-opsin expression in M cones, suggesting that misregulation has an impact on M cone function. Consistent with the effect of GTF2IRD1 on rod gene expression, scotopic ERGs, which measure rod activity, revealed significant reduction in both a- and b-wave amplitudes in Gtf2ird1-null mice compared with the age-matched WT control animals (two-way ANOVA, p < 0.0001; Fig. 8F,G).
Figure 8.

Gtf2ird1-null mice exhibit altered electrophysiological responses. A, Representative photopic ERGs to four stimulus intensities for Gtf2ird1-null and WT mice. B–D, The amplitudes of photopic ERG b-waves for Gtf2ird1-null (n = 8) and age-matched WT (n = 7) with white light (B), UV LED (360 nm; C), and green LED (530 nm; D). E, Representative scotopic ERGs to six stimulus intensities for Gtf2ird1-null (n = 5) and WT mice (n = 6). F, The amplitudes of scotopic ERG a-waves for Gtf2ird1-null and age-matched WT. G, The amplitudes of scotopic ERG b-waves for Gtf2ird1-null and age-matched WT. All data in B–D, F, and G are shown as mean ± SE.
Discussion
We identified GTF2IRD1 by an LCR-based YOH screen that was designed to identify novel transcription factors that regulate M-opsin expression. GTF2IRD1 belongs to the TFII-I family that is characterized by multiple helix-loop-helix like I-repeat domains (Bayarsaihan and Ruddle, 2000). It can function as either an activator or repressor depending on the target gene and its context (O'Mahoney et al., 1998; Ring et al., 2002; Polly et al., 2003; Tantin et al., 2004). GTF2IRD1 was originally identified as a repressor of the slow-muscle-fiber-specific gene Troponin I slow (TnIslow; O'Mahoney et al., 1998; Polly et al., 2003). However, the Xenopus homolog of GTF2IRD1 is an activator of goosecoid expression (Ring et al., 2002), and GTF2IRD1 regulates immunoglobulin heavy-chain promoter activity positively or negatively, depending on the cell line studied (Tantin et al., 2004). Despite its study in a number of systems, GTF2IRD1 has not been previously implicated in retinal gene regulation.
In the present study, we found that GTF2IRD1 activates M-opsin expression by interacting with the Opn1mw upstream region in cooperation with CRX and TRβ2. GTF2IRD1 expression in photoreceptors begins by P10, but not earlier than P4. Because M-opsin mRNA expression begins at ∼P7 (Fei, 2003), our results indicate that GTF2IRD1 expression begins at the time of or immediately after the onset of M-opsin expression in M cones. This is in contrast to the expression pattern of another key transcriptional regulator of M cone specification, TRβ2, whose expression peaks at ∼E15–E18 and declines to a low level by the time M-opsin expression begins (Ng et al., 2001, 2009). Given that commitment to M cone cell-fate occurs earlier than initiation of M-opsin expression (Young, 1985) and genetic modulation of TRβ2 expression can alter M cone cell-fate (Ng et al., 2001, 2011), we hypothesize that after TRβ2 determines M cone cell-fate, GTF2IRD1 functions to directly regulate M-opsin expression in developing and mature cones (Fig. 9).
Figure 9.

Models of GTF2IRD1's role in M cones and rods. A, In cone precursors, transcription factors and their modulators, including TRβ2, RXRγ, and PIAS3, direct M cone cell-fate lineage determination (AI). Immature M cones are not yet morphologically developed and functional (AII). By the time M-opsin expression begins, TRβ2 expression level is significantly reduced, and GTF2IRD1 expression is increased. In M cones, GTF2IRD1 enhances M-opsin and other cone-specific gene expression in cooperation with CRX and TRβ2, whereas it suppresses S-opsin expression to maintain M cone function (AIII). B, In rods, GTF2IRD1 interacts with the enhancer and promoter regions of rhodopsin and other rod-specific genes and enhances their expression in cooperation with CRX and NRL to maintain rod function.
Although GTF2IRD1 interacts with the LCR and a GTF2IRD1 binding motif is present in the mouse LCR in the region used as bait for the YOH screen, in the transactivation assays shown in Figure 4, the degree of GTF2IRD1-mediated activation was not affected by the presence or absence of the LCR in the reporter construct. This potentially surprising result may be due to redundancy of GTF2IRD1 binding sites because multiple GTF2IRD1 interaction sites reside in the enhancer, promoter, and intron/exon regions of Opn1mw (Fig. 3A–C). Alternatively, or additionally, proper chromatin-DNA structure, which is lacking in the transiently transfected reporter plasmids, may be required for the formation of the proper LCR-promoter looping structure to activate transcription. Related to this possibility, CRX, a GTF2IRD1 binding partner, mediates chromatin structural changes that are involved in both the formation of LCR-opsin promoter looping structures and the assembly of opsin transcriptional complexes (Peng and Chen, 2007, 2011), thus suggesting a potential role of GTF2IRD1 in LCR-promoter looping.
In contrast to its effect on L/M-opsin, GTF2IRD1 inhibits S-opsin expression. Comparative analysis of the topographic distribution of S-opsin-immunopositive cells between the Gtf2ird1-null and the age-matched WT adult retinas suggests that S-opsin gene expression is de-repressed in precursors that would have become M cones. Interestingly, S-opsin-expressing cells in the dorsal retina are dominant at P4 and gradually decrease in abundance from P6 as M-opsin begins to be expressed (Onishi et al., 2010). Furthermore, quantitative analysis shows that S-opsin signal intensity in the M- and S-opsin double-positive cells in the Gtf2ird1-null mouse retina is as strong as that of S-opsin single-positive cells of the Gtf2ird1-null and the age-matched WT mouse retinas. These results indicate that GTF2IRD1 is a potent suppressor of S-opsin gene expression in developing and mature M cones. Additionally, our finding that siRNA-mediated Gtf2ird1 knockdown did not increase S-opsin mRNA expression in primary cultured cells from the Nrl knock-out mouse retina, where S cones are dominant, suggests the possibility that GTF2IRD1 may play different roles in S and M cones, repressing S-opsin in M cones but not in S cones. If this is the case, it will be interesting to determine what differences in the opsin gene regulatory network are responsible for such differing effects in S versus M cones.
GTF2IRD1 also appears to have some, but limited, activity on a few other cone-specific genes, such as Pdc and Arr3. It is likely that the altered expression of those genes, as well as M-opsin, are responsible for the abnormal white and green light cone ERG responses observed in the Gtf2ird1-null mouse retina. More complicated to explain, however, is that although the number of S-opsin-positive cells in the dorsal retina is increased in Gtf2ird1-null mice, the b-wave amplitudes of photopic ERG recordings with UV light, which is the wavelength of light to which mouse S-opsin is sensitive, were not enhanced. This may be due to decreased sensitivity of the Gtf2ird1-null S-opsin-expressing cones, perhaps due to lower expression of Pdc and Arr3.
Our finding that GTF2IRD1 regulates so few genes, especially annotated genes, and shows such specificity in affecting photoreceptor gene expression seems surprising given that it is widely expressed in multiple cell types in the adult retina. Also of interest is that such subtle changes in gene expression cause such significant changes in electrophysiological response as measured by scotopic and photopic ERGs. Similar findings were reported in the brain from another Gtf2ird1 knock-out mouse (O'Leary and Osborne, 2011), as well as in the Mecp2 knock-out mouse (Tudor et al., 2002). Although these mice demonstrated clear phenotypes, validated knockdown-related changes in gene expression were not detected (O'Leary and Osborne, 2011) or were subtle (Tudor et al., 2002). Similar to the situation suggested in the brain, GTF2IRD1 may act in the retina by providing fine regulation of gene expression, leading to expression changes that are small yet sufficient to have significant effects on photoreceptor function. As an additional possibility, GTF2IRD1 may have important functions beyond gene transcription, perhaps somehow affecting protein function and interaction in photoreceptor cells.
In an effort to integrate our data presented above with current thinking about the regulation of photoreceptor gene expression, Figure 9A presents a model in which GTF2IRD1 functions to maintain M cone function by activating expression of M-opsin and other cone-specific genes, while suppressing S-opsin in M cones. In early stages of retinal development, PIAS3, TRβ2, RXRγ, and their ligands act together to drive cone precursors to become M cones. Absence of TRβ2 at this early stage in development changes the cell-fate of cone precursors to become S cones. However, as M cone precursors mature, TRβ2 expression levels decrease before M-opsin is expressed, suggesting there are other factors that bridge this gap. One such factor is GTF2IRD1; its expression begins when or immediately after M-opsin expression begins and is maintained throughout adulthood in M cones. In M cones, GTF2IRD1 enhances expression of M-opsin and some other cone-enriched genes in cooperation with CRX and TRβ2. Potentially, the GTF2IRD1-TRβ2 interaction may contribute to the dorsal–ventral M cone gradient. At the same time, GTF2IRD1 suppresses S-opsin expression in M cones. The regulatory mechanism of this dual function is unclear. A recent study has demonstrated that an E3 SUMO-protein ligase, PIAS3, regulates cone cell-fate specification by dictating the dual role of transcription factors, including TRβ2 and RORα (Onishi et al., 2010). Additionally, GTF2IRD1 physically interacts with PIAS2, another E3 SUMO-protein ligase (Tussie-Luna et al., 2002). We have found that PIAS2 is localized to the nuclei of both M and S cones and colocalized with GTF2IRD1 (data not shown). Thus, one possible explanation is that the GTF2IRD1 functions are modulated by sumoylation through PIAS2 and/or PIAS3. Because M-opsin expression is not fully abolished even in the absence of GTF2IRD1, other factors may also be involved in enhancing M-opsin gene expression in mature M cones. In rods (Fig. 9B), GTF2IRD1 interacts with the enhancer and promoter regions of rhodopsin gene and, in cooperation with CRX and NRL, regulates rhodopsin and other rod-expressing gene expression to maintain rod function.
Footnotes
This work was supported by NIH Grants EY009769, P30EY001765, EY012543, and EY02687, the Foundation Fighting Blindness, and unrestricted research funds and a Lew Wasserman Merit Award from Research to Prevent Blindness (S.C.), and by generous gifts from the Guerrieri Family Foundation and from and Robert and Clarice Smith. We thank Dr Jeremy Nathans for providing human L-opsin reporter constructs, Dr Douglas Forrest for providing Trβ2 expression vector, Drs Hendrik P. Scholl and Shinji Ueno for critical advice regarding ERG experimental procedures, Masataka Nakanishi for technical assistance with confocal microscopy, and Dr Jose-Luis Linares for providing the Nrl-null cDNA library.
The authors declare no competing financial interests.
References
- Applebury ML, Antoch MP, Baxter LC, Chun LL, Falk JD, Farhangfar F, Kage K, Krzystolik MG, Lyass LA, Robbins JT. The murine cone photoreceptor: a single cone type expresses both S and M opsins with retinal spatial patterning. Neuron. 2000;27:513–523. doi: 10.1016/S0896-6273(00)00062-3. [DOI] [PubMed] [Google Scholar]
- Bayarsaihan D, Ruddle FH. Isolation and characterization of BEN, a member of the TFII-I family of DNA-binding proteins containing distinct helix-loop-helix domains. Proc Natl Acad Sci U S A. 2000;97:7342–7347. doi: 10.1073/pnas.97.13.7342. [DOI] [PMC free article] [PubMed] [Google Scholar]
- Chen S, Zack DJ. Cloning and characterization of retinal transcription factors, using target site-based methodology. Methods Enzymol. 2000;316:590–610. doi: 10.1016/S0076-6879(00)16752-7. [DOI] [PubMed] [Google Scholar]
- Chen S, Wang QL, Nie Z, Sun H, Lennon G, Copeland NG, Gilbert DJ, Jenkins NA, Zack DJ. Crx, a novel Otx-like paired-homeodomain protein, binds to and transactivates photoreceptor cell-specific genes. Neuron. 1997;19:1017–1030. doi: 10.1016/S0896-6273(00)80394-3. [DOI] [PubMed] [Google Scholar]
- Corbo JC, Cepko CL. A hybrid photoreceptor expressing both rod and cone genes in a mouse model of enhanced S-cone syndrome. PLoS Genet. 2005;1:e11. doi: 10.1371/journal.pgen.0010011. [DOI] [PMC free article] [PubMed] [Google Scholar]
- Cubelos B, Sebastián-Serrano A, Beccari L, Calcagnotto ME, Cisneros E, Kim S, Dopazo A, Alvarez-Dolado M, Redondo JM, Bovolenta P, Walsh CA, Nieto M. Cux1 and Cux2 regulate dendritic branching, spine morphology, and synapses of the upper layer neurons of the cortex. Neuron. 2010;66:523–535. doi: 10.1016/j.neuron.2010.04.038. [DOI] [PMC free article] [PubMed] [Google Scholar]
- Dai L, Bellugi U, Chen XN, Pulst-Korenberg AM, Järvinen-Pasley A, Tirosh-Wagner T, Eis PS, Graham J, Mills D, Searcy Y, Korenberg JR. Is it Williams syndrome? GTF2IRD1 implicated in visual-spatial construction and GTF2I in sociability revealed by high resolution arrays. Am J Med Genet A. 2009;149A:302–314. doi: 10.1002/ajmg.a.32652. [DOI] [PMC free article] [PubMed] [Google Scholar]
- Donnai D, Karmiloff-Smith A. Williams syndrome: from genotype through to the cognitive phenotype. Am J Med Genet. 2000;97:164–171. doi: 10.1002/1096-8628(200022)97:2<164::AID-AJMG8>3.0.CO%3B2-F. [DOI] [PubMed] [Google Scholar]
- Durkin ME, Keck-Waggoner CL, Popescu NC, Thorgeirsson SS. Integration of a c-myc transgene results in disruption of the mouse Gtf2ird1 gene, the homologue of the human GTF2IRD1 gene hemizygously deleted in Williams-Beuren syndrome. Genomics. 2001;73:20–27. doi: 10.1006/geno.2001.6507. [DOI] [PubMed] [Google Scholar]
- Fei Y. Development of the cone photoreceptor mosaic in the mouse retina revealed by fluorescent cones in transgenic mice. Mol Vis. 2003;9:31–42. [PubMed] [Google Scholar]
- Fujieda H, Bremner R, Mears AJ, Sasaki H. Retinoic acid receptor-related orphan receptor alpha regulates a subset of cone genes during mouse retinal development. J Neurochem. 2009;108:91–101. doi: 10.1111/j.1471-4159.2008.05739.x. [DOI] [PubMed] [Google Scholar]
- Furukawa T, Morrow EM, Li T, Davis FC, Cepko CL. Retinopathy and attenuated circadian entrainment in Crx-deficient mice. Nat Genet. 1999;23:466–470. doi: 10.1038/70591. [DOI] [PubMed] [Google Scholar]
- Hackler L, Jr, Masuda T, Oliver VF, Merbs SL, Zack DJ. Use of laser capture microdissection for analysis of retinal mRNA/miRNA expression and DNA methylation. Methods Mol Biol. 2012;884:289–304. doi: 10.1007/978-1-61779-848-1_21. [DOI] [PMC free article] [PubMed] [Google Scholar]
- Hsiau TH, Diaconu C, Myers CA, Lee J, Cepko CL, Corbo JC. The cis-regulatory logic of the mammalian photoreceptor transcriptional network. PLoS One. 2007;2:e643. doi: 10.1371/journal.pone.0000643. [DOI] [PMC free article] [PubMed] [Google Scholar]
- Lazebnik MB, Tussie-Luna MI, Roy AL. Determination and functional analysis of the consensus binding site for TFII-I family member BEN, implicated in Williams-Beuren syndrome. J Biol Chem. 2008;283:11078–11082. doi: 10.1074/jbc.C800049200. [DOI] [PMC free article] [PubMed] [Google Scholar]
- Mears AJ, Kondo M, Swain PK, Takada Y, Bush RA, Saunders TL, Sieving PA, Swaroop A. Nrl is required for rod photoreceptor development. Nat Genet. 2001;29:447–452. doi: 10.1038/ng774. [DOI] [PubMed] [Google Scholar]
- Nathans J. The evolution and physiology of human color vision: insights from molecular genetic studies of visual pigments. Neuron. 1999;24:299–312. doi: 10.1016/S0896-6273(00)80845-4. [DOI] [PubMed] [Google Scholar]
- Ng L, Hurley JB, Dierks B, Srinivas M, Saltó C, Vennström B, Reh TA, Forrest D. A thyroid hormone receptor that is required for the development of green cone photoreceptors. Nat Genet. 2001;27:94–98. doi: 10.1038/83829. [DOI] [PubMed] [Google Scholar]
- Ng L, Ma M, Curran T, Forrest D. Developmental expression of thyroid hormone receptor beta2 protein in cone photoreceptors in the mouse. Neuroreport. 2009;20:627–631. doi: 10.1097/WNR.0b013e32832a2c63. [DOI] [PMC free article] [PubMed] [Google Scholar]
- Ng L, Lu A, Swaroop A, Sharlin DS, Swaroop A, Forrest D. Two transcription factors can direct three photoreceptor outcomes from rod precursor cells in mouse retinal development. J Neurosci. 2011;31:11118–11125. doi: 10.1523/JNEUROSCI.1709-11.2011. [DOI] [PMC free article] [PubMed] [Google Scholar]
- Oh EC, Khan N, Novelli E, Khanna H, Strettoi E, Swaroop A. Transformation of cone precursors to functional rod photoreceptors by bZIP transcription factor NRL. Proc Natl Acad Sci U S A. 2007;104:1679–1684. doi: 10.1073/pnas.0605934104. [DOI] [PMC free article] [PubMed] [Google Scholar]
- O'Leary J, Osborne LR. Global analysis of gene expression in the developing brain of Gtf2ird1 knockout mice. PLoS One. 2011;6:e23868. doi: 10.1371/journal.pone.0023868. [DOI] [PMC free article] [PubMed] [Google Scholar]
- O'Mahoney JV, Guven KL, Lin J, Joya JE, Robinson CS, Wade RP, Hardeman EC. Identification of a novel slow-muscle-fiber enhancer binding protein, MusTRD1. Mol Cell Biol. 1998;18:6641–6652. doi: 10.1128/mcb.18.11.6641. [DOI] [PMC free article] [PubMed] [Google Scholar]
- Onishi A, Peng GH, Chen S, Blackshaw S. Pias3-dependent SUMOylation controls mammalian cone photoreceptor differentiation. Nat Neurosci. 2010;13:1059–1065. doi: 10.1038/nn.2618. [DOI] [PMC free article] [PubMed] [Google Scholar]
- Palmer SJ, Tay ES, Santucci N, Cuc Bach TT, Hook J, Lemckert FA, Jamieson RV, Gunnning PW, Hardeman EC. Expression of Gtf2ird1, the Williams syndrome-associated gene, during mouse development. Gene Expr Patterns. 2007;7:396–404. doi: 10.1016/j.modgep.2006.11.008. [DOI] [PubMed] [Google Scholar]
- Peng GH, Chen S. Crx activates opsin transcription by recruiting HAT-containing co-activators and promoting histone acetylation. Hum Mol Genet. 2007;16:2433–2452. doi: 10.1093/hmg/ddm200. [DOI] [PMC free article] [PubMed] [Google Scholar]
- Peng GH, Chen S. Active opsin loci adopt intrachromosomal loops that depend on the photoreceptor transcription factor network. Proc Natl Acad Sci U S A. 2011;108:17821–17826. doi: 10.1073/pnas.1109209108. [DOI] [PMC free article] [PubMed] [Google Scholar]
- Peng GH, Ahmad O, Ahmad F, Liu J, Chen S. The photoreceptor-specific nuclear receptor Nr2e3 interacts with Crx and exerts opposing effects on the transcription of rod versus cone genes. Hum Mol Genet. 2005;14:747–764. doi: 10.1093/hmg/ddi070. [DOI] [PubMed] [Google Scholar]
- Polly P, Haddadi LM, Issa LL, Subramaniam N, Palmer SJ, Tay ES, Hardeman EC. hMusTRD1alpha1 represses MEF2 activation of the troponin I slow enhancer. J Biol Chem. 2003;278:36603–36610. doi: 10.1074/jbc.M212814200. [DOI] [PubMed] [Google Scholar]
- Ring C, Ogata S, Meek L, Song J, Ohta T, Miyazono K, Cho KW. The role of a Williams-Beuren syndrome-associated helix-loop-helix domain-containing transcription factor in activin/nodal signaling. Genes Dev. 2002;16:820–835. doi: 10.1101/gad.963802. [DOI] [PMC free article] [PubMed] [Google Scholar]
- Roberts MR, Hendrickson A, McGuire CR, Reh TA. Retinoid X receptor γ is necessary to establish the S-opsin gradient in cone photoreceptors of the developing mouse retina. Invest Ophthalmol Vis Sci. 2005;46:2897–2904. doi: 10.1167/iovs.05-0093. [DOI] [PubMed] [Google Scholar]
- Roberts MR, Srinivas M, Forrest D, Morreale de Escobar G, Reh TA. Making the gradient: thyroid hormone regulates cone opsin expression in the developing mouse retina. Proc Natl Acad Sci U S A. 2006;103:6218–6223. doi: 10.1073/pnas.0509981103. [DOI] [PMC free article] [PubMed] [Google Scholar]
- Satoh S, Tang K, Iida A, Inoue M, Kodama T, Tsai SY, Tsai MJ, Furuta Y, Watanabe S. The spatial patterning of mouse cone opsin expression is regulated by bone morphogenetic protein signaling through downstream effector COUP-TF nuclear receptors. J Neurosci. 2009;29:12401–12411. doi: 10.1523/JNEUROSCI.0951-09.2009. [DOI] [PMC free article] [PubMed] [Google Scholar]
- Srinivas M, Ng L, Liu H, Jia L, Forrest D. Activation of the blue opsin gene in cone photoreceptor development by retinoid-related orphan receptor beta. Mol Endocrinol. 2006;20:1728–1741. doi: 10.1210/me.2005-0505. [DOI] [PubMed] [Google Scholar]
- Swaroop A, Kim D, Forrest D. Transcriptional regulation of photoreceptor development and homeostasis in the mammalian retina. Nat Rev Neurosci. 2010;11:563–576. doi: 10.1038/nrn2880. [DOI] [PMC free article] [PubMed] [Google Scholar]
- Tantin D, Tussie-Luna MI, Roy AL, Sharp PA. Regulation of immunoglobulin promoter activity by TFII-I class transcription factors. J Biol Chem. 2004;279:5460–5469. doi: 10.1074/jbc.M311177200. [DOI] [PubMed] [Google Scholar]
- Tassabehji M, Hammond P, Karmiloff-Smith A, Thompson P, Thorgeirsson SS, Durkin ME, Popescu NC, Hutton T, Metcalfe K, Rucka A, Stewart H, Read AP, Maconochie M, Donnai D. GTF2IRD1 in craniofacial development of humans and mice. Science. 2005;310:1184–1187. doi: 10.1126/science.1116142. [DOI] [PubMed] [Google Scholar]
- Thompson PD, Webb M, Beckett W, Hinsley T, Jowitt T, Sharrocks AD, Tassabehji M. GTF2IRD1 regulates transcription by binding an evolutionarily conserved DNA motif “GUCE”. FEBS Lett. 2007;581:1233–1242. doi: 10.1016/j.febslet.2007.02.040. [DOI] [PubMed] [Google Scholar]
- Tudor M, Akbarian S, Chen RZ, Jaenisch R. Transcriptional profiling of a mouse model for Rett syndrome reveals subtle transcriptional changes in the brain. Proc Natl Acad Sci U S A. 2002;99:15536–15541. doi: 10.1073/pnas.242566899. [DOI] [PMC free article] [PubMed] [Google Scholar]
- Tussie-Luna MI, Michel B, Hakre S, Roy AL. The SUMO ubiquitin-protein isopeptide ligase family member Miz1/PIASxbeta/Siz2 is a transcriptional cofactor for TFII-I. J Biol Chem. 2002;277:43185–43193. doi: 10.1074/jbc.M207635200. [DOI] [PubMed] [Google Scholar]
- Vullhorst D, Buonanno A. Multiple GTF2I-like repeats of general transcription factor 3 exhibit DNA binding properties: evidence for a common origin as a sequence-specific DNA interaction module. J Biol Chem. 2005;280:31722–31731. doi: 10.1074/jbc.M500593200. [DOI] [PubMed] [Google Scholar]
- Wang Y, Macke JP, Merbs SL, Zack DJ, Klaunberg B, Bennett J, Gearhart J, Nathans J. A locus control region adjacent to the human red and green visual pigment genes. Neuron. 1992;9:429–440. doi: 10.1016/0896-6273(92)90181-C. [DOI] [PubMed] [Google Scholar]
- Yang Z, Quigley HA, Pease ME, Yang Y, Qian J, Valenta D, Zack DJ. Changes in gene expression in experimental glaucoma and optic nerve transection: the equilibrium between protective and detrimental mechanisms. Invest Ophthalmol Vis Sci. 2007;48:5539–5548. doi: 10.1167/iovs.07-0542. [DOI] [PubMed] [Google Scholar]
- Young RW. Cell differentiation in the retina of the mouse. Anat Rec. 1985;212:199–205. doi: 10.1002/ar.1092120215. [DOI] [PubMed] [Google Scholar]