Abstract
It is well established that human brain white matter structure changes with aging, but the timescale and spatial distribution of this change remain uncertain. Cross-sectional diffusion tensor imaging (DTI) studies indicate that, after a period of relative stability during adulthood, there is an accelerated decline in anisotropy and increase in diffusivity values during senescence; and, spatially, results have been discussed within the context of several anatomical frameworks. However, inferring trajectories of change from cross-sectional data can be challenging; and, as yet, there have been no longitudinal reports of the timescale and spatial distribution of age-related white matter change in healthy adults across the adult lifespan. In a longitudinal DTI study of 203 adults between 20 and 84 years of age, we used tract-based spatial statistics to characterize the pattern of annual change in fractional anisotropy, axial diffusivity, radial diffusivity, and mean diffusivity and examined whether there was an acceleration of change with age. We found extensive and overlapping significant annual decreases in fractional anisotropy, and increases in axial diffusivity, radial diffusivity, and mean diffusivity. Spatially, results were consistent with inferior-to-superior gradients of lesser-to-greater vulnerability. Annual change increased with age, particularly within superior regions, with age-related decline estimated to begin in the fifth decade. Charting white matter microstructural changes in healthy aging provides essential context to clinical studies, and future studies should compare age trajectories between healthy participants and at-risk populations and also explore the relationship between DTI rates of change and cognitive decline.
Keywords: aging, DTI, lifespan, longitudinal, white matter
Introduction
Diffusion tensor imaging (DTI), a noninvasive MRI technique that measures the diffusion of water molecules, has proved a popular method to examine white matter microstructure in aging. Over the past two decades, numerous cross-sectional DTI studies have examined the relationships between age and the degree of anisotropy (fractional anisotropy [FA]) or mean diffusivity (MD) in white matter tracts (Yap et al., 2013). More recently, diffusivity parallel to the primary diffusion direction (axial diffusivity [AD]) and perpendicular to the primary diffusion direction (radial diffusivity [RD]) has also been explored. Cross-sectional studies have demonstrated that older adults display lower FA values and higher MD and RD values compared with younger adults (Head et al., 2004; Burzynska et al., 2010), with age correlations relatively weak during adulthood and stronger in senescence (Westlye et al., 2010a; Lebel et al., 2012). Spatially, results have been discussed within the context of several anatomical frameworks, and there is continued debate regarding the extent to which age-related changes are localized to the frontal lobe, follow posterior-to-anterior or inferior-to-superior gradients of lesser-to-greater vulnerability, or represent a selective deterioration of specific white matter tracts (Greenwood, 2000; Salat, 2011).
The conclusions that can be drawn from cross-sectional studies are, unfortunately, limited because of between-subject variance and possible cohort effects (Schaie, 2005). Longitudinal studies may provide better estimates of the aging process as each participant can serve as his/her own baseline. Although there have been few longitudinal DTI studies published to date, DTI metrics have been shown to be sensitive to age-related change over 1–2 years in adults older than 50 years (Barrick et al., 2010; Teipel et al., 2010; Likitjaroen et al., 2012). Although accelerated rates of annual change with age have not been demonstrated in older populations (Barrick et al., 2010), examining annual change in a larger sample and across a broader age range may provide greater sensitivity to detect an effect.
Here, we report the results of a longitudinal DTI study of 203 adults between 20 and 84 years of age. First, we aim to describe the pattern of annual change over a 3 to 5 year period, independent of the effect of age. In line with cross-sectional studies, we hypothesize that annual change will be characterized by decreased FA and increased AD, RD, and MD. Second, we aim to examine the effect of age on annual change. Based on cross-sectional DTI data (Westlye et al., 2010a), as well as cognitive behavioral data (Nyberg et al., 2012), an acceleration of changes with age is expected. Anatomically, our main aim is to explore the extent to which changes follow posterior-to-anterior or inferior-to-superior gradients.
Materials and Methods
Participants.
The sample was drawn from the ongoing project Cognition and Plasticity through the Lifespan at the Research Group for Lifespan Changes in Brain and Cognition, Department of Psychology, University of Oslo (Westlye et al., 2010b, 2011). All procedures were approved by the Regional Ethical Committee for Medical and Health Research Ethics, and written consent was obtained from all participants before commencement. For the first wave of data collection, participants were recruited through newspaper advertisements. Recruitment for the follow-up assessment was by written invitation to the original participants. At both time points, participants were screened with health interviews to ascertain eligibility. Participants were required to be right handed, fluent Norwegian speakers, and have normal or corrected to normal vision and hearing. Exclusion criteria were history of injury or disease known to affect CNS function, including neurological or psychiatric illness or serious head trauma, being under psychiatric treatment, use of psychoactive drugs known to affect CNS functioning, and MRI contraindications. Moreover, at baseline, participants were required to score ≥26 on the Mini Mental State Examination (MMSE) (Folstein et al., 1975), have a Beck Depression Inventory (Beck and Steer, 1987) score ≤16, and obtain a normal IQ or above (≥85) on the Wechsler Abbreviated Scale of Intelligence (Wechsler, 1999).
At follow-up, participants were again required to score ≥26 on the MMSE, and an additional set of inclusion criteria was also used: MMSE change from time point 1 to time point 2, <10%; California Verbal Learning Test II, Alternative Version (CVLT II) (Delis et al., 2000); immediate delay and long delay T-score >30; and CVLT II immediate delay and long delay change from time point 1 to time point 2, <60%. Furthermore, at both time points, all scans were evaluated by a neuroradiologist and were required to be deemed free of significant injuries or pathological conditions. Exclusion criteria did not extend to vascular risk factors, such as hypertension or diabetes.
A total of 281 participants satisfied the inclusion criteria at baseline. For the follow-up study, 42 participants did not want to or were unable to participate, 18 we were unable to locate, 3 did not participate due to undisclosed health reasons, and 3 had MRI contraindications, yielding a total of 66 dropouts. Of the 215 participants who completed MRI and neuropsychological testing at both time points, 203 participants satisfied the follow-up inclusion criteria and had adequately processed and quality-checked DTI data and were included in this study.
Full participant characteristics are provided in Table 1. Briefly, the mean age at baseline was 50.2 years (range, 20.2–84.2 years). Mean interval between scans was 3.6 years (range, 2.7–4.7 years). Interval was not significantly associated with age (r = −0.136, p = 0.053). A total of 59% of participants were female; females and males did not differ with regard to age (p = 0.223) or interval (p = 0.660). One participant was prescribed blood pressure medication at baseline, and 19 participants at follow-up. One participant had a diagnosis of diabetes and was prescribed insulin both at baseline and follow-up. Two participants were receiving treatment for depression at follow-up, with one prescribed antidepressant medication.
Table 1.
Participant characteristics and demographics
| Mean ± SD (range) | |
|---|---|
| N (females/males) | 203 (120:83) |
| Age at baseline (years) | 50.2 ± 16.5 (20.2–84.2) |
| Age at follow-up (years) | 53.8 ± 16.4 (23.5–87.7) |
| Interval (years) | 3.6 ± 0.4 (2.7–4.7) |
| Education (years) | 15.9 ± 2.6 (8–26) |
| Estimated IQ at baseline | 115.0 ± 8.6 (93–145) |
When compared with the 203 participants included in the current study, independent samples t tests revealed that the 78 dropouts had comparable mean age (t = 0.221, p = 0.826) but significantly lower years of education (t = −2.28, p = 0.023), baseline full-scale IQ (FSIQ) (t = −4.45, p < 0.001), and baseline MMSE (t = −2.46 p = 0.036). Higher levels of cognitive ability in returning participants has often been noted and discussed in longitudinal studies (Chatfield et al., 2005; Salthouse, 2014). DTI measures (FA, AD, RD, and MD) at baseline for four tracts of interest (anterior thalamic radiation, inferior longitudinal fasciculus, superior longitudinal fasciculus, uncinate fasciculus) were not significantly different between included participants and dropouts. Furthermore, Fisher r to z transformations did not reveal significant differences in the strength of correlations between baseline DTI measures and age when including all baseline participants (n = 279) or participants included in longitudinal analyses.
MRI acquisition.
Imaging data were collected using a 12-channel head coil on a 1.5 T Siemens Avanto scanner (Siemens Medical Solutions) at Rikshospitalet, Oslo University Hospital. The same scanner and sequences were used at both time points, although with minor software upgrades.
DTI was performed using a single-shot twice-refocused spin-echo echo planar imaging pulse sequence optimized to minimize eddy current-induced distortions (Reese et al., 2003) (primary slice direction, axial; phase encoding direction, columns; repetition time, 8200 ms; echo time, 82 ms; voxel size, 2.0 mm isotropic; number of slices, 64; FOV, 256; matrix size, 128 × 128 × 64; b value, 700 s/mm2; number of diffusion weighted directions, 30; number of b0 images, 10; number of acquisitions, 2). Acquisition time was 11 min 21 s.
Two repeated 160 slices sagittal T1-weighted MP-RAGE sequences were obtained (repetition time, 2400 ms; echo time, 3.61 ms; time to inversion, 1000 ms; flip angle, 8°; FOV, 240; matrix size, 192 × 192; FOV, 240; voxel size, 1.25 × 1.25 × 1.20 mm).
MRI analysis.
The DTI data were manually checked, and scans with major artifacts were excluded. All DTI images were corrected for eddy-current-induced distortions and head motion by means of an affine registration to the reference (b0) volume using the FSL tool eddy_correct. The two acquisitions were then averaged, by calculating the mean, to increase signal-to-noise ratio using FSL tools. Averaging was performed before tensor fitting.
Analysis of DTI data was performed using Tract-Based Spatial Statistics (TBSS) (Smith et al., 2006), part of FSL (Smith et al., 2004). First, average FA images were created by fitting a tensor model to the raw diffusion data using FDT and brain-extracted using BET (Smith, 2002). All participants' FA data were aligned into a common space using the nonlinear registration tool FNIRT (Andersson et al., 2007a, 2007b), which uses a b-spline representation of the registration warp field (Rueckert et al., 1999). Next, the mean FA image was created and thinned to create a mean FA skeleton, which represents the centers of all tracts common to the group. The threshold for the mean FA skeleton was set at 0.2, resulting in a mask of 128,547 voxels. Each participant's aligned FA data were then projected onto this skeleton. Nonlinear warps and skeleton projection stages were also repeated using AD (λ1), RD (λ2 + λ3/2) and MD (λ1 + λ2 + λ3/3) values.
To confirm the final tract-center projection stage was similar at each time point, skeletonized images were deprojected onto each nonlinearly registered participant (in standard space) using tbss_deproject and manually checked. Annual difference (time point 2 − time point 1/interval) maps were then created for FA, MD, AD, and RD.
It is important to note that a TBSS processing pipeline tailored for longitudinal data was not available within FSL at the time of analysis. However, because the skeleton was based on the mean of all scans from both time points, there is no danger that the registration procedure could cause a bias in the change estimates in any direction.
For T1-weighted images, the two runs were averaged during preprocessing, to increase the signal-to-noise ratio. The resulting images were first automatically processed cross-sectionally (independently) for each time point with FreeSurfer (version 5.1.0) (Dale et al., 1999; Fischl et al., 1999; Fischl and Dale, 2000) and then subsequently run through the longitudinal processing stream (Reuter et al., 2012). Total volume of white matter hypointensities (WMHs) was extracted at each time point, and annual difference was calculated.
Statistical analysis.
Voxelwise statistics were performed on annual difference maps using “randomize” with 5000 permutations (Nichols and Holmes, 2002). To investigate the pattern of annual change, a nonparametric one-sample t test was run with mean age of the two time points and sex as confound regressors. To investigate acceleration of annual change with age, a correlation between annual change and mean age of the two time points was run with sex as a confound regressor. The significance threshold was set at p < 0.05, corrected for multiple comparisons across space, using threshold-free cluster enhancement (Smith and Nichols, 2009).
Because diffusivity values can approach 0 and lead to misleading percentage change values, voxelwise statistics were performed on annual difference maps rather than maps of annual percentage change. However, as annual percentage change values can facilitate comparisons across metrics, regions, and studies, annual percentage change was calculated for selected ROIs for descriptive purposes. Specifically, mean (time point 1 + time point 2)/2) maps were created for FA, MD, AD, and RD, and annual percentage change was calculated relative to the mean value across both time points for global, frontal, parietal, occipital, and parietal ROI, and also for regions significant in voxelwise analyses.
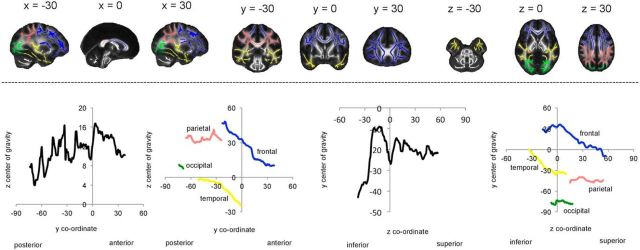
To explore the spatial pattern of results and examine whether results were localized to a specific lobe, ROIs were created for frontal, parietal, occipital, and temporal lobes (Fig. 1). The number of significant voxels within each ROI was calculated and also expressed as a percentage of the ROI. To examine whether findings were consistent with global posterior-to-anterior or inferior-to-superior gradients, the mean annual difference and the mean uncorrected t statistic were calculated across all skeleton voxels for each coronal and axial slice, excluding the most distal slices with <500 voxels. To explore whether gradients varied with lobe, profiles were also created for frontal, parietal, occipital, and temporal ROI. The most distal slices with <250 voxels within the ROI were excluded from the profiles. In interpreting global and lobe profiles, it is important to consider the interaction between gradients; for example, anterior portions of the frontal lobe are more inferior compared with posterior portions, and we have therefore illustrated the center of gravity for each coronal and axial slice in Figure 1.
Figure 1.
ROIs and anatomy of slice-by-slice profiles. Top, ROIs for the frontal (blue), parietal (pink), occipital (green), and temporal (yellow) ROI are displayed, overlaid on a white skeleton. Bottom, The center of gravity across each coronal and axial slice is plotted for global (black), frontal (blue), parietal (pink), occipital (green), and temporal (yellow) ROI.
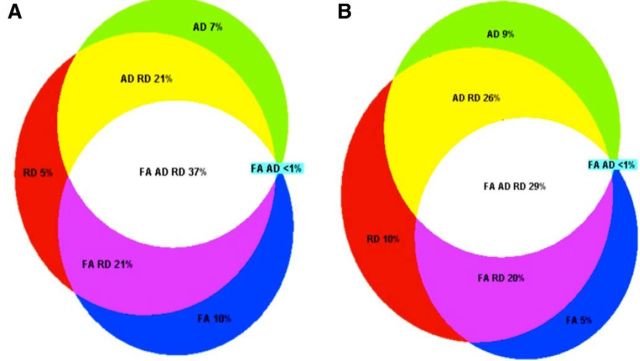
To illustrate the overlap between significant results in FA, AD, and RD, Venn diagrams were generated using the Euler Venn Applet (Chow and Rodgers, 2005).
To explore age trajectories and illustrate change within individuals, spaghetti plots were created for mean FA, MD, AD, and RD within global, frontal, parietal, occipital, and temporal ROIs. As global fits, such as linear and quadratic models, may be affected by irrelevant factors, such as the sampled age range (Fjell et al., 2010), an assumption-free longitudinal nonparametric general additive mixed model for each ROI as a function of age was fitted to accurately describe changes across the studied age range. Curve fitting was performed using functions freely available through the statistical environment R, version 3.0.1 (http://www.r-project.org/).
The influence of WMH was examined by including annual difference in WMH as an additional confound regressor in voxelwise analyses examining annual change and acceleration of change with age. To examine the influence of sex, we examined whether annual change or age correlations were significantly different between males and females.
Results
Pattern of annual change
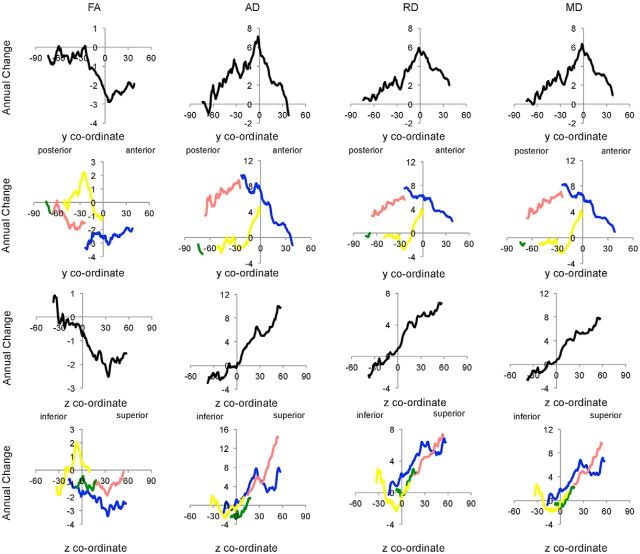
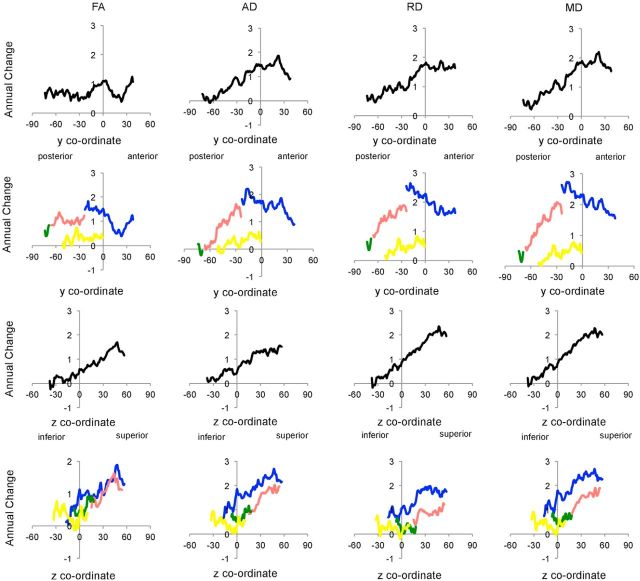
Mean annual change and equivalent percentage change across the whole TBSS skeleton are provided in Table 2, with slice-by-slice profiles displayed in Figure 2. Coronal profiles showed that, globally, annual change peaked at ∼y = 0, whereas axial profiles displayed inferior-to-superior gradients of lesser-to-greater change.
Table 2.
Pattern of annual change: annual change and annual percentage change (mean ± SD)a
| Annual change |
Annual percentage change |
|||||||
|---|---|---|---|---|---|---|---|---|
| FA | AD | RD | MD | FA | AD | RD | MD | |
| Global | −1.2 ± 3.8 | 2.7 ± 6.2 | 2.7 ± 5.5 | 2.7 ± 5.4 | −0.3 ± 0.8 | 0.2 ± 0.5 | 0.5 ± 1.0 | 0.3 ± 0.7 |
| Frontal | −2.2 ± 3.9 | 3.7 ± 7.3 | 4.3 ± 6.1 | 4.1 ± 6.2 | −0.5 ± 0.9 | 0.3 ± 0.6 | 0.8 ± 1.1 | 0.5 ± 0.8 |
| Parietal | −1.2 ± 3.7 | 6.7 ± 6.9 | 4.6 ± 5.7 | 5.3 ± 5.7 | −0.2 ± 0.8 | 0.6 ± 0.6 | 0.8 ± 1.0 | 0.7 ± 0.7 |
| Occipital | −0.9 ± 3.4 | −0.4 ± 7.1 | 1.34 ± 5.4 | 0.8 ± 5.5 | −0.2 ± 0.8 | −0.0 ± 0.6 | 0.2 ± 0.9 | 0.1 ± 0.7 |
| Temporal | 0.3 ± 5.0 | −0.4 ± 8.3 | −0.3 ± 7.3 | −0.3 ± 7.2 | 0.1 ± 1.2 | −0.0 ± 0.7 | −0.1 ± 1.2 | 0.0 ± 0.9 |
| Significant regions | −3.2 ± 3.8 | 8.2 ± 7.5 | 5.6 ± 6.0 | 6.0 ± 6.0 | −0.7 ± 0.8 | 0.7 ± 0.6 | 1.0 ± 1.0 | 0.8 ± 0.8 |
aFA values are × 10−3; AD, RD, and MD values are mm2 s−1 × 10⁻⁶.
Figure 2.
Slice-by-slice profiles of annual change. Annual change in FA, AD, RD, and MD is plotted for each coronal and axial slice within global (black), frontal (blue), parietal (pink), occipital (green), and temporal (yellow) ROI. FA values are × 10−3; AD, RD, and MD values are mm2 s−1 × 10⁻⁶.
To further explore the anatomy of annual change in DTI metrics, mean annual change and equivalent percentage change within frontal, parietal, occipital, and temporal ROI is provided in Table 2, with slice-by-slice profiles displayed in Figure 2. Annual change was greatest within the frontal and parietal lobes. Coronal profiles showed that annual change increased gradually along the posterior-to-anterior gradient within the parietal lobe for all measures and peaked after fibers entered the frontal lobe. Within the frontal lobe, annual change in FA remained fairly stable along the posterior-to-anterior axis, whereas annual change in AD, RD, and MD steadily decreased. Inferior-to-superior gradients were evident in all lobes from z = 0 onwards for AD, RD, and MD.
Voxelwise analysis confirmed that widespread regions displayed an annual decrease in FA, increase in AD, increase in RD, or increase in MD (Table 3). The mean annual difference, and equivalent percentage change, in regions significant at p < 0.05 is provided in Table 2. The majority of voxels significant at p < 0.05 also remained significant at p < 0.01 (FA 42%, AD 44%, RD 55%, MD 52%). Results were similar after excluding age or sex as covariates or including interval as an additional covariate.
Table 3.
Pattern of annual change: number and percentage of voxels significant at p < 0.05, after correction for multiple comparisons across space, with age and sex as confound regressors
| No. of significant voxels |
% of significant voxels |
|||||||
|---|---|---|---|---|---|---|---|---|
| FA | AD | RD | MD | FA | AD | RD | MD | |
| Global | 60,556 | 70,820 | 57,688 | 74,475 | 47 | 45 | 58 | 55 |
| Frontal | 28,635 | 23,992 | 33,887 | 32,045 | 64 | 54 | 76 | 72 |
| Parietal | 12,913 | 19,935 | 21,995 | 22,530 | 49 | 76 | 83 | 85 |
| Occipital | 5408 | 3500 | 2317 | 4393 | 46 | 20 | 38 | 30 |
| Temporal | 5433 | 4349 | 5159 | 4349 | 25 | 20 | 24 | 20 |
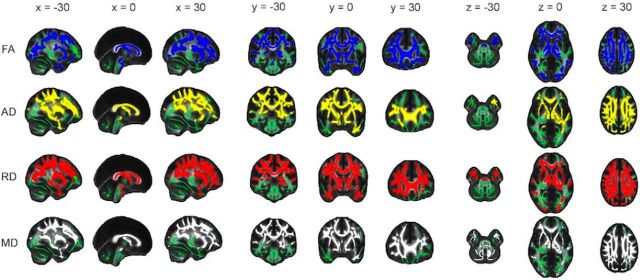
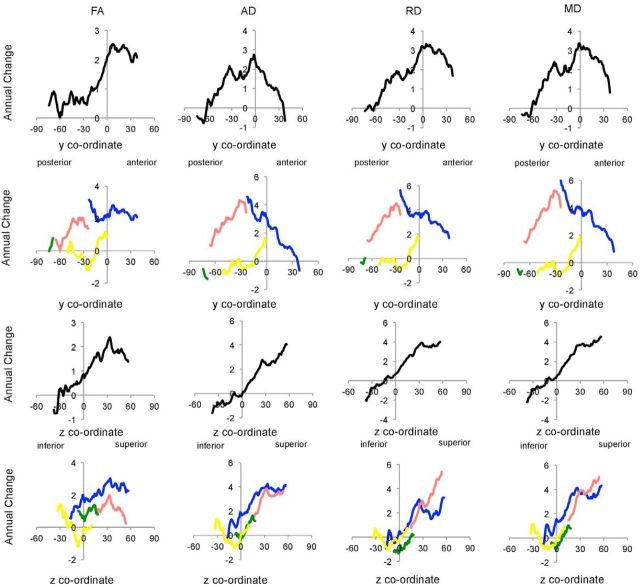
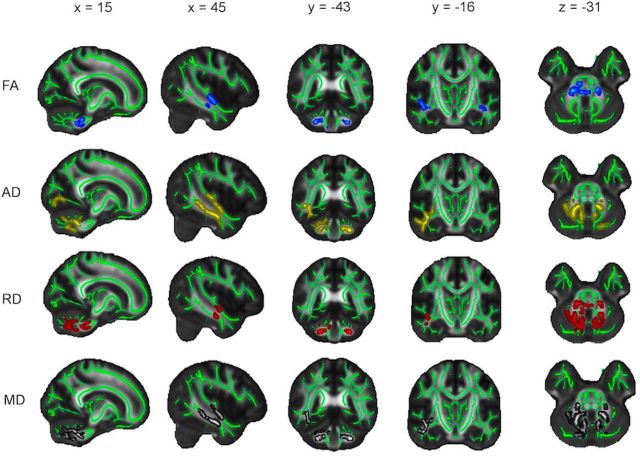
Significant regions primarily fell within the frontal and parietal lobes, with the occipital and temporal lobes affected to a lesser extent (Fig. 3; Table 3). Significant regions spanned all of the major white matter tracts and included vast portions of the anterior thalamic radiation, body and genu of the corpus callosum, and superior longitudinal fasciculus. Coronal and axial profiles of the mean t statistic within a slice displayed similar profiles to mean annual change (Fig. 4). That is, posterior-to-anterior gradients were evident primarily within the parietal lobe, with inferior-to-superior gradients observed across all lobes for AD, RD, and MD from z = 0 onwards.
Figure 3.
Pattern of annual change: decrease in FA and increase in AD, RD, and MD. Voxels displaying a significant (p < 0.05, after correction for multiple comparisons across space) annual decrease in FA (blue), increase in AD (yellow), increase in RD (red), and increase in MD (gray), dilated for illustrative purposes, are overlaid on a green skeleton. x, y, and z coordinates in MNI space are indicated at the top of each column.
Figure 4.
Pattern of annual change: slice-by-slice profiles of mean t statistic. The mean, uncorrected, t statistic for analyses of annual change in FA, AD, RD, and MD is plotted for each coronal and axial slice within global (black), frontal (blue), parietal (pink), occipital (green), and temporal (yellow) ROI.
There was considerable overlap between voxels displaying a significant annual decrease in FA, increase in AD, or increase in RD at p < 0.05 (Fig. 5A). The most prevalent combinations were as follows: (1) decrease in FA, increase in AD, and increase in RD; (2) decrease in FA and increase in RD; and (3) increase in RD and increase in AD.
Figure 5.
Overlap of voxels showing significant change. Overlap of significant voxels. A, Pattern of annual change in DTI parameters. Overlap between voxels displaying a significant (p < 0.05, after correction for multiple comparisons across space) annual decrease in FA, increase in AD, or increase in RD is illustrated. Different segments indicate proportion of voxels showing change in FA only (blue), FA and RD (purple), RD only (red), RD and AD (yellow), AD only (green), and FA, RD, and AD (white). Voxels that did not display a significant decrease in FA, increase in AD, or increase in RD (30% of all skeleton voxels) are not represented in this figure. B, Acceleration of annual change in DTI parameters. Overlap between voxels displaying a significant correlation between age and annual decrease in FA, increase in AD, or increase in RD is shown, with color coding as for A. Voxels that did not display a significant correlation with FA, AD, or RD (37% of all skeleton voxels) are not represented in this figure.
Limited regions displayed an annual increase in FA (1% of voxels significant at p < 0.05, within the cerebellar peduncle, inferior fronto-occipital fasciculus, and inferior longitudinal fasciculus), decrease in AD (6%, within the cerebellum peduncle, forceps minor, forceps major, inferior longitudinal fasciculus, and inferior fronto-occipital fasciculus), decrease in RD (3%, within the cerebellum peduncle and inferior longitudinal fasciculus), or decrease in MD (3%, within the cerebellum peduncle, inferior longitudinal fasciculus, and inferior fronto-occipital fasciculus) (Fig. 6). Few, if any, of these voxels remained significant at p < 0.01 (FA 0%, AD <1%, RD <0.5%, MD <1%).
Figure 6.
Pattern of annual change: increase in FA and decrease in AD, RD, and MD. Regions with a significant (p < 0.05, after correction for multiple comparisons across space) annual increase in FA (blue), decrease in AD (yellow), decrease in RD (red), and decrease in MD (gray) are overlaid on a green skeleton. Significant regions are dilated for illustrative purposes.
Acceleration of annual change with age
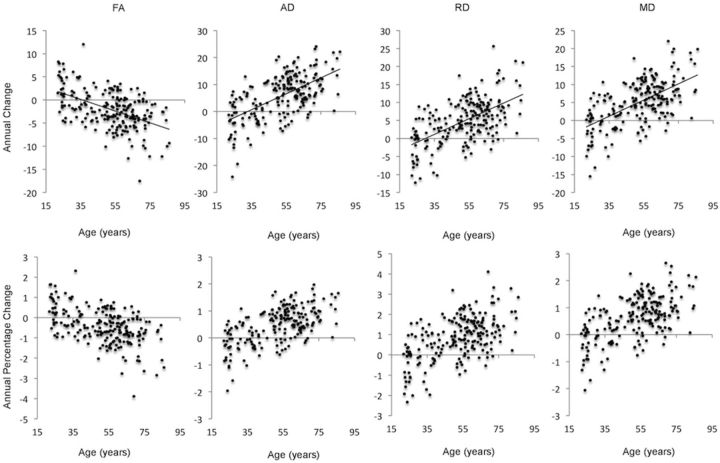
Voxelwise analysis showed that older age was associated with a greater annual decrease in FA, increase in AD, increase in RD, and increase in MD in widespread regions (Table 4). Mean annual difference and equivalent percentage change within significant regions are illustrated in Figure 7. The majority of voxels significant at p < 0.05 remained significant at p < 0.01 (FA 27%, AD 37%, RD 54%, MD 53%). Including interval as an additional covariate did not reduce the percentage of significant voxels.
Table 4.
Acceleration of annual change with age: number and percentage of voxels significant at p < 0.05, after correction for multiple comparisons across space, with age and sex as confound regressors
| No. of significant voxels |
% of significant voxels |
|||||||
|---|---|---|---|---|---|---|---|---|
| FA | AD | RD | MD | FA | AD | RD | MD | |
| Whole skeleton | 44,552 | 52,466 | 69,999 | 69,377 | 35 | 41 | 54 | 54 |
| Frontal | 21,870 | 28,588 | 33,815 | 34,469 | 49 | 64 | 76 | 77 |
| Parietal | 14,214 | 11,549 | 18,040 | 17,050 | 54 | 44 | 68 | 65 |
| Occipital | 3300 | 38 | 4997 | 4418 | 28 | <1 | 43 | 38 |
| Temporal | 3331 | 4363 | 5906 | 5749 | 16 | 21 | 28 | 27 |
Figure 7.
Acceleration of annual change with age: annual difference and percentage change in significant voxels. Mean annual difference (top) and equivalent percentage change (bottom) are plotted against age for FA, AD, RD, and MD. FA values are × 10−3; AD, RD, and MD values are mm2 s−1 × 10⁻⁶.
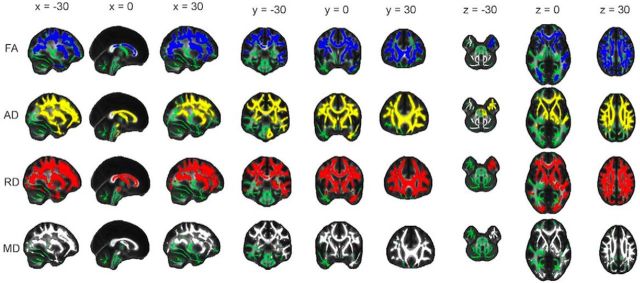
Similar to analyses of annual change, significant regions spanned widespread portions of the frontal and parietal lobes, with the occipital and temporal lobes affected to a lesser degree (Fig. 8; Table 4). Again, vast portions of the anterior thalamic radiation, body and genu of the corpus callosum, and superior longitudinal fasciculus displayed significant voxels. Slice-by-slice profiles examining mean t statistic (Fig. 9) displayed posterior-to-anterior gradients for AD, RD, and MD, driven by gradients within the parietal lobe. Inferior-to-superior gradients were shown for FA, AD, RD, and MD.
Figure 8.
Acceleration of annual change with age. Voxels displaying a significant correlation (p < 0.05, after correction for multiple comparisons across space) between age and annual decrease in FA (blue), increase in AD (yellow), increase in RD (red), and increase in MD (gray) dilated for illustrative purposes, are overlaid on a green skeleton. x, y, and z coordinates in MNI space are indicated at the top of each column.
Figure 9.
Acceleration of annual change with age: mean t statistic. The mean, uncorrected, t statistic for analyses examining acceleration of annual change with age for FA, AD, RD, and MD is plotted for each coronal and axial slice within global (black), frontal (blue), parietal (pink), occipital (green), and temporal (yellow) ROI.
Overlap between regions that displayed accelerated annual change in FA, AD, or MD with age is illustrated in Figure 5B. As with annual change, the most prevalent combinations were as follows: (1) decrease in FA, increase in AD,and increase in RD; (2) decrease in FA and increase in RD; and (3) increase in RD and increase in AD.
Older age was not associated with greater annual increase in FA, decrease in AD, decrease in RD, or decrease in MD.
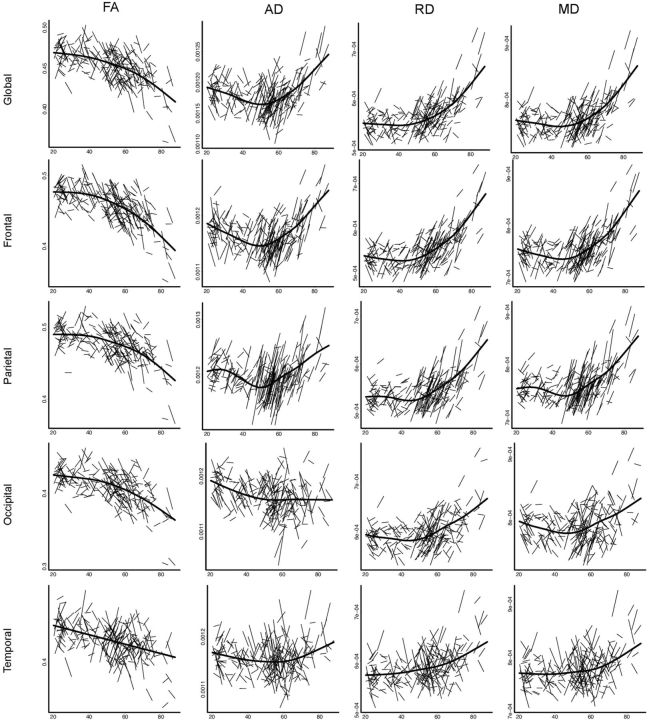
For global, frontal, parietal, occipital, and temporal ROI, individual change in FA, AD, RD, and MD as a function of age was illustrated with spaghetti plots (Fig. 10). Age-related changes were estimated to begin in the fifth decade; and, following this threshold, age had the greatest effect within frontal and parietal ROIs, compared with occipital and temporal ROIs.
Figure 10.
Acceleration of change with age: spaghetti plots. Individual participant change in FA, AD, RD, and MD with age is illustrated for global, frontal, parietal, occipital, and temporal ROI. For each measure, an assumption-free general additive model as a function of age was fitted to accurately describe changes across the age range. Diffusivity values are mm2 s−1 × 10⁻³.
Influence of WMHs and sex
The results of voxelwise analyses examining annual change remained similar after including annual difference in total volume of WMH as an additional covariate. A bivariate correlation showed that annual difference in total volume of WMH correlated with mean age (r = 0.466, p < 0.01), and controlling for this variable in analyses examining the acceleration of annual change with age reduced the prevalence of significant results at p < 0.05 (FA 23%, AD 34%, RD 42%, MD 44%).
Voxelwise analysis, covarying for age, did not reveal any areas in which annual change was significantly different between sexes. However, the linear relationship between age and FA was significantly greater in men compared with women in 21% of all skeleton voxels at p < 0.05 (Fig. 11). Significant voxels were particularly localized to the temporal lobe (25% of all temporal voxels significant at p < 0.05), but also spanned frontal (18%), parietal (17%), and occipital (18%) lobes. No voxels remained significant at p < 0.01. Correlations between age and change in AD, RD, and MD were not found to be significantly different between sexes.
Figure 11.
Influence of sex on acceleration of annual change with age. Regions in which the linear relationship between age and FA was significantly greater in men compared with women (p < 0.05, after correction for multiple comparisons across space) is displayed in blue, dilated for illustrative purposes, and overlaid on a green skeleton.
Discussion
Summary
In a longitudinal DTI study of 203 adults aged 20–84 years of age, we found extensive and overlapping significant annual decreases in FA and increases in AD, RD, and MD. Annual change increased with age, with the start of decline placed in the fifth decade. Spatially, results were consistent with inferior-to-superior gradients of lesser-to-greater vulnerability.
Anatomy of age-related changes
There were striking similarities in the anatomy of annual change and acceleration of annual change with age, and we now consider the most appropriate framework for age-related changes with reference to the results of both analyses.
Overall, as illustrated by slice-by-slice profiles, age-related changes appear to be principally governed by inferior-to-superior gradients. Cross-sectional DTI studies have previously indicated that superior fiber tracts may be more susceptible to the effects of age (Sullivan et al., 2010a, 2010b), but, to our knowledge, this is the first demonstration of continuous inferior-to-superior gradients. Our conclusion, however, may well reflect the combination of methods used, rather than the anatomy itself, representing a major departure from published cross-sectional results. Indeed, our results can be considered with reference to several alternative anatomical frameworks.
For example, first, it has been proposed that the frontal lobe is particularly vulnerable to age-related deterioration. Whereas our results support age-related degeneration within the frontal lobe, significant findings also included wide portions of the parietal lobe, with occipital and temporal lobes affected to a lesser extent. Crucially, slice-by-slice profiles illustrated that, at a given axial slice, lobe did not appear to exert a major influence. Therefore, we conclude that the predilection for age-related changes within frontal and parietal lobes reflects the superior positioning of these lobes, compared with occipital and temporal lobes, rather than representing lobe-specific effects.
Second, it has been proposed that, rather than the anatomy of age-related deterioration being dictated by lobe boundaries, changes follow posterior-to-anterior gradients. Whereas such gradients have been discussed as a global phenomena, Bennett et al. (2010) observed posterior-to-anterior gradients only when examining superior clusters, and Davis et al. (2009) demonstrated posterior-to-anterior gradients within tracts traversing frontal and parietal cortices but not the temporal cortex. In line with these refinements, posterior-to-anterior gradients were repeatedly observed within the parietal lobe, in which the axial center of gravity remains relatively stable and superior. Within the frontal lobe, posterior-to-anterior gradients were not demonstrated; instead, the pattern paralleled axial slice position. Therefore, we conclude that posterior-to-anterior gradients are anatomically specific and appear to be secondary to inferior-to-superior gradients.
Third, it has been proposed that age-related changes represent a selective deterioration of specific white matter tracts. Although our voxelwise analyses highlighted the involvement of the anterior thalamic radiation, body and genu of the corpus callosum, and superior longitudinal fasciculus, it does not appear that the gradient effect is merely due to selective deterioration of fiber systems. Longitudinal tractography studies will provide a greater insight into this issue.
Within each of the anatomical frameworks discussed, parallels have been drawn between the patterns of age-related decline and the patterns associated with development. Specifically, it has been suggested that the lobes, regions, and tracts that are latest to develop are the first to decline in aging. Indeed, it is of interest that, in a cross-sectional DTI study, white matter maturation has been shown to proceed in a continuous fashion from inferior to superior regions (Colby et al., 2011). Longitudinal studies examining gradients across the entire lifespan, rather than solely the adult lifespan, will allow a more direct examination of this hypothesis. Furthermore, it has been speculated that the anatomy of white matter development and decline reflects myelination and myelin breakdown, respectively (Bartzokis, 2004). Myelin breakdown is not typically described in terms of inferior-to-superior gradients; and, ultimately, further study is needed regarding the nature of the underlying cellular changes to seek to understand the predilection of DTI age-changes for superior areas.
Overlap of age-related changes
Analyses examining annual change and acceleration of change with age produced highly complementary findings with regard to overlap between significant voxels. Our principle findings of extensive and overlapping voxels displaying an annual decrease in FA or increase in AD, RD, and MD, with change increasing with age, supports existing cross-sectional analyses (Bennett et al., 2010; Burzynska et al., 2010; Westlye et al., 2010a; Lebel et al., 2012). The prevalence and strength of changes in RD in particular are in line with myelin disruption or loss, whereas accompanying changes in AD have been associated with chronic white matter degeneration also involving axonal injury (Bennett et al., 2010). Disentangling different profiles of anisotropy and diffusivity changes, and linking each to a distinct biological process, remains controversial, so results should be interpreted with caution.
A contrasting pattern of annual increases in FA and decreases in MD, AD, and RD was found in limited regions in our analyses examining the pattern of annual change, primarily within the cerebellar peduncle and inferior white matter tracts. Increased FA within the cerebellar vermis approached significance in a small longitudinal study of older adults (Likitjaroen et al., 2012), and decreased AD has been reported previously in cross-sectional studies (Bennett et al., 2010; Burzynska et al., 2010) with suggested biological interpretations, including gliosis, early axonal injury, and less coherent tract organization.
The age at which decline begins
Pinpointing the age at which decline in white matter microstructure begins has important implications for public health interventions aimed at promoting healthy aging. In cross-sectional studies, maximum FA values have been estimated to occur between 20 and 42 years, and minimum MD values between 18 and 50 years (Westlye et al., 2010a; Bartzokis et al., 2012; Kochunov et al., 2012; Lebel et al., 2012). Our results indicate that the onset of age-related decline falls toward the later end of such ranges, in the fifth decade.
Age trajectories were dampened within the temporal and occipital ROI. Such findings are in accordance with cross-sectional studies that have reported an absence of age correlations within the temporal and occipital lobes (Hsu et al., 2008) and less clear-cut age trajectories within the hippocampal portion of the cingulum (Westlye et al., 2010a).
Influence of WMH and sex
Controlling for the annual difference in total volume of WMH did not affect results of one-sample t tests examining the pattern of annual change but reduced the prevalence of voxels displaying a significant correlation between annual change and age. This may be due to WMH having a direct effect on annual change in DTI measures by affecting voxels with WMH (Vernooij et al., 2009) or result from WMH and DTI changes both reflecting general white matter degeneration.
Although annual change was not significantly different between males and females and an age × sex interaction was not displayed for AD, RD or MD, the linear relationship between age and FA was significantly greater in males compared with females in selected regions. Age × sex interactions have been reported by some cross-sectional studies (Kochunov et al., 2012), but other studies have reported nonsignificant findings (Sullivan et al., 2001; Hsu et al., 2008). In light of such mixed findings, this is a key area for future research.
Strengths and limitations
Major strengths of our study included the longitudinal design, large sample size, and the wide age range of participants. Participants passed a thorough screening procedure, minimizing the possibility that psychological or neurological diagnoses confounded results. However, as degenerative conditions can have long-lasting preclinical periods, it is difficult to ensure that subclinical or preclinical conditions did not influence findings. Participants generally performed above average on tests of cognitive functioning and may therefore not be representative of the general population. Possible confounds associated with cross-sectional studies, including between-subject variance and cohort effects, apply to analyses examining correlations with age.
With regard to data acquisition and analysis, the study benefitted from the same scanner and sequence being used at both time points. Although drift in scanner performance over time is possible, and measures could be affected by minor MRI software upgrades, it is unlikely that such factors could explain the pattern of our findings.
As our primary anatomical aim was to examine continuous gradients of vulnerability across the whole brain, we chose to use a voxelwise statistical approach, which was not without limitations. For example, we only included participants with full datasets in our analyses. Participants included in our analysis displayed higher levels of education, FSIQ, and MMSE scores compared with dropouts, which may have impacted upon our results. It will be important for future studies to use optimized longitudinal statistical approaches that can incorporate incomplete datasets (McArdle, 2009).
Future directions
There are many avenues of research, outside of the scope of the current paper, which should be explored by future studies: for example, the relationship between longitudinal DTI metrics and age-associated cognitive decline; as well as the influence of potential sources of between-subject variability, including genotype, factors hypothesized to be protective to white matter microstructure (e.g., physical activity), and factors hypothesized to be detrimental (e.g., vascular risk) (Raz and Rodrigue, 2006).
In conclusion, we have shown that extensive changes in white matter microstructure can be detected longitudinally over 3–5 years and that changes accelerate with advanced age and follow inferior-to-superior gradients of lesser-to-greater vulnerability.
Footnotes
C.E.S. was supported by the Yggdrasil Mobility Programme, Research Council of Norway. C.E.S. and H.J.-B. were supported by the National Institute for Health Research, Oxford Biomedical Research Centre based at Oxford University Hospitals NHS Trust and University of Oxford. H.J.-B. was supported by the Wellcome Trust. L.T.W. was supported by the Research Council of Norway Grant 204966/F20. K.B.W. and A.M.F. were supported by the Norwegian Research Council and the European Research Council's Starting Grant scheme. A.B.S., C.K.T., K.B.W., and A.M.F. were also supported by the Department of Psychology, University of Oslo. The views expressed are those of the author(s) and not necessarily those of the NHS, the National Institute for Health Research, or the Department of Health.
The authors declare no competing financial interests.
References
- Andersson J, Jenkinson M, Smith S. Non-linear optimisation. FMRIB Tech Rep TR07JA1. 2007a [Google Scholar]
- Andersson J, Jenkinson M, Smith S. Non-linear registration, aka spatial normalisation. FMRIB Tech Rep TR07JA2. 2007b [Google Scholar]
- Barrick TR, Charlton RA, Clark CA, Markus HS. White matter structural decline in normal ageing: a prospective longitudinal study using tract-based spatial statistics. Neuroimage. 2010;51:565–577. doi: 10.1016/j.neuroimage.2010.02.033. [DOI] [PubMed] [Google Scholar]
- Bartzokis G. Age-related myelin breakdown: a developmental model of cognitive decline and Alzheimer's disease. Neurobiol Aging. 2004;25:5–18. doi: 10.1016/j.neurobiolaging.2003.03.001. author reply 49–62. [DOI] [PubMed] [Google Scholar]
- Bartzokis G, Lu PH, Heydari P, Couvrette A, Lee GJ, Kalashyan G, Freeman F, Grinstead JW, Villablanca P, Finn JP, Mintz J, Alger JR, Altshuler LL. Multimodal magnetic resonance imaging assessment of white matter aging trajectories over the lifespan of healthy individuals. Biol Psychiatry. 2012;72:1026–1034. doi: 10.1016/j.biopsych.2012.07.010. [DOI] [PubMed] [Google Scholar]
- Beck A, Steer R. Beck Depression Inventory Scoring Manual. New York: The Psychological Corporation; 1987. [Google Scholar]
- Bennett IJ, Madden DJ, Vaidya CJ, Howard DV, Howard JH., Jr Age-related differences in multiple measures of white matter integrity: a diffusion tensor imaging study of healthy aging. Hum Brain Mapp. 2010;31:378–390. doi: 10.1002/hbm.20872. [DOI] [PMC free article] [PubMed] [Google Scholar]
- Burzynska AZ, Preuschhof C, Bäckman L, Nyberg L, Li SC, Lindenberger U, Heekeren HR. Age-related differences in white matter microstructure: region-specific patterns of diffusivity. Neuroimage. 2010;49:2104–2112. doi: 10.1016/j.neuroimage.2009.09.041. [DOI] [PubMed] [Google Scholar]
- Chatfield MD, Brayne CE, Matthews FE. A systematic literature review of attrition between waves in longitudinal studies in the elderly shows a consistent pattern of dropout between differing studies. J Clin Epidemiol. 2005;58:13–19. doi: 10.1016/j.jclinepi.2004.05.006. [DOI] [PubMed] [Google Scholar]
- Chow C, Rodgers P. Euler Diagrams Workshop. Paris: 2005. Constructing area-proportional Venn and Euler diagrams with three circles. [Google Scholar]
- Colby JB, Van Horn JD, Sowell ER. Quantitative in vivo evidence for broad regional gradients in the timing of white matter maturation during adolescence. Neuroimage. 2011;54:25–31. doi: 10.1016/j.neuroimage.2010.08.014. [DOI] [PMC free article] [PubMed] [Google Scholar]
- Dale AM, Fischl B, Sereno MI. Cortical surface-based analysis: I. Segmentation and surface reconstruction. Neuroimage. 1999;9:179–194. doi: 10.1006/nimg.1998.0395. [DOI] [PubMed] [Google Scholar]
- Davis SW, Dennis NA, Buchler NG, White LE, Madden DJ, Cabeza R. Assessing the effects of age on long white matter tracts using diffusion tensor tractography. Neuroimage. 2009;46:530–541. doi: 10.1016/j.neuroimage.2009.01.068. [DOI] [PMC free article] [PubMed] [Google Scholar]
- Delis D, Kramer J, Kaplan E, Ober B. California Verbal Learning Test, Ed 2 (CVLT-II) San Antonio, TX: The Psychological Corporation; 2000. [Google Scholar]
- Fischl B, Dale AM. Measuring the thickness of the human cerebral cortex from magnetic resonance images. Proc Natl Acad Sci U S A. 2000;97:11050–11055. doi: 10.1073/pnas.200033797. [DOI] [PMC free article] [PubMed] [Google Scholar]
- Fischl B, Sereno MI, Dale AM. Cortical surface-based analysis: II. Inflation, flattening, and a surface-based coordinate system. Neuroimage. 1999;9:195–207. doi: 10.1006/nimg.1998.0396. [DOI] [PubMed] [Google Scholar]
- Fjell AM, Walhovd KB, Westlye LT, Østby Y, Tamnes CK, Jernigan TL, Gamst A, Dale AM. When does brain aging accelerate? Dangers of quadratic fits in cross-sectional studies. Neuroimage. 2010;50:1376–1383. doi: 10.1016/j.neuroimage.2010.01.061. [DOI] [PubMed] [Google Scholar]
- Folstein MF, Folstein SE, McHugh PR. “Mini-mental state”: a practical method for grading the cognitive state of patients for the clinician. J Psychiatr Res. 1975;12:189–198. doi: 10.1016/0022-3956(75)90026-6. [DOI] [PubMed] [Google Scholar]
- Greenwood PM. The frontal aging hypothesis evaluated. J Int Neuropsychol Soc. 2000;6:705–726. doi: 10.1017/S1355617700666092. [DOI] [PubMed] [Google Scholar]
- Head D, Buckner RL, Shimony JS, Williams LE, Akbudak E, Conturo TE, McAvoy M, Morris JC, Snyder AZ. Differential vulnerability of anterior white matter in nondemented aging with minimal acceleration in dementia of the Alzheimer type: evidence from diffusion tensor imaging. Cereb Cortex. 2004;14:410–423. doi: 10.1093/cercor/bhh003. [DOI] [PubMed] [Google Scholar]
- Hsu JL, Leemans A, Bai CH, Lee CH, Tsai YF, Chiu HC, Chen WH. Gender differences and age-related white matter changes of the human brain: a diffusion tensor imaging study. Neuroimage. 2008;39:566–577. doi: 10.1016/j.neuroimage.2007.09.017. [DOI] [PubMed] [Google Scholar]
- Kochunov P, Williamson DE, Lancaster J, Fox P, Cornell J, Blangero J, Glahn DC. Fractional anisotropy of water diffusion in cerebral white matter across the lifespan. Neurobiol Aging. 2012;33:9–20. doi: 10.1016/j.neurobiolaging.2010.01.014. [DOI] [PMC free article] [PubMed] [Google Scholar]
- Lebel C, Gee M, Camicioli R, Wieler M, Martin W, Beaulieu C. Diffusion tensor imaging of white matter tract evolution over the lifespan. Neuroimage. 2012;60:340–352. doi: 10.1016/j.neuroimage.2011.11.094. [DOI] [PubMed] [Google Scholar]
- Likitjaroen Y, Meindl T, Friese U, Wagner M, Buerger K, Hampel H, Teipel SJ. Longitudinal changes of fractional anisotropy in Alzheimer's disease patients treated with galantamine: a 12-month randomized, placebo-controlled, double-blinded study. Eur Arch Psychiatry Clin Neurosci. 2012;262:341–350. doi: 10.1007/s00406-011-0234-2. [DOI] [PubMed] [Google Scholar]
- McArdle JJ. Latent variable modeling of differences and changes with longitudinal data. Annu Rev Psychol. 2009;60:577–605. doi: 10.1146/annurev.psych.60.110707.163612. [DOI] [PubMed] [Google Scholar]
- Nichols TE, Holmes AP. Nonparametric permutation tests for functional neuroimaging: a primer with examples. Hum Brain Mapp. 2002;15:1–25. doi: 10.1002/hbm.1058. [DOI] [PMC free article] [PubMed] [Google Scholar]
- Nyberg L, Lövdén M, Riklund K, Lindenberger U, Bäckman L. Memory aging and brain maintenance. Trends Cogn Sci. 2012;16:292–305. doi: 10.1016/j.tics.2012.04.005. [DOI] [PubMed] [Google Scholar]
- Raz N, Rodrigue KM. Differential aging of the brain: patterns, cognitive correlates and modifiers. Neurosci Biobehav Rev. 2006;30:730–748. doi: 10.1016/j.neubiorev.2006.07.001. [DOI] [PMC free article] [PubMed] [Google Scholar]
- Reese TG, Heid O, Weisskoff RM, Wedeen VJ. Reduction of eddy-current-induced distortion in diffusion MRI using a twice-refocused spin echo. Magn Reson Med. 2003;49:177–182. doi: 10.1002/mrm.10308. [DOI] [PubMed] [Google Scholar]
- Reuter M, Schmansky NJ, Rosas HD, Fischl B. Within-subject template estimation for unbiased longitudinal image analysis. Neuroimage. 2012;61:1402–1418. doi: 10.1016/j.neuroimage.2012.02.084. [DOI] [PMC free article] [PubMed] [Google Scholar]
- Rueckert D, Sonoda LI, Hayes C, Hill DL, Leach MO, Hawkes DJ. Nonrigid registration using free-form deformations: application to breast MR images. IEEE Trans Med Imaging. 1999;18:712–721. doi: 10.1109/42.796284. [DOI] [PubMed] [Google Scholar]
- Salat DH. The declining infrastructure of the aging brain. Brain Connect. 2011;1:279–293. doi: 10.1089/brain.2011.0056. [DOI] [PMC free article] [PubMed] [Google Scholar]
- Salthouse TA. Selectivity of attrition in longitudinal studies of cognitive functioning. J Gerontol B Psychol Sci Soc Sci. 2014;69:567–574. doi: 10.1093/geronb/gbt046. [DOI] [PMC free article] [PubMed] [Google Scholar]
- Schaie KW. What can we learn from longitudinal studies of adult development? Res Hum Dev. 2005;2:133–158. doi: 10.1207/s15427617rhd0203_4. [DOI] [PMC free article] [PubMed] [Google Scholar]
- Smith SM. Fast robust automated brain extraction. Hum Brain Mapp. 2002;17:143–155. doi: 10.1002/hbm.10062. [DOI] [PMC free article] [PubMed] [Google Scholar]
- Smith SM, Nichols TE. Threshold-free cluster enhancement: addressing problems of smoothing, threshold dependence and localisation in cluster inference. Neuroimage. 2009;44:83–98. doi: 10.1016/j.neuroimage.2008.03.061. [DOI] [PubMed] [Google Scholar]
- Smith SM, Jenkinson M, Woolrich MW, Beckmann CF, Behrens TEJ, Johansen-Berg H, Bannister PR, De Luca M, Drobnjak I, Flitney DE, Niazy RK, Saunders J, Vickers J, Zhang Y, De Stefano N, Brady JM, Matthews PM. Advances in functional and structural MR image analysis and implementation as FSL. Neuroimage. 2004;23(Suppl 1):S208–S219. doi: 10.1016/j.neuroimage.2004.07.051. [DOI] [PubMed] [Google Scholar]
- Smith SM, Jenkinson M, Johansen-Berg H, Rueckert D, Nichols TE, Mackay CE, Watkins KE, Ciccarelli O, Cader MZ, Matthews PM, Behrens TE. Tract-based spatial statistics: voxelwise analysis of multi-subject diffusion data. Neuroimage. 2006;31:1487–1505. doi: 10.1016/j.neuroimage.2006.02.024. [DOI] [PubMed] [Google Scholar]
- Sullivan EV, Adalsteinsson E, Hedehus M, Ju C, Moseley M, Lim KO, Pfefferbaum A. Equivalent disruption of regional white matter microstructure in ageing healthy men and women. Neuroreport. 2001;12:99–104. doi: 10.1097/00001756-200101220-00027. [DOI] [PubMed] [Google Scholar]
- Sullivan EV, Zahr NM, Rohlfing T, Pfefferbaum A. Fiber tracking functionally distinct components of the internal capsule. Neuropsychologia. 2010a;48:4155–4163. doi: 10.1016/j.neuropsychologia.2010.10.023. [DOI] [PMC free article] [PubMed] [Google Scholar]
- Sullivan EV, Rohlfing T, Pfefferbaum A. Quantitative fiber tracking of lateral and interhemispheric white matter systems in normal aging: relations to timed performance. Neurobiol Aging. 2010b;31:464–481. doi: 10.1016/j.neurobiolaging.2008.04.007. [DOI] [PMC free article] [PubMed] [Google Scholar]
- Teipel SJ, Meindl T, Wagner M, Stieltjes B, Reuter S, Hauenstein KH, Filippi M, Ernemann U, Reiser MF, Hampel H. Longitudinal changes in fiber tract integrity in healthy aging and mild cognitive impairment: a DTI follow-up study. J Alzheimers Dis. 2010;22:507–522. doi: 10.3233/JAD-2010-100234. [DOI] [PubMed] [Google Scholar]
- Vernooij MW, Ikram MA, Vrooman HA, Wielopolski PA, Krestin GP, Hofman A, Niessen WJ, Van der Lugt A, Breteler MM. White matter microstructural integrity and cognitive function in a general elderly population. Arch Gen Psychiatry. 2009;66:545–553. doi: 10.1001/archgenpsychiatry.2009.5. [DOI] [PubMed] [Google Scholar]
- Wechsler D. Wechsler abbreviated scale of intelligence. San Antonio, TX: The Psychological Corporation; 1999. [Google Scholar]
- Westlye LT, Walhovd KB, Dale AM, Bjørnerud A, Due-Tønnessen P, Engvig A, Grydeland H, Tamnes CK, Ostby Y, Fjell AM. Life-span changes of the human brain white matter: diffusion tensor imaging (DTI) and volumetry. Cereb Cortex. 2010a;20:2055–2068. doi: 10.1093/cercor/bhp280. [DOI] [PubMed] [Google Scholar]
- Westlye LT, Walhovd KB, Dale AM, Bjørnerud A, Due-Tønnessen P, Engvig A, Grydeland H, Tamnes CK, Østby Y, Fjell AM. Differentiating maturational and aging-related changes of the cerebral cortex by use of thickness and signal intensity. Neuroimage. 2010b;52:172–185. doi: 10.1016/j.neuroimage.2010.03.056. [DOI] [PubMed] [Google Scholar]
- Westlye LT, Grydeland H, Walhovd KB, Fjell AM. Associations between regional cortical thickness and attentional networks as measured by the attention network test. Cereb Cortex. 2011;21:345–356. doi: 10.1093/cercor/bhq101. [DOI] [PubMed] [Google Scholar]
- Yap QJ, Teh I, Fusar-Poli P, Sum MY, Kuswanto C, Sim K. Tracking cerebral white matter changes across the lifespan: insights from diffusion tensor imaging studies. J Neural Transm. 2013;120:1369–1395. doi: 10.1007/s00702-013-0971-7. [DOI] [PubMed] [Google Scholar]


