Contrast-enhanced US has an ability equal to that of nicotinamide adenine dinucleotide hydrogen staining to help monitor the effects of radiofrequency ablation in real time and to help quantify the size of thermal damage after treatment in the liver.
Abstract
Purpose
To examine the accuracy of the unenhanced zone at contrast material–enhanced ultrasonography (US) in predicting coagulative necrosis during and 21 days after radiofrequency (RF) ablation by using radiologic-pathologic comparison.
Materials and methods
Animal studies were approved by the Institutional Animal Care and Use Committee. The livers of 28 rats underwent US-guided RF ablation. In four animals, contrast-enhanced US was performed during ablation and 2 hours and 2, 7, 14, and 21 days after ablation. The unenhanced zone area on US images was measured. DiI-labeled microbubbles were administered during ablation at 2, 4, and 6 minutes or at 2 hours and 2, 7, 14, and 21 days after ablation in the remaining 24 animals (n = 3 at each time point). One minute later, the animal was euthanized, and the ablated liver was harvested. Tissue samples were imaged to quantify total fluorescence, and NADH staining was performed on the same slice. Hematoxylin-eosin staining was also performed. The findings on fluorescence images, NADH-stained images, and hematoxylin-eosin–stained images were compared. The areas of DiI bubble–negative zones, NADH-negative zones, and lightly NADH-staining zones were measured. Data were analyzed by using one-way analysis of variance.
Results
The area of the unenhanced zone on contrast-enhanced US images increased during RF ablation and reached a maximum within 2 days after ablation. At histopathologic examination, a transition zone manifested adjacent to the coagulation zone until 2 days after ablation. The DiI-bubble negative zone on fluorescence images and the damaged zone (transition zone plus coagulation zone) on NADH-stained images increased rapidly within 2 hours after ablation, then slowly reached the maximum on day 2. The ratios of the mean areas of these two zones at hour 2 to those at day 2 were 94.6% and 95.6%, respectively. High uniformity between the damaged zone on NADH-stained images and the DiI bubble–negative zone on fluorescence images was noted at all time points.
Conclusion
The temporary transition zone in NADH staining is partially damaged and should transition to nonviability 2 days after ablation. These results demonstrate that contrast-enhanced US can help delineate the maximum area of cell damage (to within 5% of the maximum) as early as 2 hours after ablation. Contrast-enhanced US may be a simple and accurate tool for monitoring the effects of RF ablation and quantifying the size of thermal damage after treatment.
© RSNA, 2013
Introduction
Radiofrequency (RF) ablation is a common, minimally invasive procedure for the treatment of primary and secondary liver tumors. Most imaging modalities, such as computed tomography (CT), magnetic resonance (MR) imaging, positron emission tomography (PET)/CT, and ultrasonography (US), have been utilized in monitoring the ablation procedure and in postablation assessment (1–6). Assessment of ablation efficacy is crucial to the success of the therapy; early detection of viable residual tumor and its rapid retreatment can considerably improve the outcome. In an ideal scenario, if we could discern the viable residual tumor immediately after ablation, it could be treated immediately. To evaluate coagulation necrosis, functional imaging techniques, such as fluorine 18 fluorodeoxyglucose PET/CT (7) and diffusion MR imaging (8,9) have been reported. However, these techniques are time consuming and expensive and are unable to be performed in real time. Because ablative treatments lead to coagulative necrosis of tissue, including vessels, another indirect strategy is evaluation of the extent of the patency of blood supply to the tumor tissue. Contrast material–enhanced CT and dynamic MR imaging have been widely used for the above purpose, and the absence of enhancement has been used as the criterion of a successful procedure (10–12). However, these tools are used in postablation assessment and not during the ablation. Previous experiments comparing contrast-enhanced imaging findings to pathologic findings in ablated liver tumor in human and normal rat kidneys indicated that the reliability of this criterion was high at 3 days after RF ablation. However, the accuracy during ablation and within 2 days after ablation is not well evaluated in the literature, and little work has been done to describe the evolution of the size of the unenhanced region during and after ablation (10,12). This information is crucial for evaluating the accuracy and predictability of any contrast-enhanced technique in both intraprocedural monitoring and posttherapy assessment of RF ablation.
US has been used in the guidance, monitoring, and postablation assessment of RF ablation. Estimation of the ablated region is not precise with conventional US because ablated tissue becomes hyperechoic, making it difficult to distinguish the distal boundary of the treated area (13). Contrast-enhanced US can provide an alternative means to noninvasively evaluate ablation efficacy in real time during and after the procedure more rapidly than can be achieved with contrast-enhanced CT and dynamic MR imaging (14–16). Prior research (16–18) indicates that contrast-enhanced US has a higher specificity in the assessment of immediate postprocedure tumor response (27%–94%) than contrast-enhanced CT, which demonstrates a specificity of 20%–24%. However, the accuracy of contrast-enhanced US imaging in evaluating cell viability during and after RF ablation is unknown. The purpose of our study was to examine the accuracy of the unenhanced zone at contrast-enhanced US in predicting coagulative necrosis during and 21 days after RF ablation in normal rat liver by using radiologic-pathologic comparison.
Materials and Methods
Preparation of US Contrast Agents
Lipid-shell microbubbles with a perfluoropropane gas (C3F8) core were prepared by using previously established techniques (19). Briefly, microbubbles were composed of 1,2-dipalmitoyl-sn-glycero-3-phosphocholine; 1,2-dipalmitoyl-sn-glycero-3-phosphoethanolamine; and 1,2-dipalmitoyl-sn-glycero-3-phosphate (Avanti Polar Lipids, Alabaster, Ala) with a mass ratio of 5:2:1. The lipid mixture was dissolved in chloroform, dried, and rehydrated in glycerol (Sigma-Aldrich, St Louis, Mo) and phosphate-buffered saline (pH, 7.0) (Sigma-Aldrich). An aliquot of the solution was then transferred into gas-tight vials into which perfluoropropane gas (C3F8) was added, and the bubbles were formed by agitation with a VialMix mixing machine (Du Pont Pharma, Billerica, Mass). Microbubble morphology was determined by using an optical microscope (Axio Observer.Z1; Carl Zeiss Microscopy, Jena, Germany), and the diameter was measured with a 90Plus Particle Size Analyzer (Brookhaven Instruments, Holtsville, NY). The microbubble composition is similar to that of Definity (perflutren lipid microsphere, Lantheus Medical Imaging, North Billerica, Mass), which has a half-life of 1.3 minutes in humans, according to its prescribing information (20). Fluorescently labeled microbubbles were made by using the same method, with the addition of DiI (1,1’-dioctadecyl-3,3,3′,3′-tetramethylindocarbocyanine perchlorate, Invitrogen, Eugene, Ore) to the lipid mixture prior to its dissolution in chloroform.
Overall Experiment Design
All experimental protocols were approved by the Institutional Animal Care and Use Committee at Case Western Reserve University. Twenty-eight adult Sprague-Dawley rats (average weight, 320 g) (Charles River Laboratories, Wilmington, Mass) were used for our study. Anesthesia was induced with 1.5%–3.5% isoflurane in oxygen (1 L/min) administered with a vaporizer (EZ150 Isoflurane Vaporizer; EZ Anesthesia, Palmer, Pa). Experiment 1 was performed to explore the change in the unenhanced zone on contrast-enhanced US images obtained during and after RF ablation (n = 4). The liver was ablated with RF ablation. Contrast-enhanced US was performed during the 6-minute ablation procedure and was repeated at 2 hours and 2, 7, 14, and 21 days after ablation. Experiment 2 was performed to explore the accuracy of the unenhanced region in predicting the coagulation necrosis zone (n = 24). DiI-labeled microbubbles were administered immediately after 2, 4, and 6 minutes of ablation or at 2 hours and 2, 7, 14, and 21 days after ablation (n = 3 rats per observation time point). The animal was euthanized, and the ablated liver was harvested. Fluorescence images were obtained first, followed by nicotinamide adenine dinucleotide hydrogen (NADH) staining of the cryosection slices. Hematoxylin-eosin staining of paraffin-embedded samples was performed. The findings on fluorescence images, NADH-stained images, and hematoxylin-eosin–stained images and the areas of DiI bubble–negative zones, NADH-negative zones, and lightly NADH-stained zones were compared.
US-guided RF Ablation and Contrast-enhanced US Scanning
In experiment 1, RF ablation was performed by using a 480-kHz RF generator (Cool-tip RF system; Covidien, Mansfield, Mass) and a custom-designed 21-gauge needle electrode with a 0.5-cm uninsulated tip, as previously described (21). US scanning was performed with an Aplio XG SSA-770A scanner with a 12-MHz linear imaging transducer (PLT-1204BT) (Toshiba Medical Imaging Systems, Tokyo, Japan). After the animals were anesthetized, a 24-gauge catheter was placed in a tail vein for contrast agent administration. The liver was scanned with two-dimensional US, and the optimal transverse imaging plane under the xiphoid process was chosen. The RF electrode was inserted into the median lobe of the rats’ livers to about 1 cm deep with two-dimensional US guidance (H.W. and L.R.W., with 12 and 5 years of experience, respectively). The transducer was immobilized by using a clamp, and images were acquired with the contrast harmonic imaging mode and the following parameters: harmonic frequency, 8.0 MHz; mechanical index, 0.1; imaging frame rate, 10 frames per second; dynamic range, 80 dB; and two-dimensional gain, 65 dB. An on-screen timer was started, and a solution of 0.05 mL of microbubbles was injected as a bolus via the tail vein through a 24-gauge catheter and was flushed with 0.5 mL of normal saline at the same time. Ten seconds later, ablation was started. The liver was ablated for 6 minutes at 80°C ± 2. Contrast-enhanced US scanning was performed continuously during the ablation. The injection of US contrast agent was repeated at 2–3-minute intervals. Contrast-enhanced US images were stored before ablation and 2, 4, and 6 minutes during ablation. The probe was then removed, and the animal was revived after ablation (6 minutes). At 2 hours and 2, 7, 14, and 21 days after ablation, the animal was anesthetized again, and contrast-enhanced US scanning was repeated. The contrast-enhanced US images that contained the maximal area of the unenhanced region were saved for analysis. The animals were euthanized by means of carbon dioxide inhalation on day 21. The ablated liver lobe was harvested and was sliced through the maximum area of the ablated zone. Gross images of the tissue were acquired by using a digital camera.
Hematoxylin-Eosin Staining, Fluorescence Imaging, and NADH Staining
In experiment 2, the liver was ablated as described previously without contrast-enhanced US scanning. DiI-labeled microbubbles were used to quantify the distribution of the US contrast agent in tissues. At every observation time point, 0.05 mL of DiI-labeled microbubbles were injected as a bolus via the tail vein and were flushed with 0.5 mL of normal saline. One minute later, the animal was euthanized with an overdose of pentobarbital sodium (Fatal Plus; Vortech Pharmaceuticals, Dearborn, Mich). The ablated tissue was harvested. One-half of the sample was fixed in 10% formaldehyde and embedded in paraffin. Hematoxylin-eosin staining of the tissue sample was routinely performed by the Tissue Procurement and Histology Core Facility of the Case Comprehensive Cancer Center. The other half of the sample was frozen on dry ice after being embedded in optimal cutting temperature compound (Sakura Finetek USA, Torrance, Calif) and was cut into 8-µm-thick slices by using a CM1850 cryostat (Leica, Heidelberger, Germany). A tiling fluorescence image of the slice was first acquired with an inverted microscope by using filter set 20 (rhodamine filter; excitation, 546 nm; emission, 575–640 nm) and a digital camera (C10600; Hamamatsu Photonics, Hamamatsu City, Japan).
After the fluorescence images were acquired, the same slice was then incubated for 30 minutes in a humidified chamber at 37°C with a test solution containing 0.8 mg/mL NADH and 1 mg/mL nitroblue tetrazolium (NBT) dissolved with Tris buffer. The slice was then processed with 30%, 60%, 90%, and 30% acetone solutions to remove unbound NBT and was finally rinsed with distilled water, covered with a permanent aqueous mount, and dried at room temperature. The tiling NADH-stained image was then acquired by the same microscope by using bright field microscopy and a digital microscope camera (AxioCam ICc 3; Carl Zeiss Microscopy).
Image Analysis
In experiment 1, the contrast-enhanced US images and the gross images of the ablated liver samples were analyzed by using ImageJ, version 1.42 (http://rsbweb.nih.gov/ij/download.html). The unenhanced zone on contrast-enhanced US images and the “dead zone” on gross images from day 21 after ablation were manually selected by H.W. The areas of these zones were measured. The linear correlation between the area of the unenhanced zone on the contrast-enhanced US images and that of the dead zone on gross images from day 21 after ablation was analyzed. In each animal, the normalized area of the unenhanced zone was calculated by dividing the absolute value of the area at each observation time point by the area 6 minutes after RF ablation.
Histologic images in experiment 2 were analyzed with AxioVision LE, version 4.8.1.0 (Carl Zeiss MicroImaging, Jena, Germany). The DiI bubble–negative zones on fluorescence images and negative-staining zones or lightly staining zones on NADH-stained images were manually drawn by H.W. The areas of these zones were measured and compared. The fluorescence images and the corresponding NADH-stained images were fused by using Photoshop CS5 (Adobe Systems, San Jose, Calif) so that we could compare the consistency of the boundaries of the DiI bubble–negative zones and ablated and/or damaged zones.
Hematoxylin-eosin stained images of the ablated tissue were analyzed by using the Patterson method (22). In brief, the changes in the ablated liver in the acute phase (up to 2 days after the ablation) were divided into four zones: Zone A consisted of a hollowed central space representing the probe shaft and zone B consisted of a pale area containing totally disrupted cells, while zone C (also pale) microscopically demonstrated little mechanical disruption, with intact hepatocyte nuclei and sinusoids containing “ghost” erythrocytes. The outer zone D (hyperemic zone) appeared dark red, and microscopically, sinusoids were congested with hemoglobin-laden erythrocytes. The evolution of these four zones and the findings in the corresponding fluorescence and NADH-stained images were analyzed and compared.
Statistical Analysis
All data are presented as means ± standard deviations. The differences between the areas of NADH-negative zones, damaged zones on NADH-stained images, and DiI bubble–negative zones on the corresponding fluorescence images at each observation time point were evaluated by using one-way analysis of variance for correlated samples followed by the Tukey honestly significant difference multiple comparison test (VassarStats; http://vassarstats.net/). P < .05 was considered to indicate a statistically significant difference.
Results
Tissue Changes during and after RF Ablation
Contrast-enhanced US images demonstrated distinctive unenhanced zones during and after ablation (Fig 1). The change in area of the unenhanced zone is shown in Figure 2. Before ablation, the area of the unenhanced zone was a mean of 0.15 ± 0.18 (standard deviation) times the area immediately after 6 minutes of ablation, which represents the tissue damage induced by the probe insertion. During ablation, the area of the unenhanced zone as monitored in real time was seen to increase. After ablation, the area of the unenhanced zone increased rapidly at 2 hours (1.25 ± 0.21 times the area immediately after ablation) and reached the maximum on day 2 (1.28 ± 0.17 times the area immediately after ablation). The ratio of the mean normalized area on hour 2 to that on day 2 was 97.7% (1.25/1.28). After day 2, the area of the unenhanced zone subsequently reduced. On day 21, the mean area of the unenhanced zone at contrast-enhanced US and that of the ablated zone on gross images was 0.138 cm2 ± 0.112 (0.33 ± 0.13 times the area immediately after ablation) and 0.146 cm2 ± 0.120, respectively. The correlation coefficient (r value) of radiologic-pathologic correlation for the area measurements was 0.999.
Figure 1:
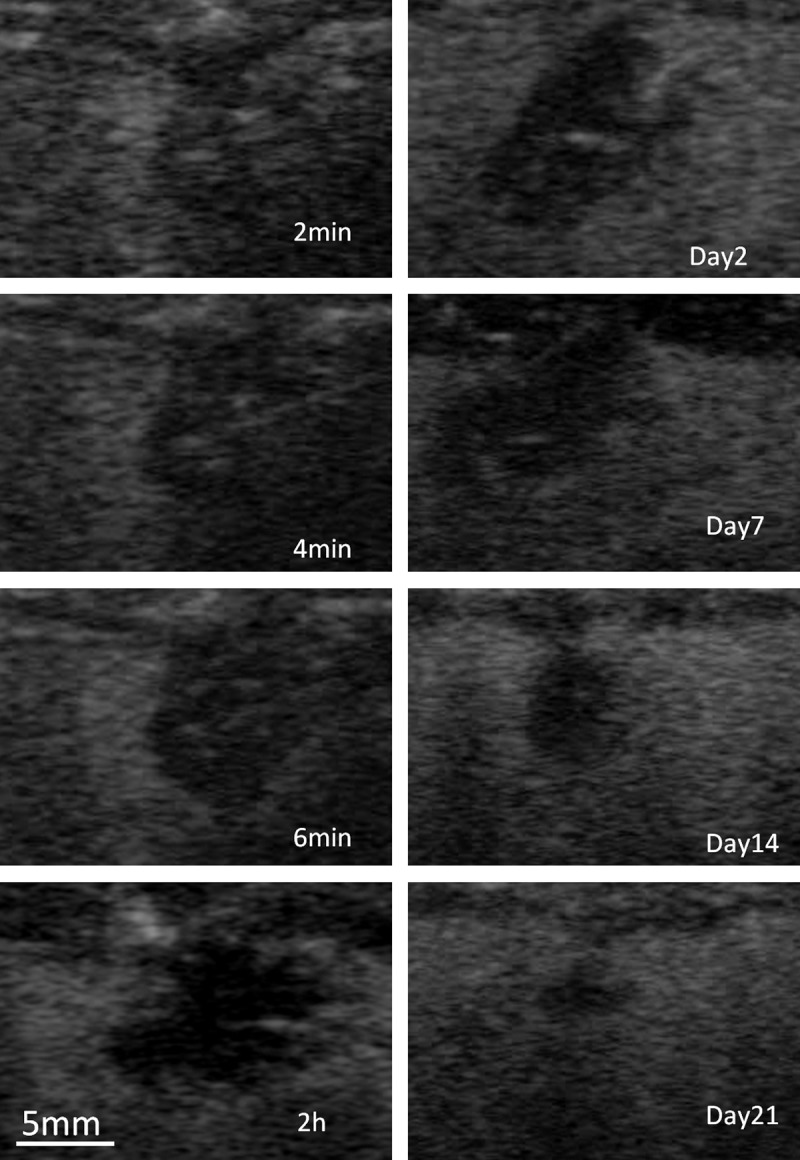
Representative transverse contrast-enhanced US images of ablated rat liver obtained 2, 4, and 6 minutes into the procedure and 2 hours and 2, 7, 14, and 21 days after the procedure.
Figure 2:
Boxplot shows the changes in area of the unenhanced zone normalized to the area at 6 minutes after ablation, as monitored with contrast-enhanced US. Lines = means, boxes = 25th–75th percentile, whiskers = individual values.
Comparison of Size of DiI Bubble–Negative Zone and Damaged Zone on NADH-stained Images
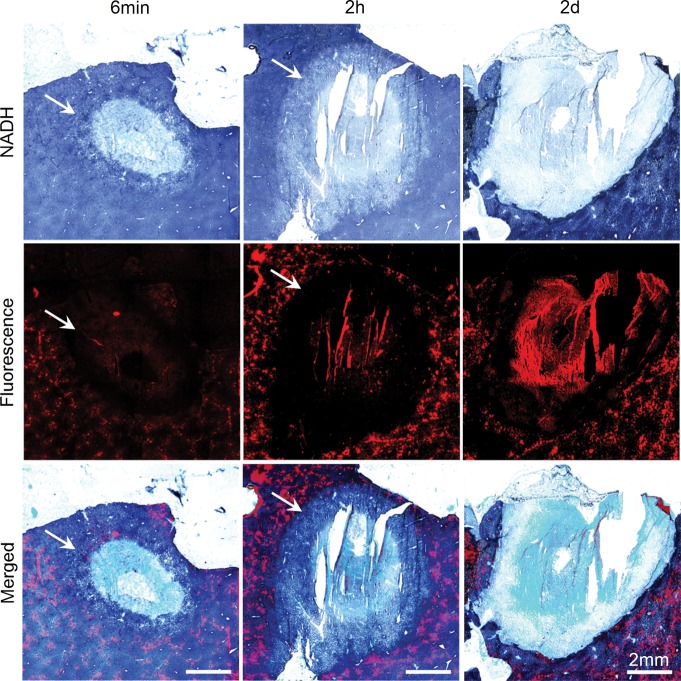
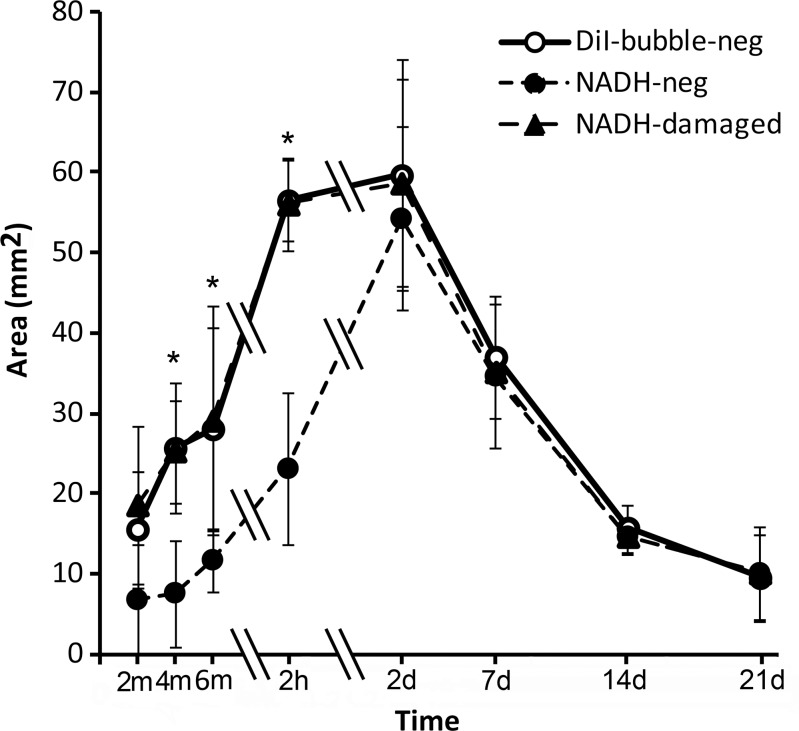
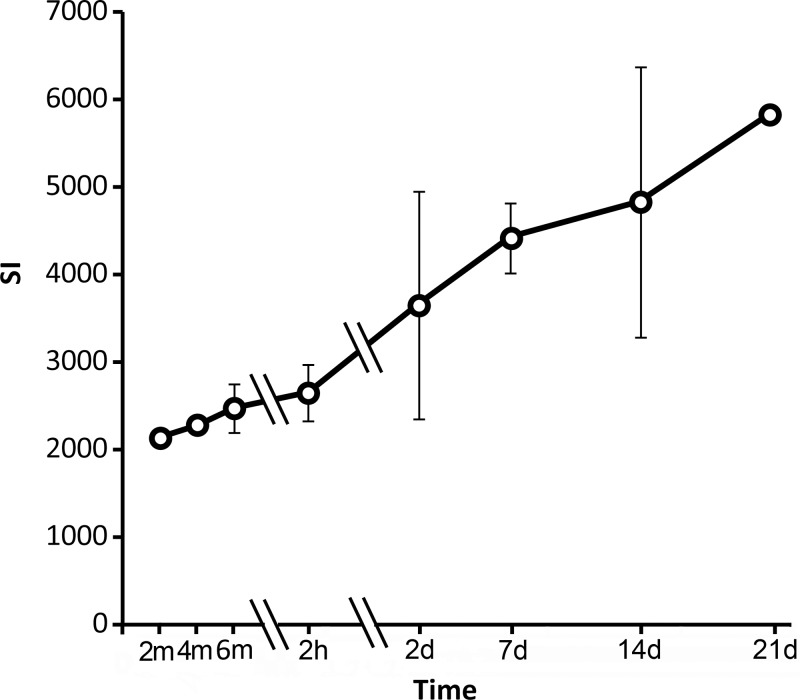
Figure 3 shows representative fluorescence images, NADH-stained images, and merged images obtained immediately, 2 hours, and 2 days after ablation (images from other observation time points are shown in Fig E1 [online]). DiI-labeled microbubbles appeared a bright orange-red on the fluorescence images. On NADH-stained images, normal liver stained dark blue. An unstained area was noted in the ablated zone. A lightly stained area (the transition zone) was noted adjacent to the unstained ablated area at all three time points during ablation and at 2 hours after ablation. This zone disappeared on day 2 after ablation. The damaged zone includes the unstained zone and the transition zone. Figure 4 shows the area of the NADH-negative zone, the damaged zone on NADH images, and the DiI bubble–negative zone on the corresponding fluorescence images at each observation time point. These three areas increased in size during ablation, reached a peak on day 2 after ablation, and then reduced in size. In the initial 2 hours after ablation, the areas of DiI bubble–negative zones on fluorescence images and damaged zone on NADH images increased rapidly. On the contrary, the area of NADH-negative zones increased slowly. The ratios of the mean areas in these three zones on hour 2 to those on day 2 (maximum) were 94.6% (56.5/59.7 mm2), 95.6% (56.1/58.7 mm2), and 42.5% (23.1/54.3 mm2), respectively. The areas of the DiI bubble–negative zone on fluorescence images and the damaged zone on corresponding NADH-stained images were closely matched and without significant difference. The mean ratios of the area of the damaged zone to the area of the DiI bubble–negative zone were between 0.97 and 1.06 at all observation time points. The area of the NADH-negative zone was smaller than that of the DiI bubble–negative zone at observation time points during ablation and 2 hours after ablation. Significant differences were noted at these observation time points except at 2 minutes of ablation. The mean ratios of NADH-negative zone to DiI bubble–negative zone were between 0.32 and 0.57. These two zones were consistent with each other on days 2–21, and the mean area ratios of the NADH-negative zone to the DiI bubble–negative zone were 0.91–1.06. Auto fluorescence was also noted in the ablated region. The signal intensity in this region increased consistently after ablation (Fig 5).
Figure 3:
Representative NADH-stained, fluorescence, and merged images of the ablated liver at 6 minutes of ablation and 2 hours and 2 days after ablation. A transition zone (arrows) was noted at observation time points during ablation and within 2 days after ablation.
Figure 4:
Graph shows changes in the DiI bubble–negative zone, the NADH-negative zone, and the damaged zone. * = P < .05, NADH-negative zone versus DiI bubble–negative zone (one-way analysis of variance for correlated samples, Tukey honestly significant difference multiple comparison test). Double slash marks = time intervals, error bars = standard deviations.
Figure 5:
Graph shows changes in autofluorescence signal intensity (SI) in the coagulation zone. Double slash marks = compressed time intervals, error bars = standard deviations.
Histologic Observations on Hematoxylin-Eosin–stained Images
Figure 6 shows the typical four zones (A, B, C, and D) of thermally ablated liver on hematoxylin-eosin–stained images and corresponding NADH-stained images. In zone B, the cells were pyknotic, and the cytoplasm of the hepatocytes of the damaged liver tissue was eosinophilic. The shape of the hepatocytes was preserved, and no obvious cell shrinkage was noted in zones C and D. Numerous erythrocytes were packed in the sinusoids in zone D. On corresponding NADH-stained images, zones B and C stained negative, and zone D exhibited partial staining.
Figure 6a:
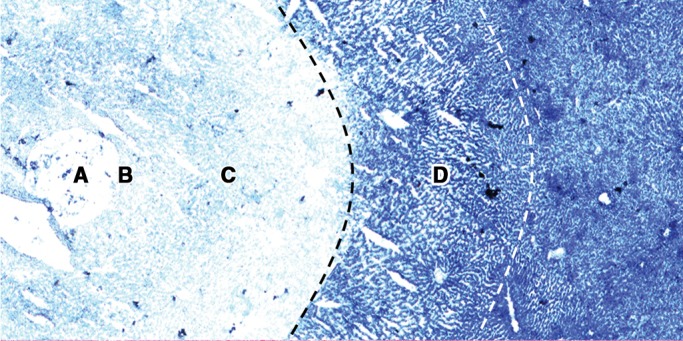
(a) NADH-stained image and (b) corresponding hematoxylin-eosin–stained image in representative ablated liver sample show the typical four zones (A–D) of tissue change after thermal ablation. Original magnification, ×10.
Figure 6b:
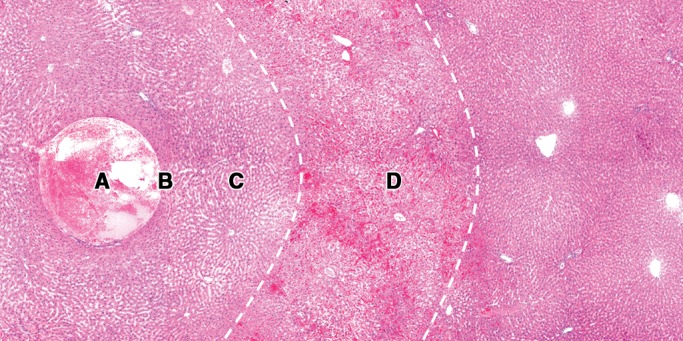
(a) NADH-stained image and (b) corresponding hematoxylin-eosin–stained image in representative ablated liver sample show the typical four zones (A–D) of tissue change after thermal ablation. Original magnification, ×10.
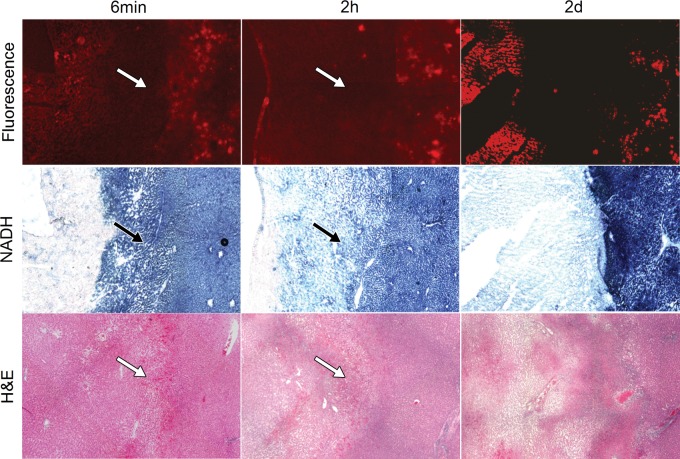
Figure 7 shows the correlation of DiI fluorescence images and NADH-stained images to hematoxylin-eosin–stained images from immediately after, 2 hours after, and 2 days after ablation (images from postablation days 7 and 21 are shown in Fig E2 [online]). Complete coagulation necrosis was noted in the central portions of treated areas. The typical four-zone histologic changes were noted during ablation and 2 hours after ablation. Zone D (the hyperemic zone) on hematoxylin-eosin–stained images from within 2 days after ablation was the transition zone on NADH-stained images and the DiI bubble–negative zone on fluorescence images. On day 2, the typical four-zone histologic changes disappeared. On day 7 and later, the coagulated zone appeared to be involved in coagulation necrosis, and the marginal zone was clearly encapsulated by fibrous granulation tissue that consisted of connective tissue, fibroblasts, capillaries, and inflammatory cells. At each time point, the boundary of the DiI bubble–negative zone was matched with that of the damaged zone on NADH-stained images and with that of zone D (the hyperemic zone) or the fibrous capsule on hematoxylin-eosin–stained images.
Figure 7:
Correlation of fluorescence images and NADH-stained images with hematoxylin-eosin–stained images at 6 minutes of ablation and 2 hours and 2 days after ablation. A hyperemic zone (arrows) was noted at observation time points during ablation and within 2 days after ablation. This zone appears as a lightly NADH-staining zone on NADH-stained images and as a DiI bubble–negative zone on fluorescence images. Original magnification, ×10.
Discussion
In our study, using normal rat livers, we explored changes in the unenhanced zone at contrast-enhanced US imaging at multiple time points during and after ablation. As expected, the unenhanced zone expanded with increasing ablation time. We also noted that although the area of the unenhanced zone reached a peak on day 2, it increased rapidly within the initial 2 hours. The mean area of the unenhanced zone was 97.7% of the maximum area on day 2. This may be due to the conversion of sublethally damaged cells to full cell death. Because the unenhanced zone represented the nonviable area at histologic examination, this indicates that 2 hours after RF ablation might be the earliest time to closely approximate the maximum damaged zone with contrast-enhanced US and that 2 days may be the optimal time point for assessing treatment efficacy because the area measured at contrast-enhanced US is equivalent to that measured by the absence of NADH staining. This is supported by Goldberg et al (23), who reported the role of the adjuvant effect of chemotherapy on RF ablation in a subcutaneous tumor model and noted that at least 48 hours were required before coagulation fully evolved.
The development and evolution of thermally ablated tissue over time at hematoxylin-eosin staining has been explored by others (24,25). It is agreed that a clear appearance of cell damage in the ablated area does not manifest on hematoxylin-eosin–stained images within 1 or 2 days after thermal ablation. The shape of the ablated cells was intact, and surrounding hyperemic changes (congestion of erythrocytes in the sinusoidal spaces) were reported in the ablated zone. The real boundary of cell damage on hematoxylin-eosin–stained images in this period (within 2 days after ablation) is difficult to determine. Enzyme activity staining, such as NADH staining, is used to detect cell viability and to determine the boundary of cell damage, as previously demonstrated (26). In our study, we noticed that a transition zone, which stained light blue with NADH, was present during the 6 minutes of ablation and until 2 days after ablation. This finding has not been previously reported in the literature, to the best of our knowledge. Since the transition zone stained lighter blue than normal liver tissue in NADH staining and stained negative after the 2-day postablation time point, this indicates that the cells in the transition zone were damaged and preserved partial enzyme viability within 2 days after ablation. Thus, when we analyzed the NADH images, we used the boundary of the lightly NADH-staining zone as the boundary of the thermal damage zone. However, the accuracy of NADH staining in predicting the final coagulative necrosis within 2 days after ablation is questionable. We found that the area of the damaged zone on the NADH-stained images increased after treatment and reached a peak 2 days later. The final maximum area of the damaged zone (on day 2) was two times that of the area immediately after ablation. This suggests that NADH staining immediately after ablation would lead to underestimation of the final area of the coagulation zone. Two days are needed for thermal ablation to reach maximum efficacy, and during this time period, some viable but damaged tissue adjacent to the damaged zone on NADH-stained images transitions to nonviability. However, we also noticed rapid increases in the areas of the damaged zone and the DiI bubble–negative zone at 2 hours after ablation, which reached about 95% of the maximum on day 2. This suggests that contrast-enhanced US could help evaluate the approximately maximal area of coagulation as early as 2 hours after ablation.
Anderson et al (27) suggest that the course of NADH staining conversion after RF ablation comprises two types, rapid and prolonged. The initial heating may result in acute enzymatic damage and nonviability at NADH staining immediately after ablation. The mechanism of prolonged NADH staining conversion is still unknown. It may be due to the slower loss of enzymatic function secondary to microvascular and arteriolar occlusion. The transition zone on NADH-stained images within 2 days after ablation is part of the prolonged conversion. We found that the transition zone correlated with the hyperemic zone (zone D) on hematoxylin-eosin–stained images. The hyperemic changes in this zone are a manifestation of sinusoid damage induced by heat. This supports the assumption that the prolonged NADH staining conversion results from slower loss of enzymatic function secondary to microvascular and arteriolar occlusion.
Our study results showed that the boundary of the damaged zone on NADH-stained images was highly matched with the DiI bubble–negative zone at every time point. This indicates that the unenhanced zone on contrast-enhanced US images could predict the damaged zone on NADH-stained images. We also noticed rapid increases in the damaged zone and the DiI bubble–negative zone 2 hours after ablation—increases that reached about 95% of the maximum on day 2. This suggests that contrast-enhanced US could be used to evaluate the approximately maximal area of coagulation as early as 2 hours after ablation.
Our study had several limitations. First, the contrast-enhanced US images were not directly compared with the NADH-stained images because the livers were not sliced in the same plane in which the US images were obtained. Instead, we performed the comparison on fluorescence images and NADH-stained images after DiI-labeled microbubble administration on the same slide. Hence, a systemic error might exist between these fluorescence images and representative contrast-enhanced US images. Second, our study was performed in normal rat livers. A similar study would need to be performed in a liver tumor model to increase the clinical relevance of the findings.
Practical applications: The results of our study demonstrate that the area of the thermal coagulation zone (NADH-negative zone) induced by RF ablation increases until 2 days after treatment, on the basis of NADH staining. A transition zone (lightly NADH stained) is seen adjacent to the coagulation zone until 2 days after ablation. This zone may be damaged, and this damage is likely to be irreversible. At histologic examination, the damaged zone on NADH-stained images corresponded to the DiI bubble–negative zone. Contrast-enhanced US has a superior or equivalent ability to NADH staining for monitoring the effects of RF ablation in real time and for quantifying the size of thermal damage after treatment. NADH staining and contrast-enhanced US immediately after ablation appear to result in underestimation of the final maximal damaged area. However, contrast-enhanced US can depict a zone equivalent (97.7%) to the maximum damaged zone as early as 2 hours after ablation. Contrast-enhanced US could help evaluate the approximately maximal area of coagulation as early as 2 hours after ablation. Contrast-enhanced US may thus be an accurate, convenient tool for monitoring the early damage after RF ablation.
Advances in Knowledge
■ On nicotinamide adenine dinucleotide hydrogen (NADH)-stained images, a transition zone (lightly NADH stained) manifested adjacent to the coagulation zone (NADH-negative zone) until 2 days after radiofrequency (RF) ablation.
■ The areas of the unenhanced zone of ablated rat liver on contrast-enhanced US images, the damaged zone on NADH images, and the DiI bubble–negative zone on fluorescence images reached a peak on day 2 after treatment.
■ High uniformity between the damaged zone on NADH-stained images and the DiI bubble–negative zone on fluorescence images was noted at all observation time points.
Implications for Patient Care
■ The best time point to evaluate the size of thermal coagulation caused by RF ablation is on day 2 after treatment.
■ For postablation assessment, contrast-enhanced US may have the ability to help determine the maximum damaged area as early as 2 hours after ablation.
SUPPLEMENTAL FIGURES
Acknowledgments
Acknowledgment
We thank Hong Shi, MD, of the Case Cardiovascular Research Institute, Case Western Reserve University, for her technical support with histologic processing.
Received September 5, 2012; revision requested November 15; revision received April 24, 2013; accepted May 3; final version accepted May 23.
The content of this article is solely the responsibility of the authors and does not necessarily represent the official views of the National Institutes of Health.
Disclosures of Conflicts of Interest: H.W. No relevant conflicts of interest to disclose. L.R.W. No relevant conflicts of interest to disclose. N.P.Z. No relevant conflicts of interest to disclose. J.R.H. No relevant conflicts of interest to disclose. A.A.E. No relevant conflicts of interest to disclose.
Funding: Research reported in this publication was supported by the National Cancer Institute of the National Institutes of Health under award R21CA131014 to A.A.E.
Abbreviations
- NADH
- nicotinamide adenine dinucleotide hydrogen
- RF
- radiofrequency
References
- 1.Boss A, Rempp H, Martirosian P, et al. Wide-bore 1.5 Tesla MR imagers for guidance and monitoring of radiofrequency ablation of renal cell carcinoma: initial experience on feasibility. Eur Radiol 2008;18(7):1449–1455. [DOI] [PubMed] [Google Scholar]
- 2.Maruyama H, Takahashi M, Ishibashi H, et al. Ultrasound-guided treatments under low acoustic power contrast harmonic imaging for hepatocellular carcinomas undetected by B-mode ultrasonography. Liver Int 2009;29(5):708–714. [DOI] [PubMed] [Google Scholar]
- 3.Lyrdal D, Andersson M, Hellström M, Sternal J, Lundstam S. Ultrasound-guided percutaneous radiofrequency ablation of small renal tumors: clinical results and radiological evolution during follow-up. Acta Radiol 2010;51(7):808–818. [DOI] [PubMed] [Google Scholar]
- 4.Schoellnast H, Larson SM, Nehmeh SA, Carrasquillo JA, Thornton RH, Solomon SB. Radiofrequency ablation of non-small-cell carcinoma of the lung under real-time FDG PET CT guidance. Cardiovasc Intervent Radiol 2011;34(Suppl 2):S182–S185. [DOI] [PubMed] [Google Scholar]
- 5.Solomon SB, Bohlman ME, Choti MA. Percutaneous gadolinium injection under MR guidance to mark target for CT-guided radiofrequency ablation. J Vasc Interv Radiol 2002;13(4):419–421. [DOI] [PubMed] [Google Scholar]
- 6.Chopra SS, Schmidt SC, Wiltberger G, et al. Laparoscopic radiofrequency ablation of liver tumors: comparison of MR guidance versus conventional laparoscopic ultrasound for needle positioning in a phantom model. Minim Invasive Ther Allied Technol 2011;20(4):212–217. [DOI] [PubMed] [Google Scholar]
- 7.Chen W, Zhuang H, Cheng G, Torigian DA, Alavi A. Comparison of FDG-PET, MRI and CT for post radiofrequency ablation evaluation of hepatic tumors. Ann Nucl Med 2013;27(1):58–64. [DOI] [PubMed] [Google Scholar]
- 8.Lu TL, Becce F, Bize P, Denys A, Meuli R, Schmidt S. Assessment of liver tumor response by high-field (3 T) MRI after radiofrequency ablation: short- and mid-term evolution of diffusion parameters within the ablation zone. Eur J Radiol 2012;81(9):e944–e950. [DOI] [PubMed] [Google Scholar]
- 9.Germain D, Chevallier P, Laurent A, Saint-Jalmes H. MR monitoring of tumour thermal therapy. MAGMA 2001;13(1):47–59. [DOI] [PubMed] [Google Scholar]
- 10.Goldberg SN, Gazelle GS, Compton CC, Mueller PR, Tanabe KK. Treatment of intrahepatic malignancy with radiofrequency ablation: radiologic-pathologic correlation. Cancer 2000;88(11):2452–2463. [PubMed] [Google Scholar]
- 11.Akeboshi M, Yamakado K, Nakatsuka A, et al. Percutaneous radiofrequency ablation of lung neoplasms: initial therapeutic response. J Vasc Interv Radiol 2004;15(5):463–470. [DOI] [PubMed] [Google Scholar]
- 12.Johnson DB, Duchene DA, Taylor GD, Pearle MS, Cadeddu JA. Contrast-enhanced ultrasound evaluation of radiofrequency ablation of the kidney: reliable imaging of the thermolesion. J Endourol 2005;19(2):248–252. [DOI] [PubMed] [Google Scholar]
- 13.Curley SA, Izzo F, Ellis LM, Nicolas Vauthey J, Vallone P. Radiofrequency ablation of hepatocellular cancer in 110 patients with cirrhosis. Ann Surg 2000;232(3):381–391. [DOI] [PMC free article] [PubMed] [Google Scholar]
- 14.Meloni MF, Livraghi T, Filice C, Lazzaroni S, Calliada F, Perretti L. Radiofrequency ablation of liver tumors: the role of microbubble ultrasound contrast agents. Ultrasound Q 2006;22(1):41–47. [PubMed] [Google Scholar]
- 15.Solbiati L, Ierace T, Tonolini M, Cova L. Guidance and monitoring of radiofrequency liver tumor ablation with contrast-enhanced ultrasound. Eur J Radiol 2004;51(Suppl):S19–S23. [DOI] [PubMed] [Google Scholar]
- 16.Vilana R, Bianchi L, Varela M, et al. Is microbubble-enhanced ultrasonography sufficient for assessment of response to percutaneous treatment in patients with early hepatocellular carcinoma? Eur Radiol 2006;16(11):2454–2462. [DOI] [PubMed] [Google Scholar]
- 17.Kapoor A, Kapoor A, Mahajan G. Technical note: radiofrequency ablation of hepatocellular carcinoma with contrast-enhanced ultrasound guidance—first Indian experience. Indian J Radiol Imaging 2011;21(2):121–123. [DOI] [PMC free article] [PubMed] [Google Scholar]
- 18.Livraghi T, Goldberg SN, Lazzaroni S, et al. Hepatocellular carcinoma: radio-frequency ablation of medium and large lesions. Radiology 2000;214(3):761–768. [DOI] [PubMed] [Google Scholar]
- 19.Krupka TM, Solorio L, Wilson RE, Wu H, Azar N, Exner AA. Formulation and characterization of echogenic lipid-Pluronic nanobubbles. Mol Pharm 2010;7(1):49–59. [DOI] [PMC free article] [PubMed] [Google Scholar]
- 20.Platts DG, Fraser JF. Contrast echocardiography in critical care: echoes of the future? a review of the role of microsphere contrast echocardiography. Crit Care Resusc 2011;13(1):44–55. [PubMed] [Google Scholar]
- 21.Wu H, Exner AA, Krupka TM, Weinberg BD, Patel R, Haaga JR. Radiofrequency ablation: post-ablation assessment using CT perfusion with pharmacological modulation in a rat subcutaneous tumor model. Acad Radiol 2009;16(3):321–331. [DOI] [PMC free article] [PubMed] [Google Scholar]
- 22.Patterson EJ, Scudamore CH, Owen DA, Nagy AG, Buczkowski AK. Radiofrequency ablation of porcine liver in vivo: effects of blood flow and treatment time on lesion size. Ann Surg 1998;227(4):559–565. [DOI] [PMC free article] [PubMed] [Google Scholar]
- 23.Goldberg SN, Girnan GD, Lukyanov AN, et al. Percutaneous tumor ablation: increased necrosis with combined radio-frequency ablation and intravenous liposomal doxorubicin in a rat breast tumor model. Radiology 2002;222(3):797–804. [DOI] [PubMed] [Google Scholar]
- 24.Wiersinga WJ, Jansen MC, Straatsburg IH, et al. Lesion progression with time and the effect of vascular occlusion following radiofrequency ablation of the liver. Br J Surg 2003;90(3):306–312. [DOI] [PubMed] [Google Scholar]
- 25.Fujitomi Y, Kashima K, Ueda S, Yamada Y, Mori H, Uchida Y. Histopathological features of liver damage induced by laser ablation in rabbits. Lasers Surg Med 1999;24(1):14–23. [DOI] [PubMed] [Google Scholar]
- 26.Manenti G, Bolacchi F, Perretta T, et al. Small breast cancers: in vivo percutaneous US-guided radiofrequency ablation with dedicated cool-tip radiofrequency system. Radiology 2009;251(2):339–346. [DOI] [PubMed] [Google Scholar]
- 27.Anderson JK, Baker M, Jaffers O, Pearle MS, Lindberg GL, Cadeddu JA. Time course of nicotinamide adenine dinucleotide diaphorase staining after renal radiofrequency ablation influences viability assessment. J Endourol 2007;21(2):223–227. [DOI] [PubMed] [Google Scholar]
Associated Data
This section collects any data citations, data availability statements, or supplementary materials included in this article.


