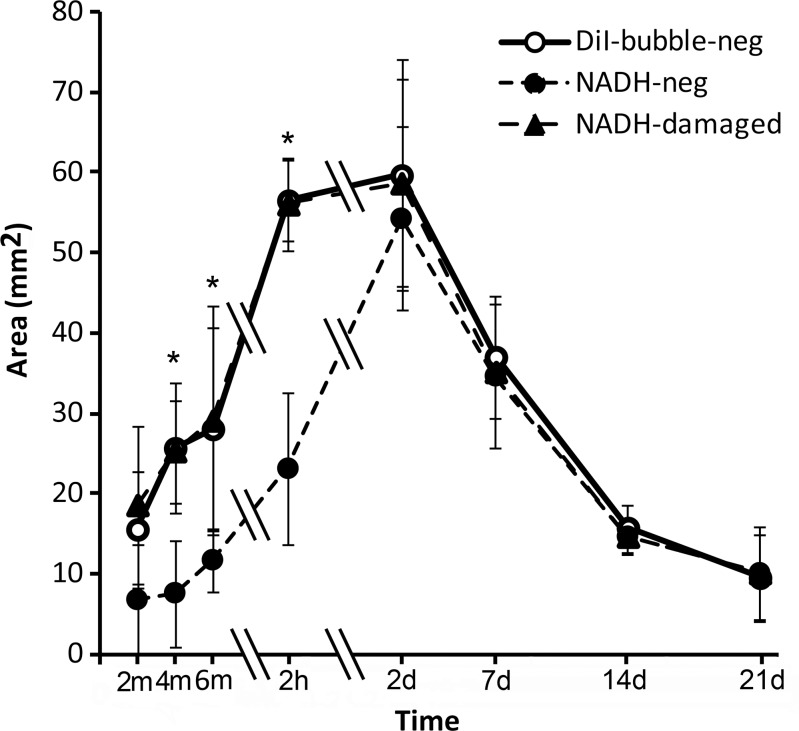
Figure 4:
Graph shows changes in the DiI bubble–negative zone, the NADH-negative zone, and the damaged zone. * = P < .05, NADH-negative zone versus DiI bubble–negative zone (one-way analysis of variance for correlated samples, Tukey honestly significant difference multiple comparison test). Double slash marks = time intervals, error bars = standard deviations.

